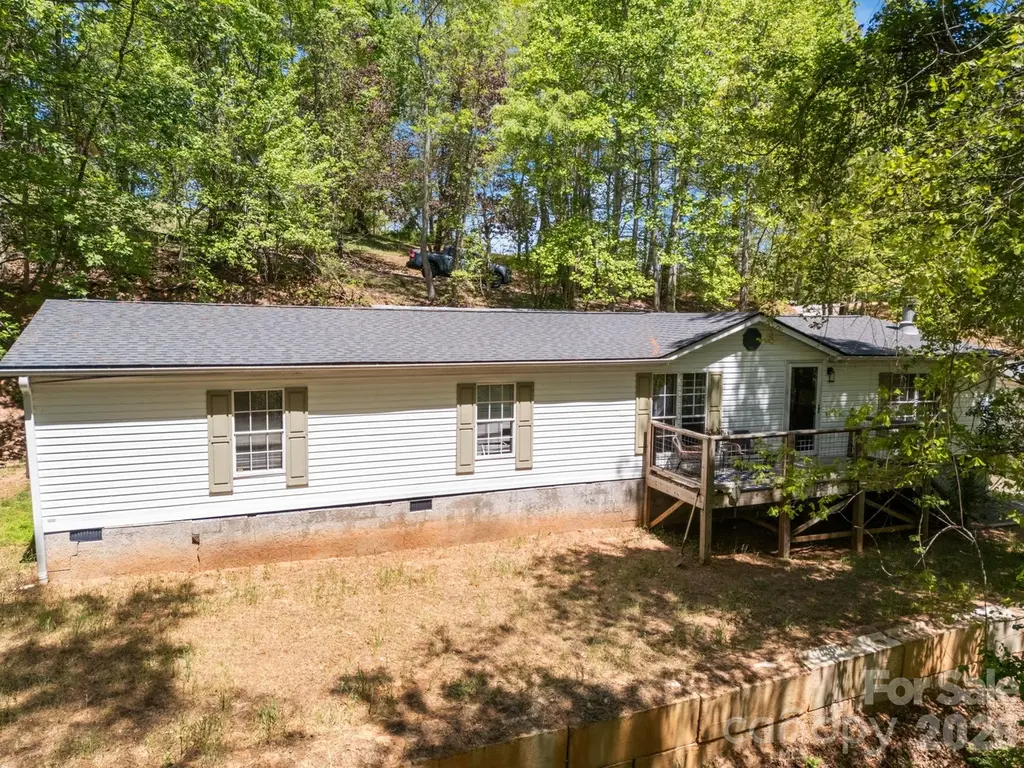
25 Weaver Ln · Black Mountain, NC
Flood risk 1/10 · Minimal
- FEMA flood zone
- X (unshaded)
- Chance of flooding over 30 yrs
- 0.0%
- Est. flood insurance / yr
- $507 – $1,088
Fire risk 3/10 · Minor
- Est. fire insurance / yr
- $906 – $1,684
Heat risk 3/10 · Minor
- Hot days now (above 94°F)
- 8 days/yr
- Hot days in 30 yrs
- 22 days/yr
Wind risk 2/10 · Minimal
- Chance of severe wind over 30 yrs
- —
Air-quality risk 4/10 · Minor
- Unhealthy air days now
- 4 days/yr
- Unhealthy air days in 30 yrs
- 5 days/yr
Risk factors via First Street. Map © Google.
Why this score? — see what drove the D grade
The composite is a weighted blend of 9 inputs, each scored 0–100. Each bar is that input's sub-score; the figure is the points it added to the 100-point composite (weight × sub-score).
- Cash flow +14.4/30.0
- ARV discount +7.5/15.0
- DSCR +4.4/10.0
- Livability +4.4/5.0
- Schools +4.0/10.0
- 1% rule +2.9/10.0
- Rent growth +2.5/5.0
- Condition / age +2.5/5.0
- Appreciation +0.0/10.0
$275,000
🖨 Deal sheet 📄 Offer letter ✓ Due diligence
Listing remarks
Tucked away in the heart of Black Mountain, this charming 3-bedroom, 2-bath doublewide offers the kind of easy mountain living that just feels right from the moment you pull in. Step onto the front deck, take a breath of that crisp mountain air, and you’ll immediately understand what makes this place special. Out back, a covered porch creates the perfect space for slow mornings, evening gatherings, or just unwinding after a long day. Inside, the home offers a comfortable and functional layout with plenty of room to spread out, whether you’re settling in full-time or looking for a weekend retreatLocation is where this one really shines—just moments from Lake Tomahawk, a loc
Key facts
- Covered porch
- Front deck
- Scenic walking trail
Tags
Property features AI
Finance
- HOA & community: No HOA
Exterior
- Parking: Detached 2-car garage; Driveway; Main level garage present
- Utilities: City water; Public sewer; Publicly maintained road; Road surface: paved and gravel
- Home design: Single-family manufactured doublewide; One story; Residential property
- Construction: Manufactured construction; Vinyl exterior; Crawl space foundation
- Exterior features: Covered front and rear porches
Interior
- Kitchen: Dishwasher; Electric range; Refrigerator
- Bedrooms: 3 bedrooms (all on the main level)
- Bathrooms: 2 full bathrooms (all on the main level)
- Heating & cooling: Central heating; Central air conditioning
- Interior features: 10 total rooms; Mud room
- Laundry & utility: Laundry in mud room
Neighborhood map
What this means for you Summary
Snapshot
- This is a 3-bed/2.0-bath manufactured listed at $275k.
Deal economics
- At list price, monthly cash flow is $56 ($667/yr) — positive.
- The deal already cash-flows at list — no discount required.
- To meet the 1% rule (rent ≥ 1% of price), the offer needs to be $217k (21.1% below list).
- Recommended offer: $217k (21.1% below list) — sets the bar for 1% rule.
- Cap rate 6.5% vs local median 2.3% in Black Mountain — top-decile yield for the area; either an underpriced asset or a hidden risk that comps aren't pricing in. Stress-test before assuming the spread holds.
Location & tenants
- Location reads 87/100 on livability (#2 in NC, #297 nationally) — a professional / high-income tenant draw. Strengths: crime A+, amenities A+, health & safety A+.
- Buncombe County Schools (suburban): math 45% / reading 50% proficiency, ranked #72 of 178 in NC (top 40%) — families likely to look elsewhere, expect single-tenant / working-renter base with shorter leases.
- Zoned schools: Black Mountain Primary (math 57% / reading 57%, grade C+, #249 of 1,410 statewide, top 20%, 323 students, 56% FRL).
- Market conditions: 302 active listings in the ZIP; 8 comparable units currently listed for rent nearby; rentals at typical pace (median 24d on market — plan ~3-4 weeks tenant-placement turnaround); 3,305 units permitted in Buncombe County in 2024 (1,855 in 5+ unit buildings).
- This rent runs 35% of the median local income ($75k/yr) — at the standard rent-burdened threshold; future hikes will face affordability resistance.
Forward outlook
- Local home prices are declining (-3.0%/yr); year-one equity from $2k of loan paydown is wiped out by about $8k of value loss. Plan a longer hold.
- Buncombe County population projected at +24% by 2050 — long-run rental-demand tailwind backs the buy-and-hold thesis.
Negotiation context
- It's been on market 50 days — a 3% lower offer ($267k) is reasonable based on typical stale-listing flexibility.
Questions for the listing agent
- It's been on market 50 days. Have you received any prior offers? Is the seller open to a 21% concession, seller financing, or rate buy-down credit?
- Is there a deadline driving the sale (1031 exchange, divorce, estate, relocation)? That informs how much negotiation room exists.
- The area grade is low — what's the realistic commute time and amenity access for the typical tenant pool here? Any planned neighborhood developments (good or bad) we should know about?
- What's the average days-on-market for RENTAL listings here right now (not sales)? A rising rental-DOM trend means longer vacancies and softer asking-rent achievability than the comps imply.
- What's the recent tenant-quality profile in this submarket — average credit score on applications, eviction rate, late-payment / NSF rate, and stable-employment percentage? A property-management company in the area should have these aggregated.
- How much new for-sale + rental construction is in the pipeline within 1–3 miles? Heavy new supply typically softens prices + rents 12–24 months out; constrained supply supports both.
Investment metrics
- 1% rule
- 0.79% ✗
- Cap rate
- 6.54%
- Cash-on-cash
- 0.87%
- DSCR
- 1.04
- GRM
- 10.6
CMA / ARV
- ARV (median comp)
- $551,266
- List price
- $275,000
- Delta
- -50.11%
- Verdict
- UNDERPRICED
- Comps
- 20 within 1.0 mi
Projected returns pro-forma
-3.0% appreciation · 3.0% rent growth · sell at horizon
- IRR
- -15.0%
- Equity multiple
- 0.47×
- Total profit
- $-41,135
- Equity at exit
- $41,003
- IRR
- -6.4%
- Equity multiple
- 0.59×
- Total profit
- $-31,726
- Equity at exit
- $23,777
Cash invested: $77,000 (down + closing). Projections, not guarantees.
Landlord ↔ Tenant lean methodology
- Overall (STATE)
- 85 Strongly Landlord-Friendly
- State North Carolina
- 85 Strongly Landlord-Friendly · R+3
- County
- — inherits STATE
- City
- — inherits STATE
ZIP-level market 28711
- Active inventory
- 302
- Price-to-rent
- 10.6×
Monthly cashflow live
- Estimated rent
- $2,171 high interval (Pro) →
- Mortgage (P&I)
- −$1,442
- Tax from tax record
- −$103 /mo · $1,234/yr
- Insurance
- −$115
- HOA
- −$0
- Vacancy / Maint / Mgmt
- −$456
- Net cashflow
- $56
Break-even live
UW: 25.0% down · 7.5% · 30yr · 1.5% tax · 5.0% vac · 8.0% maint · 8.0% mgmt
Financing live
Cash to close
- Down payment
- $68,750
- Closing costs
- $8,250
- Reserves months
- —
- Total cash needed
- —
Loan-product check · same deal, 3 products live
Conventional
25% down · 7.5% · 30yr
- Down + closing
- —
- Monthly P&I
- —
- Monthly cashflow
- —
- DSCR
- —
- Eligible?
- —
Personal DTI + credit; lowest rate.
DSCR
20% down · 8.5% · 30yr
- Down + closing
- —
- Monthly P&I
- —
- Monthly cashflow
- —
- DSCR
- —
- Eligible?
- —
No personal income docs; deal must DSCR.
Hard money
10% down · 12.0% · 12mo
- Down + closing
- —
- Monthly P&I
- —
- Monthly cashflow
- —
- DSCR
- —
- Eligible?
- —
Short-term bridge; refi at stabilization.
Rent comps 8 comps
| Address | Beds | Baths | Sqft | Rent | $/sqft | DOM | Units | Dist |
|---|---|---|---|---|---|---|---|---|
| 104 Hiawassee Ave Black Mountain, NC | 2.0 | 2.0 | 1145 | $1,995 | $1.74 | 14d | 1 | 0.30mi |
| 15 Asa Ct Black Mountain, NC | 3.0 | 2.0 | 1512 | $1,950 | $1.29 | 43d | 1 | 0.31mi |
| 34 Fortune St Black Mountain, NC | 3.0 | 2.0 | 1400 | $1,950 | $1.39 | 14d | 1 | 0.35mi |
| 9th St Black Mountain, NC | 2.0 | 2.0 | 1228 | $2,200 | $1.79 | 21d | 1 | 0.95mi |
| 114 Richard Ln Black Mountain, NC | 3.0 | 2.0 | 1515 | $2,495 | $1.65 | 43d | 1 | 1.12mi |
| 106 Louisa St Black Mountain, NC | 2.0 | 1.0 | 1100 | $1,800 | $1.64 | 23d | 1 | 1.14mi |
| 829 Montreat Rd Black Mountain, NC | 2.0 | 2.0 | 1130 | $2,275 | $2.01 | 23d | 1 | 1.25mi |
| 88 Atkins Dr Black Mountain, NC | 3.0 | 2.0 | 1410 | $2,200 | $1.56 | 14d | 1 | 1.33mi |
Listing history 15 events
-
2026-06-18days on market $275,000 Active 50 DOM
-
2026-06-17days on market $275,000 Active 49 DOM
-
2026-06-16days on market $275,000 Active 48 DOM
-
2026-06-15days on market $275,000 Active 47 DOM
-
2026-06-14days on market $275,000 Active 45 DOM
-
2026-06-10days on market $275,000 Active 42 DOM
-
2026-06-09days on market $275,000 Active 41 DOM
-
2026-06-08days on market $275,000 Active 40 DOM
-
2026-06-07days on market $275,000 Active 39 DOM
-
2026-06-03days on market $275,000 Active 35 DOM
-
2026-06-02days on market $275,000 Active 34 DOM
-
2026-06-01days on market $275,000 Active 33 DOM
-
2026-05-31days on market $275,000 Active 32 DOM
-
2026-05-30days on market $275,000 Active 31 DOM
-
2026-04-29$275,000 Active 1117-char remark
ⓘ Source: listings_history table (triggers on properties + properties_extension) + one-shot
backfill from property_details.listing_events for pre-trigger history.
Tax reassessment forecast NC · Resets to sale price
- Current annual tax
- $1,234 · $103/mo
- Projected year-2 tax
- $2,255 · $188/mo
- Expected delta
- +$1,021/yr (+$85/mo · 82.8%)
ⓘ Screening estimate from a state-policy table — verify with the county assessor before closing.
Climate risk First Street
- Flood 1/10 Low FEMA zone X (unshaded) · 0% chance over 30 yrs
- Wildfire 3/10 Moderate
- Heat 3/10 Moderate 8 d/yr ≥94°F today · 22 d/yr by 30 yrs out
- Wind 2/10 Low
- Air quality 4/10 Moderate 4 unhealthy d/yr today · 5 by 30 yrs out
Nearby sold comps map
Loading sold comps map…
Walkable amenities ~0.75 mi
Loading nearby amenities…
Taxation est. · year 1
- Rental income
- $26,053
- − Mortgage interest
- −$15,404
- − Property taxes
- −$1,234
- − Insurance
- −$1,375
- − Repairs & maintenance
- −$2,084
- − Management
- −$2,084
- − Depreciation
- −$8,000
- Taxable loss
- −$4,129
- Est. tax savings @ 24.0%
- +$991
- After-tax cash flow
- $1,658/yr
For passive investors: Depreciation is non-cash, so a rental often shows a tax loss while cash-flowing — sheltering income. Rental losses are passive: they offset passive income freely, and up to $25,000/yr can offset ordinary (W-2) income if you actively participate and your MAGI is under $100k (phasing out to $0 by $150k); unused losses carry forward. On sale, claimed depreciation is recaptured at up to 25%, and gains may owe capital-gains tax (a 1031 exchange can defer both). Figures are a year-1 estimate at your 24.0% rate — not tax advice; consult a CPA.
Schools (NCES district)
- District
- Buncombe County Schools
- NCES district ID
- 3700450
- Math proficiency
- 45% ▬ 0.00%
- Reading proficiency
- 50% ▲ 2.00%
- Median HH income
- $45,981
- Composite
- 40.32/100
- National rank
- #3749
- State rank
- #72 of 178 in NC
Livability — Black Mountain
- Score
- 87/100
- State rank
- #2
- US rank
- #297
Category grades
Schools grade is shown separately in the Schools card above.
Census & demographics
- Census place
- Black Mountain, NC
- County
- Buncombe County · 241,085 people
- City population
- 12,663
- Metro
- Asheville, NC
- Population (ZIP)
- 12,663
- Household income
- $74,761
- Rent vs Own
- Severe rent burden
- 556.0
Population outlook (Buncombe County) Hauer SSP2
- Today (2025)
- 286,475 people
- By 2030
- 302,237 · +5.5%
- By 2040
- 330,687 · +15.4%
- By 2050
- 356,370 · +24.4%
- By 2075
- 409,383 · +42.9%
- By 2100
- 437,270 · +52.6%
Race, ethnicity, and origin ACS 2023
- Neighborhood character
- Predominantly White (90%)
- Race & ethnicity
- White 90% Two or more races 4% Black 3% Hispanic / Latino 2%
- Common ancestry
- Slovak 5% Serbian 4% Italian 3%
- Foreign-born
- 2% · Canada
- Languages at home
- 97% English-only · Spanish 1% German/W. Germanic 1% Other Indo-European 1%
Political lean MEDSL · Buncombe
- 2024 margin
- Strong D (+24.8) · D 61.7% · R 36.9% · Other 1.4%
- 2008→2024 swing
- +10.9pp toward D · 2008: 13.9pp · 2024: 24.8pp
- All cycles
- 2024: D+24.8 2020: D+21.1 2016: D+14.6 2012: D+12.4 2008: D+13.9
Not yet ingested
- Civics
- —
Market trends
- HPI YoY
- ▼ -227.20%
- Current HPI
- 314.8029
- Rent YoY
- —
- Metro
- Asheville, NC
- State GDP YoY
- ▲ 3.28%
- F500 in state
- 26
Industry mix (Fortune 500 HQ in NC)
| Industry | F500 HQs | Revenue |
|---|---|---|
| Financial Services | 2 | $213B |
|
||
| Retail | 2 | $95B |
|
||
| Industrial Conglomerate | 1 | $38B |
|
||
| Metals / Steel | 1 | $35B |
|
||
| Utilities | 1 | $30B |
|
||
| Industrial Machinery | 1 | $19B |
|
||
Price history
1 event — show timeline
- 2026-04-29 Listed $275,000 CANOPYMLS as Distributed by MLS Grid
Property tax history
+1.8%/yrLatest (2025): $1,234 · +3.5% YoY. Source: county tax records.
Cash-flow waterfall
monthlySold comps — $/sqft
last 12 mo · ≤1 miLoading sold comps…