203 N Natchez St · Woodville, MS
Flood risk No data
- FEMA flood zone
- —
- Chance of flooding over 30 yrs
- —
- Est. flood insurance / yr
- —
Fire risk No data
- Est. fire insurance / yr
- —
Heat risk No data
- Hot days now (above threshold)
- —
- Hot days in 30 yrs
- —
Wind risk No data
- Chance of severe wind over 30 yrs
- —
Air-quality risk No data
- Unhealthy air days now
- —
- Unhealthy air days in 30 yrs
- —
Risk factors via First Street. Map © Google.
Why this score? — see what drove the B+ grade
The composite is a weighted blend of 9 inputs, each scored 0–100. Each bar is that input's sub-score; the figure is the points it added to the 100-point composite (weight × sub-score).
- Cash flow +28.8/30.0
- ARV discount +15.0/15.0
- DSCR +10.0/10.0
- 1% rule +8.0/10.0
- Appreciation +7.7/10.0
- Livability +3.2/5.0
- Rent growth +2.5/5.0
- Condition / age +2.2/5.0
- Schools +0.6/10.0
$109,000
🖨 Deal sheet 📄 Offer letter ✓ Due diligence
Listing remarks MLS
This is a duplex in Woodville MS. OWNER FINANCING IS AVAILABLE. 2- 2 bedrooms and 1.5 bathrooms. Great rental opportunity, or live in one side and rent the other, whatever works for you! Off street parking, a nice back yard, and an extra lot next door for more options. Call today!
Key facts
- Extra lot
- Off street parking
- Nice back yard
Tags
Neighborhood map
What this means for you Summary
Snapshot
- This is a 4-bed/1.5-bath single-family listed at $109k. Condition is rated fair.
Deal economics
- At list price, monthly cash flow is $366 ($4k/yr) — positive.
- The deal already cash-flows at list — no discount required.
- Meets the 1% rule at list price ($1k rent vs $109k).
- Recommended offer: $96k (12.0% below list) — sets the bar for market timing.
Location & tenants
- Location reads 65/100 on livability (#104 in MS) — a middle-class / working-renter tenant base. Strengths: crime A+, cost of living A+, housing A+; Watch: employment D, schools F, amenities F.
- Wilkinson County School District (rural): math 4% / reading 11% proficiency, ranked #124 of 130 in MS (top 95%) — low school quality limits family demand, transient renter base, plan for 1-2y turnover; 95% free/reduced lunch — lower-income household profile, screen leases tightly.
- Market conditions: 35 active listings in the ZIP.
Forward outlook
- In year one you build about $7k of equity ($754 loan paydown + $6k appreciation (5.3% local appreciation)).
- Wilkinson County population projected at -37% by 2050 — secular population decline; favor cash flow + early exit over multi-decade hold.
- At projected returns (5.3% appreciation + 3.0% rent growth), your $31k cash investment doubles in ~3 years — after that, you're playing with house money.
- By year 6, paydown + projected appreciation supports a ~$35k cash-out refi (75% LTV) — recoverable capital for the next deal without selling this one.
Negotiation context
- It's been on market 275 days — a 12% lower offer ($96k) is reasonable based on typical stale-listing flexibility.
- 2 sale attempts since 2y ago; this cycle's ask has dropped $16k (13%) from the opening price — seller is motivated, your offer sets the floor, not the list.
Questions for the listing agent
- It's been on market 275 days. Have you received any prior offers? Is the seller open to a 12% concession, seller financing, or rate buy-down credit?
- Have any recent inspections been done? Can we get a copy of the seller's disclosures and any deferred-maintenance estimates?
- Why hasn't it sold? Are there any deal-killer items the seller is aware of (foundation, flood, title, zoning, code violations)?
- Is there a deadline driving the sale (1031 exchange, divorce, estate, relocation)? That informs how much negotiation room exists.
- Schools are F-rated, which usually means shorter tenancies and higher turnover. Who's the typical renter profile here, and what's been the actual vacancy rate?
- What's the average days-on-market for RENTAL listings here right now (not sales)? A rising rental-DOM trend means longer vacancies and softer asking-rent achievability than the comps imply.
- What's the recent tenant-quality profile in this submarket — average credit score on applications, eviction rate, late-payment / NSF rate, and stable-employment percentage? A property-management company in the area should have these aggregated.
- How much new for-sale + rental construction is in the pipeline within 1–3 miles? Heavy new supply typically softens prices + rents 12–24 months out; constrained supply supports both.
Investment metrics
- 1% rule
- 1.30% ✓
- Cap rate
- 10.33%
- Cash-on-cash
- 14.40%
- DSCR
- 1.64
- GRM
- 6.4
CMA / ARV
- ARV (median comp)
- $201,350
- List price
- $109,000
- Delta
- -45.87%
- Verdict
- UNDERPRICED
- Comps
- 7 within 1.0 mi
Show comp detail 2 sales within ~0.75 mi
| Address | Dist | Beds/Ba | Sqft | Sold | Price | $/sf | Match |
|---|---|---|---|---|---|---|---|
| 814 Sligo St | 0.60mi | 3/1.0 (-1) | 2,222 (+3%) | 15mo | $219,000 | $99 | 48 |
| 550 Church St | 0.46mi | 4/3.0 | 1,950 (-10%) | 19mo | $233,000 | $119 | 40 |
Match score weights: distance 35% · size 25% · config 20% · recency 20%. Top-matched comps best support the ARV.
Projected returns pro-forma
5.31% appreciation · 3.0% rent growth · sell at horizon
- IRR
- 26.0%
- Equity multiple
- 2.65×
- Total profit
- $50,424
- Equity at exit
- $63,842
- IRR
- 24.8%
- Equity multiple
- 5.31×
- Total profit
- $131,445
- Equity at exit
- $111,936
Cash invested: $30,520 (down + closing). Projections, not guarantees.
Landlord ↔ Tenant lean methodology
- Overall (STATE)
- 90 Strongly Landlord-Friendly
- State Mississippi
- 90 Strongly Landlord-Friendly · R+11
- County
- — inherits STATE
- City
- — inherits STATE
ZIP-level market 39669
- Home prices YoY
- 6.4%
- Active inventory
- 35
- Price-to-rent
- 6.4×
Monthly cashflow live
- Estimated rent
- $1,417 medium interval (Pro) →
- Mortgage (P&I)
- −$572
- Tax est. 1.5%
- −$136 /mo · $1,635/yr
- Insurance
- −$45
- HOA
- −$0
- Vacancy / Maint / Mgmt
- −$298
- Net cashflow
- $366
Break-even live
UW: 25.0% down · 7.5% · 30yr · 1.5% tax · 5.0% vac · 8.0% maint · 8.0% mgmt
Financing live
Cash to close
- Down payment
- $27,250
- Closing costs
- $3,270
- Reserves months
- —
- Total cash needed
- —
Loan-product check · same deal, 3 products live
Conventional
25% down · 7.5% · 30yr
- Down + closing
- —
- Monthly P&I
- —
- Monthly cashflow
- —
- DSCR
- —
- Eligible?
- —
Personal DTI + credit; lowest rate.
DSCR
20% down · 8.5% · 30yr
- Down + closing
- —
- Monthly P&I
- —
- Monthly cashflow
- —
- DSCR
- —
- Eligible?
- —
No personal income docs; deal must DSCR.
Hard money
10% down · 12.0% · 12mo
- Down + closing
- —
- Monthly P&I
- —
- Monthly cashflow
- —
- DSCR
- —
- Eligible?
- —
Short-term bridge; refi at stabilization.
Listing history 6 events
-
2026-05-07status Pending 286-char remark
Show marketing remark (286 chars)
This is a duplex in Woodville MS. OWNER FINANCING IS AVAILABLE. 2- 2 bedrooms and 1.5 bathrooms. Great rental opportunity, or live in one side and rent the other, whatever works for you! Off street parking, a nice back yard, and an extra lot next door for more options. Call today!
-
2025-10-17price $109,000 286-char remark
Show marketing remark (286 chars)
This is a duplex in Woodville MS. OWNER FINANCING IS AVAILABLE. 2- 2 bedrooms and 1.5 bathrooms. Great rental opportunity, or live in one side and rent the other, whatever works for you! Off street parking, a nice back yard, and an extra lot next door for more options. Call today!
-
2025-08-18price $120,000 286-char remark
Show marketing remark (286 chars)
This is a duplex in Woodville MS. OWNER FINANCING IS AVAILABLE. 2- 2 bedrooms and 1.5 bathrooms. Great rental opportunity, or live in one side and rent the other, whatever works for you! Off street parking, a nice back yard, and an extra lot next door for more options. Call today!
-
2025-06-18$125,000 Active 286-char remark
Show marketing remark (286 chars)
This is a duplex in Woodville MS. OWNER FINANCING IS AVAILABLE. 2- 2 bedrooms and 1.5 bathrooms. Great rental opportunity, or live in one side and rent the other, whatever works for you! Off street parking, a nice back yard, and an extra lot next door for more options. Call today!
-
2024-12-28historical
-
2024-06-28$125,000
ⓘ Source: listings_history table (triggers on properties + properties_extension) + one-shot
backfill from property_details.listing_events for pre-trigger history.
Nearby sold comps map
Loading sold comps map…
Walkable amenities ~0.75 mi
Loading nearby amenities…
Taxation est. · year 1
- Rental income
- $17,007
- − Mortgage interest
- −$6,106
- − Property taxes
- −$1,635
- − Insurance
- −$545
- − Repairs & maintenance
- −$1,361
- − Management
- −$1,361
- − Depreciation
- −$3,171
- Taxable income
- $2,829
- Est. tax owed @ 24.0%
- −$679
- After-tax cash flow
- $3,717/yr
For passive investors: Depreciation is non-cash, so a rental often shows a tax loss while cash-flowing — sheltering income. Rental losses are passive: they offset passive income freely, and up to $25,000/yr can offset ordinary (W-2) income if you actively participate and your MAGI is under $100k (phasing out to $0 by $150k); unused losses carry forward. On sale, claimed depreciation is recaptured at up to 25%, and gains may owe capital-gains tax (a 1031 exchange can defer both). Figures are a year-1 estimate at your 24.0% rate — not tax advice; consult a CPA.
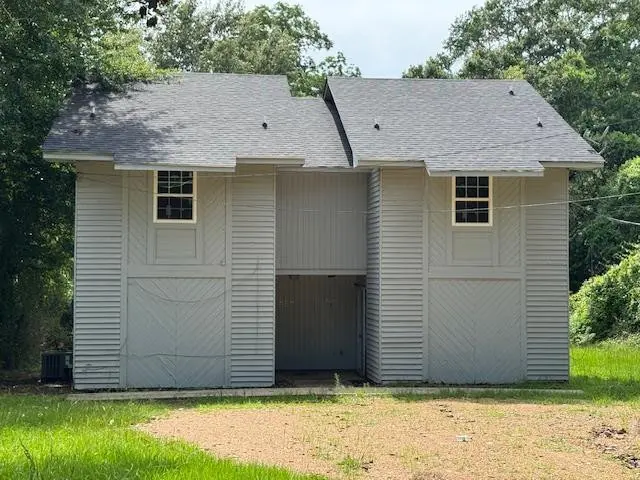
Condition & rehab AI · 12 photos
This property requires extensive repairs and updates to improve its condition and value. The roof and siding are in poor condition, and the interior needs fresh paint and new flooring. The kitchen and bathrooms also need modernization.
Repairs flagged
- Major roof — Missing shingles
- Major exterior siding — Weathered and peeling
- Major interior walls — Worn wood paneling
- Major flooring — Worn carpet
- Major kitchen appliances — Old and outdated
- Major bathroom fixtures — Small and outdated
Value-add opportunities
- Both New roof — Improves both resale and rental value
- Both New siding — Enhances curb appeal and value
- Both New flooring — Freshens up the interior and improves value
- Both New kitchen appliances — Modernizes the kitchen and boosts value
- Both New bathroom fixtures — Improves functionality and value
Renovation cost estimate screening
| Repair item | Severity | Est. cost |
|---|---|---|
| roof · Missing shingles | Major | $15,000–50,000 |
| exterior siding · Weathered and peeling | Major | $15,000–50,000 |
| interior walls · Worn wood paneling | Major | $15,000–50,000 |
| flooring · Worn carpet | Major | $15,000–50,000 |
| kitchen appliances · Old and outdated | Major | $15,000–50,000 |
| bathroom fixtures · Small and outdated | Major | $15,000–50,000 |
| Total estimated repair cost · 6 items | $90,000–300,000 |
Value-add ROI direction
- Both New roof — Improves both resale and rental value ↑
- Both New siding — Enhances curb appeal and value ↑
- Both New flooring — Freshens up the interior and improves value ↑
- Both New kitchen appliances — Modernizes the kitchen and boosts value ↑
- Both New bathroom fixtures — Improves functionality and value ↑
ⓘ Cost ranges are severity-bucket heuristics (US national rule-of-thumb). Get contractor quotes + a written scope before underwriting a rehab budget.
Schools (NCES district)
- District
- Wilkinson County School District
- NCES district ID
- 2804710
- Math proficiency
- 4% ▼ -12.00%
- Reading proficiency
- 11% ▼ -5.00%
- Median HH income
- $29,558
- Composite
- 5.57/100
- National rank
- #10025
- State rank
- #124 of 130 in MS
Livability — Woodville
- Score
- 65/100
- State rank
- #104
- US rank
- #12514
Category grades
Schools grade is shown separately in the Schools card above.
Census & demographics
- Census place
- Woodville, MS
- Population (ZIP)
- 4,260
Population outlook (Wilkinson County) Hauer SSP2
- Today (2025)
- 7,916 people
- By 2030
- 7,289 · -7.9%
- By 2040
- 6,036 · -23.7%
- By 2050
- 4,978 · -37.1%
- By 2075
- 3,361 · -57.5%
- By 2100
- 2,387 · -69.8%
Race, ethnicity, and origin ACS 2023
- Neighborhood character
- Predominantly Black (69%)
- Race & ethnicity
- Black 69% White 28% Two or more races 3%
- Common ancestry
- Lithuanian 3% Serbian 1%
Political lean MEDSL · Wilkinson
- 2024 margin
- Strong D (+25.3) · D 62.0% · R 36.7% · Other 1.3%
- 2008→2024 swing
- -13.1pp toward R · 2008: 38.4pp · 2024: 25.3pp
- All cycles
- 2024: D+25.3 2020: D+34.5 2016: D+36.4 2012: D+39.3 2008: D+38.4
Not yet ingested
- Civics
- —
Market trends
- HPI YoY
- ▲ 5.31%
- Current HPI
- 88.8448
- Rent YoY
- —
- Metro
- —
- State GDP YoY
- —
- F500 in state
- 0
Price history
-12.8% since first listed6 events — show timeline
- 2026-05-07 Pending — MLSU
- 2025-10-17 Price Changed $109,000 MLSU
- 2025-08-18 Price Changed $120,000 MLSU
- 2025-06-18 Listed $125,000 MLSU
- 2024-12-28 Listing Removed — MLSU
- 2024-06-28 Listed $125,000 MLSU
Cash-flow waterfall
monthlySold comps — $/sqft
last 12 mo · ≤1 miLoading sold comps…