8587 County Road 15 · Rayland, OH
Flood risk 9/10 · Severe
- FEMA flood zone
- X (unshaded)
- Chance of flooding over 30 yrs
- 0.99%
- Est. flood insurance / yr
- $473 – $860
Fire risk 3/10 · Minor
- Est. fire insurance / yr
- $713 – $1,323
Heat risk 3/10 · Minor
- Hot days now (above 96°F)
- 7 days/yr
- Hot days in 30 yrs
- 19 days/yr
Wind risk 1/10 · Minimal
- Chance of severe wind over 30 yrs
- —
Air-quality risk 2/10 · Minimal
- Unhealthy air days now
- 0 days/yr
- Unhealthy air days in 30 yrs
- 1 days/yr
Risk factors via First Street. Map © Google.
Why this score? — see what drove the D grade
The composite is a weighted blend of 9 inputs, each scored 0–100. Each bar is that input's sub-score; the figure is the points it added to the 100-point composite (weight × sub-score).
- Cash flow +12.2/30.0
- ARV discount +7.5/15.0
- Appreciation +5.8/10.0
- Schools +4.1/10.0
- DSCR +3.6/10.0
- Livability +3.3/5.0
- 1% rule +2.8/10.0
- Rent growth +2.5/5.0
- Condition / age +2.5/5.0
$125,000
🖨 Deal sheet 📄 Offer letter ✓ Due diligence
Listing remarks
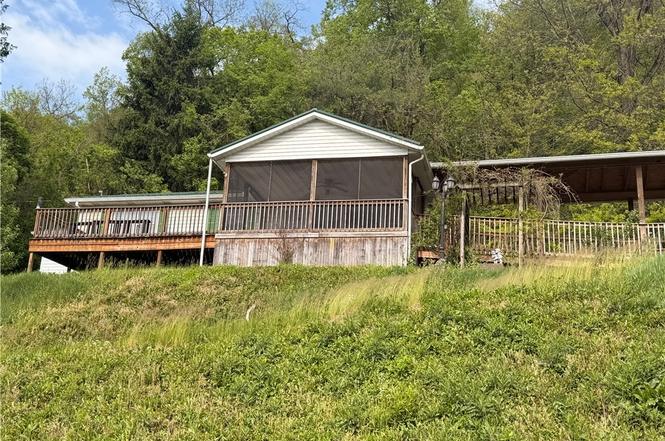
Looking for a ranch style home? Here you go, three bedrooms, eat in kitchen, living with big window to enjoy the view, two full bathrooms, the bathroom off the primary bedroom is handicap accessible. The full-size basement offers the laundry area and room that if you use it for what like. The property is handicap accessible with a screen in porch on the front and a deck off the primary bathroom, a patio area to enjoy your day and also a two-car garage.
Key facts
- Screen in porch
- Patio area
- 1.58 acre lot
Tags
Property features AI
Finance
- Financial info: Annual tax amount available (financial details excluded per instructions)
Exterior
- Parking: 2-car garage; Asphalt driveway
- Utilities: Public water; Septic tank
- Home design: Single-story home; Vinyl siding; Aluminum roof; Block foundation
- Construction: Built year from public records; Vinyl siding construction; Aluminum roof; Block foundation
- Exterior features: 1.58-acre lot
Interior
- Kitchen: No specific kitchen appliance details provided
- Bedrooms: 3 main-level bedrooms
- Bathrooms: 2 full bathrooms (both on the main level)
- Heating & cooling: Central air conditioning; Heating by baseboard and forced air
- Interior features: Finished basement; Total of 5 rooms
- Laundry & utility: No specific laundry appliance details provided
Neighborhood map
What this means for you Summary
Snapshot
- This is a 3-bed/2.0-bath single-family listed at $125k.
Deal economics
- At list price, monthly cash flow is $-81 ($-976/yr) — negative.
- To cash-flow at today's rent, offer at most $111k (11.5% below list).
- To meet the 1% rule (rent ≥ 1% of price), the offer needs to be $97k (22.4% below list).
- Recommended offer: $97k (22.4% below list) — sets the bar for 1% rule.
Location & tenants
- Location reads 66/100 on livability (#635 in OH) — a middle-class / working-renter tenant base. Strengths: cost of living A+, housing A+; Watch: employment C-, crime D+, amenities F.
- Buckeye Local (rural): math 44% / reading 53% proficiency, ranked #471 of 656 in OH (top 72%) — families likely to look elsewhere, expect single-tenant / working-renter base with shorter leases.
- Market conditions: 9 active listings in the ZIP; 2 units permitted in Jefferson County in 2024 (0 in 5+ unit buildings).
Forward outlook
- In year one you build about $3k of equity ($864 loan paydown + $2k appreciation (1.6% local appreciation)).
- Jefferson County population projected at -19% by 2050 — secular population decline; favor cash flow + early exit over multi-decade hold.
Negotiation context
- It's been on market 123 days — a 12% lower offer ($110k) is reasonable based on typical stale-listing flexibility.
- 4 sale attempts with the ask held roughly flat each time — persistent listings suggest the price (not the market) is what's stuck; bring a comps-based counter.
- Current owner paid $75k; list at $125k implies a 67% gain — meaningful room to come down on a strong offer.
Risks & watch-outs
- Watch-outs: flood insurance adds $56/mo; built in 1956 — expect roof / HVAC / electrical / plumbing capex.
- Climate carrying-cost: severe flood risk — expect insurance premiums to compound above CPI over the hold.
Questions for the listing agent
- What do current leases actually rent for vs. the listed asking? Can we see a recent rent roll and the last 12 months of T-12 income?
- It's been on market 123 days. Have you received any prior offers? Is the seller open to a 22% concession, seller financing, or rate buy-down credit?
- Built in 1956 — when were the roof, HVAC, electrical panel, plumbing, and water heater last replaced?
- What's the actual annual flood-insurance premium (NFIP or private), and is the property in a SFHA with mandatory coverage?
- Why hasn't it sold? Are there any deal-killer items the seller is aware of (foundation, flood, title, zoning, code violations)?
- Is there a deadline driving the sale (1031 exchange, divorce, estate, relocation)? That informs how much negotiation room exists.
- Crime grade is D in this area — have there been break-ins, vandalism, or insurance claims at this property in the last 3 years? What carrier currently insures it and at what premium?
- The area grade is low — what's the realistic commute time and amenity access for the typical tenant pool here? Any planned neighborhood developments (good or bad) we should know about?
- What's the average days-on-market for RENTAL listings here right now (not sales)? A rising rental-DOM trend means longer vacancies and softer asking-rent achievability than the comps imply.
- What's the recent tenant-quality profile in this submarket — average credit score on applications, eviction rate, late-payment / NSF rate, and stable-employment percentage? A property-management company in the area should have these aggregated.
- How much new for-sale + rental construction is in the pipeline within 1–3 miles? Heavy new supply typically softens prices + rents 12–24 months out; constrained supply supports both.
Investment metrics
- 1% rule
- 0.78% ✗
- Cap rate
- 6.05%
- Cash-on-cash
- -0.88%
- DSCR
- 0.96
- GRM
- 10.7
CMA / ARV
No comps found within radius.
Projected returns pro-forma
1.58% appreciation · 3.0% rent growth · sell at horizon
- IRR
- 0.4%
- Equity multiple
- 1.02×
- Total profit
- $777
- Equity at exit
- $46,519
- IRR
- 4.8%
- Equity multiple
- 1.63×
- Total profit
- $22,060
- Equity at exit
- $64,911
Cash invested: $35,000 (down + closing). Projections, not guarantees.
Landlord ↔ Tenant lean methodology
- Overall (STATE)
- 73 Landlord-Friendly
- State Ohio
- 73 Landlord-Friendly · R+6
- County
- — inherits STATE
- City
- — inherits STATE
ZIP-level market 43943
- Home prices YoY
- 1.1%
- Active inventory
- 9
- Price-to-rent
- 10.7×
Monthly cashflow live
- Estimated rent
- $970 medium interval (Pro) →
- Mortgage (P&I)
- −$656
- Tax from tax record
- −$84 /mo · $1,014/yr
- Insurance
- −$52
- Flood insurance flood zone
- −$56 /mo · $666/yr
- HOA
- −$0
- Vacancy / Maint / Mgmt
- −$204
- Net cashflow
- $-81
Break-even live
UW: 25.0% down · 7.5% · 30yr · 1.5% tax · 5.0% vac · 8.0% maint · 8.0% mgmt
Financing live
Cash to close
- Down payment
- $31,250
- Closing costs
- $3,750
- Reserves months
- —
- Total cash needed
- —
Loan-product check · same deal, 3 products live
Conventional
25% down · 7.5% · 30yr
- Down + closing
- —
- Monthly P&I
- —
- Monthly cashflow
- —
- DSCR
- —
- Eligible?
- —
Personal DTI + credit; lowest rate.
DSCR
20% down · 8.5% · 30yr
- Down + closing
- —
- Monthly P&I
- —
- Monthly cashflow
- —
- DSCR
- —
- Eligible?
- —
No personal income docs; deal must DSCR.
Hard money
10% down · 12.0% · 12mo
- Down + closing
- —
- Monthly P&I
- —
- Monthly cashflow
- —
- DSCR
- —
- Eligible?
- —
Short-term bridge; refi at stabilization.
Listing history 16 events
-
2026-06-18days on market $125,000 Active 123 DOM
-
2026-06-17price $125,000 Active 122 DOM
-
2026-06-17days on market $130,000 Active 122 DOM
-
2026-06-16days on market $130,000 Active 121 DOM
-
2026-06-15days on market $130,000 Active 120 DOM
-
2026-06-13days on market $130,000 Active 118 DOM
-
2026-06-12days on market $130,000 Active 117 DOM
-
2026-06-09days on market $130,000 Active 114 DOM
-
2026-06-08days on market $130,000 Active 113 DOM
-
2026-06-07days on market $130,000 Active 112 DOM
-
2026-06-07days on market $130,000 Active 111 DOM
-
2026-06-04days on market $130,000 Active 108 DOM
-
2026-06-02days on market $130,000 Active 107 DOM
-
2026-06-01days on market $130,000 Active 106 DOM
-
2026-05-31remarks 456-char remark
-
2026-05-31$130,000 Active 105 DOM
ⓘ Source: listings_history table (triggers on properties + properties_extension) + one-shot
backfill from property_details.listing_events for pre-trigger history.
Tax reassessment forecast OH · Partial reset (capped growth)
- Current annual tax
- $1,014 · $84/mo
- Projected year-2 tax
- $1,482 · $123/mo
- Expected delta
- +$468/yr (+$39/mo · 46.2%)
ⓘ Screening estimate from a state-policy table — verify with the county assessor before closing.
Climate risk First Street
- Flood 9/10 Extreme FEMA zone X (unshaded) · 99% chance over 30 yrs
- Wildfire 3/10 Moderate
- Heat 3/10 Moderate 7 d/yr ≥96°F today · 19 d/yr by 30 yrs out
- Wind 1/10 Low
- Air quality 2/10 Low 0 unhealthy d/yr today · 1 by 30 yrs out
Nearby sold comps map
Loading sold comps map…
Walkable amenities ~0.75 mi
Loading nearby amenities…
Taxation est. · year 1
- Rental income
- $11,640
- − Mortgage interest
- −$7,002
- − Property taxes
- −$1,014
- − Insurance
- −$1,292
- − Repairs & maintenance
- −$931
- − Management
- −$931
- − Depreciation
- −$3,636
- Taxable loss
- −$3,166
- Est. tax savings @ 24.0%
- +$760
- After-tax cash flow
- $-216/yr
For passive investors: Depreciation is non-cash, so a rental often shows a tax loss while cash-flowing — sheltering income. Rental losses are passive: they offset passive income freely, and up to $25,000/yr can offset ordinary (W-2) income if you actively participate and your MAGI is under $100k (phasing out to $0 by $150k); unused losses carry forward. On sale, claimed depreciation is recaptured at up to 25%, and gains may owe capital-gains tax (a 1031 exchange can defer both). Figures are a year-1 estimate at your 24.0% rate — not tax advice; consult a CPA.
Schools (NCES district)
- District
- Buckeye Local
- NCES district ID
- 3904778
- Math proficiency
- 44% ▼ -18.00%
- Reading proficiency
- 53% ▼ -10.00%
- Median HH income
- $41,332
- Composite
- 40.68/100
- National rank
- #3673
- State rank
- #471 of 656 in OH
Livability — Rayland
- Score
- 66/100
- State rank
- #635
- US rank
- #11212
Category grades
Schools grade is shown separately in the Schools card above.
Census & demographics
- County
- Jefferson · 64,369 people
- Metro
- Weirton-Steubenville, WV-OH
- Population (ZIP)
- 3,288
- Household income
- $49,569
- Rent vs Own
- Severe rent burden
- 5.9
Population outlook (Jefferson County) Hauer SSP2
- Today (2025)
- 63,481 people
- By 2030
- 61,067 · -3.8%
- By 2040
- 55,860 · -12.0%
- By 2050
- 51,236 · -19.3%
- By 2075
- 41,804 · -34.1%
- By 2100
- 32,344 · -49.0%
Race, ethnicity, and origin ACS 2023
- Neighborhood character
- Predominantly White (97%)
- Race & ethnicity
- White 97% Two or more races 1%
- Common ancestry
- Romanian 15% Polish 2% Serbian 1%
- Foreign-born
- 0%
- Languages at home
- 98% English-only · Other Indo-European 1%
Political lean MEDSL · Jefferson
- 2024 margin
- Solid R (+43.9) · D 27.5% · R 71.4% · Other 1.1%
- 2008→2024 swing
- -44.1pp toward R · 2008: 0.2pp · 2024: -43.9pp
- All cycles
- 2024: R+43.9 2020: R+38.4 2016: R+35.7 2012: R+5.5 2008: D+0.2
Not yet ingested
- Civics
- —
Market trends
- HPI YoY
- ▲ 1.58%
- Current HPI
- 138.7959
- Rent YoY
- —
- Metro
- —
- State GDP YoY
- ▲ 1.98%
- F500 in state
- 48
Industry mix (Fortune 500 HQ in OH)
| Industry | F500 HQs | Revenue |
|---|---|---|
| Insurance | 3 | $145B |
|
||
| Industrial Machinery | 3 | $49B |
|
||
| Financial Services | 3 | $24B |
|
||
| Consumer Goods | 2 | $93B |
|
||
| Aerospace / Defense | 2 | $47B |
|
||
| Utilities | 2 | $33B |
|
||
Price history
+73.3% since first listed8 events — show timeline
- 2026-05-03 Relisted — MLSNOW
- 2026-04-21 Contingent — MLSNOW
- 2026-04-09 Relisted — MLSNOW
- 2026-03-29 Contingent — MLSNOW
- 2026-02-26 Relisted — MLSNOW
- 2026-02-17 Contingent — MLSNOW
- 2026-02-13 Listed $130,000 MLSNOW
- 2019-04-08 Sold (Public Records) $75,000 Public Records
Property tax history
+11.4%/yrLatest (2025): $1,014 · +0.2% YoY. Source: county tax records.
Cash-flow waterfall
monthlySold comps — $/sqft
last 12 mo · ≤1 miLoading sold comps…