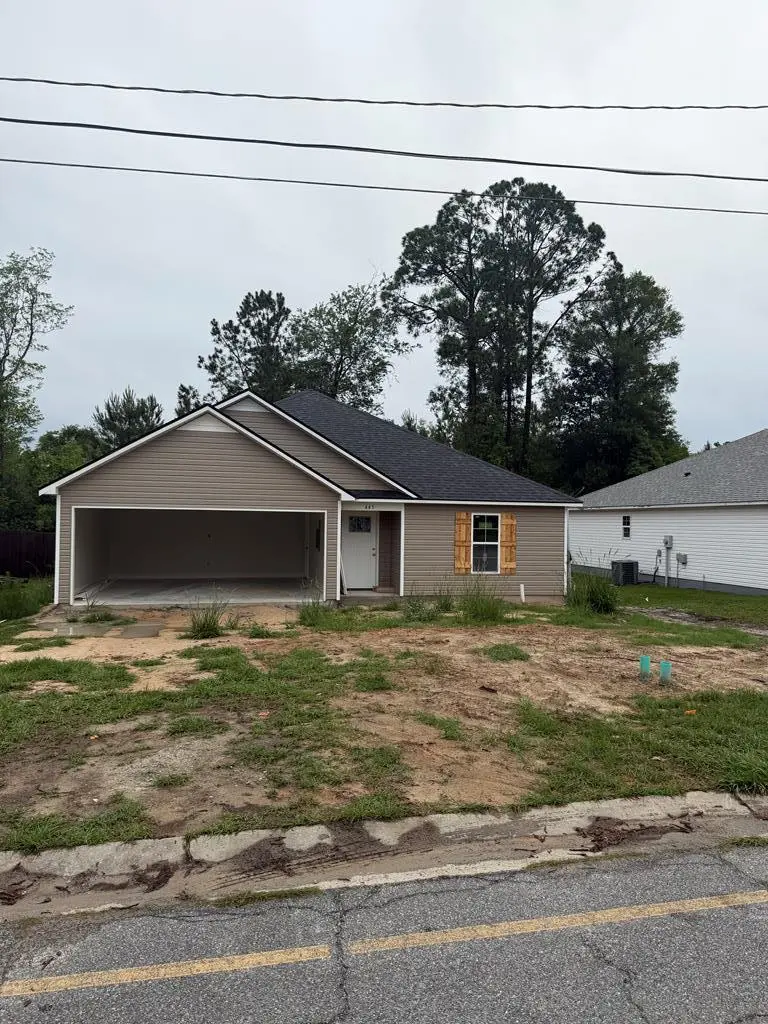
445 Bryson Cir · Hahira, GA
Flood risk 1/10 · Minimal
- FEMA flood zone
- X (unshaded)
- Chance of flooding over 30 yrs
- 0.0%
- Est. flood insurance / yr
- $507 – $1,088
Fire risk 7/10 · Major
- Est. fire insurance / yr
- $963 – $1,789
Heat risk 8/10 · Major
- Hot days now (above 108°F)
- 7 days/yr
- Hot days in 30 yrs
- 20 days/yr
Wind risk 8/10 · Major
- Chance of severe wind over 30 yrs
- 99.0%
Air-quality risk 6/10 · Moderate
- Unhealthy air days now
- 10 days/yr
- Unhealthy air days in 30 yrs
- 13 days/yr
Risk factors via First Street. Map © Google.
Why this score? — see what drove the D- grade
The composite is a weighted blend of 9 inputs, each scored 0–100. Each bar is that input's sub-score; the figure is the points it added to the 100-point composite (weight × sub-score).
- Appreciation +10.0/10.0
- ARV discount +7.5/15.0
- Cash flow +6.6/30.0
- Schools +4.7/10.0
- Livability +3.4/5.0
- Rent growth +2.5/5.0
- Condition / age +2.5/5.0
- 1% rule +1.7/10.0
- DSCR +0.9/10.0
$249,900
🖨 Deal sheet (PDF) 📄 Offer letter ✓ Due diligence
Listing remarks
Brand New 3 bed/ bath house in the CITY OF HAHIRA! Home features custom cabinetry in the kitchen and baths, trey ceilings, large walk in master closet, ALL LVP FLOORING, and a 2 car garage. Enjoy the peacefulness of woods behind the home while sitting on the large covered back porch! Home is almost finished and more pictures will be posted soon!
Key facts
- Custom cabinetry
- 7,405 sq ft lot
- 2 garage spots
Tags
Property features AI
Exterior
- Parking: 2-car garage with garage door opener
- Utilities: Public water; Public sewer
- Home design: Single-family residence; One story; Residential property
- Construction: Vinyl siding; House construction
- Exterior features: Covered patio/porch
Interior
- Kitchen: Dishwasher; Microwave
- Flooring: Tile; Vinyl
- Bathrooms: 2 full bathrooms
- Heating & cooling: Heat pump heating
- Interior features: Dishwasher; Microwave
- Laundry & utility: Dedicated laundry room
Neighborhood map
What this means for you Summary
Snapshot
- This is a 3-bed/2.0-bath other listed at $250k.
Deal economics
- At list price, monthly cash flow is $-407 ($-5k/yr) — negative.
- To cash-flow at today's rent, offer at most $191k (23.6% below list).
- To meet the 1% rule (rent ≥ 1% of price), the offer needs to be $167k (33.2% below list).
- Recommended offer: $167k (33.2% below list) — sets the bar for 1% rule.
Location & tenants
- Location reads 67/100 on livability (#161 in GA) — a middle-class / working-renter tenant base. Strengths: cost of living A+, housing A+; Watch: crime C-, employment D+, health & safety D.
- Lowndes County (rural): math 59% / reading 52% proficiency, ranked #8 of 174 in GA (top 5%) — acceptable for families but not a draw, mixed tenant base, ~2y average lease.
- Zoned schools: Hahira Elementary School (math 72% / reading 55%, grade B, #99 of 1,228 statewide, top 8%, 807 students, 40% FRL); Hahira Middle School (math 65% / reading 63%, grade B+, #30 of 470 statewide, top 6%, 859 students, 32% FRL); Lowndes High School (math 69% / reading 51%, grade C+, #14 of 424 statewide, top 3%, 3,201 students, 39% FRL) — zoned schools at 37% FRL track the district average.
- Market conditions: 198 active listings in the ZIP; 3 comparable units currently listed for rent nearby; rentals lingering (median 46d on market — plan ~5-8 weeks vacancy on turnover, expect pricing pressure); 67% of comp listings sitting > 30 days — soft ceiling on asking rent; solid renter incomes; 896 units permitted in Lowndes County in 2024 (0 in 5+ unit buildings).
Forward outlook
- In year one you build about $27k of equity ($2k loan paydown + $25k appreciation (10.0% local appreciation)).
- Lowndes County population projected at +10% by 2050 — modest demand growth; plan on rents tracking national, not racing it.
- By year 2, paydown + projected appreciation supports a ~$43k cash-out refi (75% LTV) — recoverable capital for the next deal without selling this one.
Negotiation context
- It's been on market 24 days — a 2% lower offer ($246k) is reasonable based on typical stale-listing flexibility.
Risks & watch-outs
- Climate carrying-cost: severe wind risk, 99% chance of damaging wind over 30y; major wildfire risk; extreme-heat days projected 7→20/yr by 2055 (HVAC capex compounding) — expect insurance premiums to compound above CPI over the hold.
Questions for the listing agent
- What do current leases actually rent for vs. the listed asking? Can we see a recent rent roll and the last 12 months of T-12 income?
- Is there a deadline driving the sale (1031 exchange, divorce, estate, relocation)? That informs how much negotiation room exists.
- The area grade is low — what's the realistic commute time and amenity access for the typical tenant pool here? Any planned neighborhood developments (good or bad) we should know about?
- What's the average days-on-market for RENTAL listings here right now (not sales)? A rising rental-DOM trend means longer vacancies and softer asking-rent achievability than the comps imply.
- What's the recent tenant-quality profile in this submarket — average credit score on applications, eviction rate, late-payment / NSF rate, and stable-employment percentage? A property-management company in the area should have these aggregated.
- How much new for-sale + rental construction is in the pipeline within 1–3 miles? Heavy new supply typically softens prices + rents 12–24 months out; constrained supply supports both.
Investment metrics
- 1% rule
- 0.67% ✗
- Cap rate
- 4.34%
- Cash-on-cash
- -6.99%
- DSCR
- 0.69
- GRM
- 12.5
CMA / ARV
No comps found within radius.
Projected returns pro-forma
10.0% appreciation · 3.0% rent growth · sell at horizon
- IRR
- 19.3%
- Equity multiple
- 2.57×
- Total profit
- $110,184
- Equity at exit
- $225,130
- IRR
- 17.8%
- Equity multiple
- 5.93×
- Total profit
- $344,925
- Equity at exit
- $485,501
Cash invested: $69,972 (down + closing). Projections, not guarantees.
Landlord ↔ Tenant lean methodology
- Overall (STATE)
- 90 Strongly Landlord-Friendly
- State Georgia
- 90 Strongly Landlord-Friendly · R+3
- County
- — inherits STATE
- City
- — inherits STATE
ZIP-level market 31632
- Home prices YoY
- 8.1%
- Active inventory
- 198
- Price-to-rent
- 12.5×
Monthly cashflow live
- Estimated rent
- $1,670 medium interval (Pro) →
- Mortgage (P&I)
- −$1,311
- Tax est. 1.5%
- −$312 /mo · $3,748/yr
- Insurance
- −$104
- HOA
- −$0
- Vacancy / Maint / Mgmt
- −$351
- Net cashflow
- $-407
Break-even live
Sensitivity live
| Price | -10% $-235 | -5% $-321 | +0% $-407 | +5% $-494 | +10% $-580 |
|---|---|---|---|---|---|
| Rent | -10% $-539 | -5% $-473 | +0% $-407 | +5% $-341 | +10% $-275 |
| Rate | -1.0pp $-281 | -0.5pp $-344 | base $-407 | +0.5pp $-472 | +1.0pp $-538 |
UW: 25.0% down · 7.5% · 30yr · 1.5% tax · 5.0% vac · 8.0% maint · 8.0% mgmt
Financing live
Cash to close
- Down payment
- $62,475
- Closing costs
- $7,497
- Reserves months
- —
- Total cash needed
- —
Loan-product check · same deal, 3 products live
Conventional
25% down · 7.5% · 30yr
- Down + closing
- —
- Monthly P&I
- —
- Monthly cashflow
- —
- DSCR
- —
- Eligible?
- —
Personal DTI + credit; lowest rate.
DSCR
20% down · 8.5% · 30yr
- Down + closing
- —
- Monthly P&I
- —
- Monthly cashflow
- —
- DSCR
- —
- Eligible?
- —
No personal income docs; deal must DSCR.
Hard money
10% down · 12.0% · 12mo
- Down + closing
- —
- Monthly P&I
- —
- Monthly cashflow
- —
- DSCR
- —
- Eligible?
- —
Short-term bridge; refi at stabilization.
Rent comps 3 comps
| Address | Beds | Baths | Sqft | Rent | $/sqft | DOM | Units | Dist |
|---|---|---|---|---|---|---|---|---|
| 305 Barfield St Hahira, GA | 3.0 | 2.0 | 1361 | $1,495 | $1.10 | 45d | 1 | 0.41mi |
| 302 Lee St Hahira, GA | 3.0 | 2.0 | 950 | $1,095 | $1.15 | 23d | 1 | 0.68mi |
| 310 Elizabeth St Hahira, GA | 3.0 | 2.0 | 1200 | $1,195 | $1.00 | 45d | 1 | 0.70mi |
Listing history 21 events
-
2026-06-21days on market $249,900 Active 24 DOM
-
2026-06-19days on market $249,900 Active 22 DOM
-
2026-06-18days on market $249,900 Active 21 DOM
-
2026-06-17days on market $249,900 Active 20 DOM
-
2026-06-16days on market $249,900 Active 19 DOM
-
2026-06-15days on market $249,900 Active 18 DOM
-
2026-06-14days on market $249,900 Active 16 DOM
-
2026-06-13days on market $249,900 Active 15 DOM
-
2026-06-10days on market $249,900 Active 13 DOM
-
2026-06-09days on market $249,900 Active 12 DOM
-
2026-06-08days on market $249,900 Active 11 DOM
-
2026-06-07days on market $249,900 Active 10 DOM
-
2026-06-05days on market $249,900 Active 7 DOM
-
2026-06-03days on market $249,900 Active 6 DOM
-
2026-06-02days on market $249,900 Active 5 DOM
-
2026-06-01days on market $249,900 Active 4 DOM
-
2026-05-31days on market $249,900 Active 3 DOM
-
2026-05-30days on market $249,900 Active 2 DOM
-
2026-05-28$249,900 Active
-
2005-03-24soldstatus $247,500
-
2005-03-24soldstatus $1,687,500
ⓘ Source: listings_history table (triggers on properties + properties_extension) + one-shot
backfill from property_details.listing_events for pre-trigger history.
Climate risk First Street
- Flood 1/10 Low FEMA zone X (unshaded) · 0% chance over 30 yrs
- Wildfire 7/10 Severe
- Heat 8/10 Severe 7 d/yr ≥108°F today · 20 d/yr by 30 yrs out
- Wind 8/10 Severe 99% chance of damaging wind over 30 yrs
- Air quality 6/10 Major 10 unhealthy d/yr today · 13 by 30 yrs out
Nearby sold comps map
Loading sold comps map…
Walkable amenities ~0.75 mi
Loading nearby amenities…
Taxation est. · year 1
- Rental income
- $20,046
- − Mortgage interest
- −$13,998
- − Property taxes
- −$3,748
- − Insurance
- −$1,250
- − Repairs & maintenance
- −$1,604
- − Management
- −$1,604
- − Depreciation
- −$7,270
- Taxable loss
- −$9,428
- Est. tax savings @ 24.0%
- +$2,263
- After-tax cash flow
- $-2,625/yr
For passive investors: Depreciation is non-cash, so a rental often shows a tax loss while cash-flowing — sheltering income. Rental losses are passive: they offset passive income freely, and up to $25,000/yr can offset ordinary (W-2) income if you actively participate and your MAGI is under $100k (phasing out to $0 by $150k); unused losses carry forward. On sale, claimed depreciation is recaptured at up to 25%, and gains may owe capital-gains tax (a 1031 exchange can defer both). Figures are a year-1 estimate at your 24.0% rate — not tax advice; consult a CPA.
Schools (NCES district)
- District
- Lowndes County
- NCES district ID
- 1303390
- Math proficiency
- 59% ▼ -1.00%
- Reading proficiency
- 52% ▼ -2.00%
- Median HH income
- $48,221
- Composite
- 47.21/100
- National rank
- #2317
- State rank
- #8 of 174 in GA
Livability — Hahira
- Score
- 67/100
- State rank
- #161
- US rank
- #10280
Category grades
Schools grade is shown separately in the Schools card above.
Census & demographics
- Census place
- Hahira, GA
- County
- Lowndes County · 107,801 people
- Metro
- Valdosta, GA
- Population (ZIP)
- 15,942
- Household income
- $83,946
- Rent vs Own
- Severe rent burden
- 73.0
Population outlook (Lowndes County) Hauer SSP2
- Today (2025)
- 120,348 people
- By 2030
- 123,469 · +2.6%
- By 2040
- 128,482 · +6.8%
- By 2050
- 131,907 · +9.6%
- By 2075
- 139,080 · +15.6%
- By 2100
- 133,649 · +11.1%
Race, ethnicity, and origin ACS 2023
- Neighborhood character
- Predominantly White (79%)
- Race & ethnicity
- White 79% Black 12% Hispanic / Latino 6% Two or more races 5%
- Hispanic origin (detail)
- Mexican 2% Puerto Rican 2%
- Common ancestry
- Slovak 3% Serbian 2% Italian 1%
- Foreign-born
- 2% · Canada, Jamaica
- Languages at home
- 96% English-only · Spanish 3%
Political lean MEDSL · Lowndes
- 2024 margin
- R (+18.0) · D 40.8% · R 58.8%
- 2008→2024 swing
- -8.6pp toward R · 2008: -9.4pp · 2024: -18.0pp
- All cycles
- 2024: R+18.0 2020: R+12.0 2016: R+18.2 2012: R+10.5 2008: R+9.4
Not yet ingested
- Civics
- —
Market trends
- HPI YoY
- ▲ 19.44%
- Current HPI
- 259.01
- Rent YoY
- —
- Metro
- Valdosta, GA
- State GDP YoY
- ▲ 2.66%
- F500 in state
- 28
Industry mix (Fortune 500 HQ in GA)
| Industry | F500 HQs | Revenue |
|---|---|---|
| Paper / Packaging | 2 | $29B |
|
||
| Retail | 1 | $160B |
|
||
| Transportation / Logistics | 1 | $91B |
|
||
| Airlines | 1 | $62B |
|
||
| Consumer Goods | 1 | $47B |
|
||
| Utilities | 1 | $25B |
|
||
Price history
+1.0% since first listed3 events — show timeline
- 2026-05-28 Listed $249,900 SGMLS
- 2005-03-24 Sold (Public Records) $1,687,500 Public Records
- 2005-03-24 Sold (Public Records) $247,500 Public Records
Property tax history
-0.6%/yrLatest (2025): $256 · -2.9% YoY. Source: county tax records.
Cash-flow waterfall
monthlySold comps — $/sqft
last 12 mo · ≤1 miLoading sold comps…