 Duplex
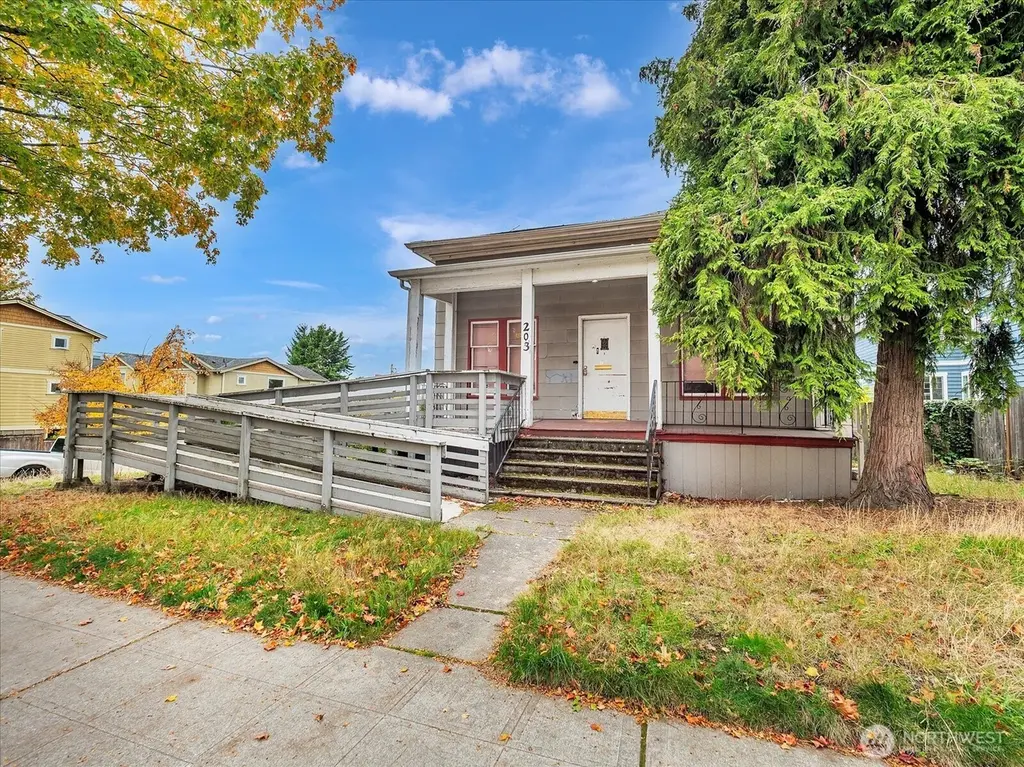
203 23rd Ave · Seattle, WA
Flood risk 1/10 · Minimal
- FEMA flood zone
- X (unshaded)
- Chance of flooding over 30 yrs
- 0.0%
- Est. flood insurance / yr
- $473 – $860
Fire risk 1/10 · Minimal
- Est. fire insurance / yr
- $604 – $1,122
Heat risk 3/10 · Minor
- Hot days now (above 86°F)
- 7 days/yr
- Hot days in 30 yrs
- 15 days/yr
Wind risk 1/10 · Minimal
- Chance of severe wind over 30 yrs
- —
Air-quality risk 7/10 · Major
- Unhealthy air days now
- 11 days/yr
- Unhealthy air days in 30 yrs
- 11 days/yr
Risk factors via First Street. Map © Google.
Why this score? — see what drove the C- grade
The composite is a weighted blend of 9 inputs, each scored 0–100. Each bar is that input's sub-score; the figure is the points it added to the 100-point composite (weight × sub-score).
- Cash flow +15.3/30.0
- ARV discount +15.0/15.0
- Schools +6.1/10.0
- DSCR +4.7/10.0
- 1% rule +3.8/10.0
- Livability +3.8/5.0
- Rent growth +2.8/5.0
- Condition / age +2.5/5.0
- Appreciation +0.0/10.0
$725,000
🖨 Deal sheet 📄 Offer letter ✓ Due diligence
Multi-family units
County records classify this as Multi-Family (2-4 Unit). Listing-text estimate: 2 units. confirmed
Listing remarks
Fantastic investment or redevelopment opportunity in Seattle! This 1900-built duplex offers 2,940 total SF, all ready for renovation or reimagining. The 4,800 SF corner lot is zoned LR2(M), providing flexibility for multi-unit potential or redevelopment. Conveniently located near downtown, I-5, I-90, schools, parks, and transit. With strong fundamentals and zoning upside, this classic property is ready for its next chapter. An excellent option for builders, investors, or those seeking a project with vision.
Key facts
- Near schools
- Zoned lr2m
- Near transit
Tags
Neighborhood map
What this means for you Summary
Snapshot
- This is a 2 × 3-bed/1.0-bath units multifamily listed at $725k.
Deal economics
- At list price, monthly cash flow is $263 ($3k/yr) — positive. Per door: $131/mo.
- The deal already cash-flows at list — no discount required.
- To meet the 1% rule (rent ≥ 1% of price), the offer needs to be $639k (11.8% below list).
- Recommended offer: $638k (12.0% below list) — sets the bar for market timing.
- Cap rate 6.7% vs local median 1.6% in Seattle — top-decile yield for the area; either an underpriced asset or a hidden risk that comps aren't pricing in. Stress-test before assuming the spread holds.
Location & tenants
- Location reads 75/100 on livability (#166 in WA, #4,033 nationally) — a middle-class / working-renter tenant base. Strengths: amenities A+, commute A+, employment A+; Watch: crime F, cost of living F.
- Seattle Public Schools (urban): math 64% / reading 72% proficiency, ranked #19 of 291 in WA (top 6%) — acceptable for families but not a draw, mixed tenant base, ~2y average lease.
- Market conditions: Rents rising (+1.3%/yr); 222 active listings in the ZIP; 7 comparable units currently listed for rent nearby; rentals leasing fast (median 1d on market — plan ~1-2 weeks tenant-placement turnaround); solid renter incomes; 10,555 units permitted in King County in 2024 (7,119 in 5+ unit buildings).
- At $6,392/mo this rent would consume 72% of the median local household income ($107k/yr) (locally 3225% of renters already pay >50% of income on rent) — very limited rent-growth headroom before tenants either downsize or default.
Forward outlook
- Local home prices are declining (-3.0%/yr); year-one equity from $5k of loan paydown is wiped out by about $22k of value loss. Plan a longer hold.
- King County population projected at +44% by 2050 — long-run rental-demand tailwind backs the buy-and-hold thesis.
Negotiation context
- It's been on market 232 days — a 12% lower offer ($638k) is reasonable based on typical stale-listing flexibility.
- 4 sale attempts; this cycle's ask has dropped $100k (12%) from the opening price — seller is motivated, your offer sets the floor, not the list.
Risks & watch-outs
- Watch-outs: built in 1900 — expect roof / HVAC / electrical / plumbing capex.
Questions for the listing agent
- It's been on market 232 days. Have you received any prior offers? Is the seller open to a 12% concession, seller financing, or rate buy-down credit?
- Can we see the unit-by-unit rent roll, current vacancy, and any below-market leases? What's the average tenancy length?
- What capital expenditures (roof, boiler, parking lot, exteriors) have been made in the last 5 years, and what's planned in the next 2?
- Built in 1900 — when were the roof, HVAC, electrical panel, plumbing, and water heater last replaced?
- Why hasn't it sold? Are there any deal-killer items the seller is aware of (foundation, flood, title, zoning, code violations)?
- Is there a deadline driving the sale (1031 exchange, divorce, estate, relocation)? That informs how much negotiation room exists.
- Schools are A-rated — typically a magnet for longer-tenancy family renters. What's the average tenant stay here, and is there a school-zone premium baked into asking?
- Crime grade is F in this area — have there been break-ins, vandalism, or insurance claims at this property in the last 3 years? What carrier currently insures it and at what premium?
- What's the average days-on-market for RENTAL listings here right now (not sales)? A rising rental-DOM trend means longer vacancies and softer asking-rent achievability than the comps imply.
- What's the recent tenant-quality profile in this submarket — average credit score on applications, eviction rate, late-payment / NSF rate, and stable-employment percentage? A property-management company in the area should have these aggregated.
- How much new apartment / multifamily construction is in the pipeline within 1–3 miles? Heavy new supply (>2% of stock underway) typically softens rents 12–24 months out; light construction supports rent growth.
Investment metrics
- 1% rule
- 0.88% ✗
- Cap rate
- 6.73%
- Cash-on-cash
- 1.55%
- DSCR
- 1.07
- GRM
- 9.5
CMA / ARV
- ARV (median comp)
- $1,116,734
- List price
- $725,000
- Delta
- -35.08%
- Verdict
- UNDERPRICED
- Comps
- 20 within 1.0 mi
Show comp detail 3 sales within ~0.75 mi
| Address | Dist | Beds/Ba | Sqft | Sold | Price | $/sf | Match |
|---|---|---|---|---|---|---|---|
| 2762 S Washington St | 0.36mi | 5/2.5 (+1) | 2,760 (+7%) | 14mo | $1,257,500 | $456 | 52 |
| 539 26th Ave S | 0.50mi | 3/3.0 (-1) | 2,680 (+4%) | 13mo | $800,000 | $299 | 50 |
| 926 18th Ave | 0.59mi | 5/6.0 (+1) | 2,940 (+14%) | 19mo | $1,950,000 | $663 | 12 |
Match score weights: distance 35% · size 25% · config 20% · recency 20%. Top-matched comps best support the ARV.
Projected returns pro-forma
-3.0% appreciation · 1.3% rent growth · sell at horizon
- IRR
- -15.7%
- Equity multiple
- 0.45×
- Total profit
- $-111,540
- Equity at exit
- $108,100
- IRR
- -10.3%
- Equity multiple
- 0.42×
- Total profit
- $-118,383
- Equity at exit
- $62,685
Cash invested: $203,000 (down + closing). Projections, not guarantees.
Landlord ↔ Tenant lean methodology
- Overall (CITY)
- 0 Strongly Tenant-Friendly
- State Washington
- 28 Tenant-Leaning · D+8
- County
- — inherits STATE
- City Seattle
- 0 Strongly Tenant-Friendly · D+52
ZIP-level market 98122
- Rents YoY
- 1.3%
- Active inventory
- 222
- Price-to-rent
- 18.9×
Monthly cashflow live
- Estimated rent
- $6,392 high interval (Pro) →
- Mortgage (P&I)
- −$3,802
- Tax from tax record
- −$683 /mo · $8,195/yr
- Insurance
- −$302
- HOA
- −$0
- Vacancy / Maint / Mgmt
- −$1,342
- Net cashflow
- $263
Break-even live
2-unit breakdown (identical units grouped — click to expand)
| Units | Beds | Baths | Est. rent |
|---|---|---|---|
| 2× units | 3 | 1 | $6,392 |
| #1 | 3 | 1 | $3,196 |
| #2 | 3 | 1 | $3,196 |
| Total (2 units) | $6,392 | ||
UW: 25.0% down · 7.5% · 30yr · 1.5% tax · 5.0% vac · 8.0% maint · 8.0% mgmt
Financing live
Cash to close
- Down payment
- $181,250
- Closing costs
- $21,750
- Reserves months
- —
- Total cash needed
- —
Loan-product check · same deal, 3 products live
Conventional
25% down · 7.5% · 30yr
- Down + closing
- —
- Monthly P&I
- —
- Monthly cashflow
- —
- DSCR
- —
- Eligible?
- —
Personal DTI + credit; lowest rate.
DSCR
20% down · 8.5% · 30yr
- Down + closing
- —
- Monthly P&I
- —
- Monthly cashflow
- —
- DSCR
- —
- Eligible?
- —
No personal income docs; deal must DSCR.
Hard money
10% down · 12.0% · 12mo
- Down + closing
- —
- Monthly P&I
- —
- Monthly cashflow
- —
- DSCR
- —
- Eligible?
- —
Short-term bridge; refi at stabilization.
Rent comps 7 comps
| Address | Beds | Baths | Sqft | Rent | $/sqft | DOM | Units | Dist |
|---|---|---|---|---|---|---|---|---|
| 707 Lake Washington Blvd S Seattle, WA | 3.0 | 1.5 | 2200 | $5,950 | $2.70 | 18d | 1 | 0.83mi |
| 1708 18th Ave Seattle, WA | 3.0 | 3.5 | 1780 | $4,995 | $2.81 | 1d | 1 | 0.92mi |
| 1415 38th Ave Seattle, WA | 4.0 | 3.0 | 2696 | $6,250 | $2.32 | 44d | 1 | 1.05mi |
| 113 27th Ave E Seattle, WA | 3.0 | 3.0 | 1928 | $4,695 | $2.44 | 43d | 1 | 1.09mi |
| 200 27th Ave E Seattle, WA | 4.0 | 3.0 | 2080 | $3,800 | $1.83 | 1d | 1 | 1.16mi |
| 344 17th Ave E Seattle, WA | 5.0 | 2.0 | 3000 | $3,900 | $1.30 | 1d | 1 | 1.27mi |
| 702 Spring St Seattle, WA | 3.0 | 1.0–2.0 | 1172 | $7,115 | $6.07 | 1d | 34 | 1.31mi |
Listing history 28 events
-
2026-06-19days on market $725,000 Active 232 DOM
-
2026-06-18days on market $725,000 Active 231 DOM
-
2026-06-17days on market $725,000 Active 230 DOM
-
2026-06-16days on market $725,000 Active 229 DOM
-
2026-06-15days on market $725,000 Active 228 DOM
-
2026-06-15days on market $725,000 Active 227 DOM
-
2026-06-13days on market $725,000 Active 226 DOM
-
2026-06-12days on market $725,000 Active 225 DOM
-
2026-06-10days on market $725,000 Active 223 DOM
-
2026-06-09days on market $725,000 Active 222 DOM
-
2026-06-08days on market $725,000 Active 221 DOM
-
2026-06-07days on market $725,000 Active 220 DOM
-
2026-06-07days on market $725,000 Active 219 DOM
-
2026-06-04days on market $725,000 Active 217 DOM
-
2026-06-03days on market $725,000 Active 216 DOM
-
2026-06-02days on market $725,000 Active 215 DOM
-
2026-06-01days on market $725,000 Active 214 DOM
-
2026-05-31days on market $725,000 Active 213 DOM
-
2026-04-18price $725,000
-
2026-04-18price $725,000
-
2026-01-09status Active
-
2026-01-09status Active
-
2026-01-06status Pending
-
2026-01-06status Pending
-
2025-12-20price $775,000
-
2025-12-20price $775,000
-
2025-10-28$825,000 Active
-
2025-10-28$825,000 Active
ⓘ Source: listings_history table (triggers on properties + properties_extension) + one-shot
backfill from property_details.listing_events for pre-trigger history.
Tax reassessment forecast WA · Resets to sale price
- Current annual tax
- $8,195 · $683/mo
- Projected year-2 tax
- $8,195 · $683/mo
- Expected delta
- $0/yr ($0/mo · 0.0%)
ⓘ Screening estimate from a state-policy table — verify with the county assessor before closing.
Climate risk First Street
- Flood 1/10 Low FEMA zone X (unshaded) · 0% chance over 30 yrs
- Wildfire 1/10 Low
- Heat 3/10 Moderate 7 d/yr ≥86°F today · 15 d/yr by 30 yrs out
- Wind 1/10 Low
- Air quality 7/10 Severe 11 unhealthy d/yr today · 11 by 30 yrs out
Nearby sold comps map
Loading sold comps map…
Walkable amenities ~0.75 mi
Loading nearby amenities…
Taxation est. · year 1
- Rental income
- $76,704
- − Mortgage interest
- −$40,611
- − Property taxes
- −$8,195
- − Insurance
- −$3,625
- − Repairs & maintenance
- −$6,136
- − Management
- −$6,136
- − Depreciation
- −$21,091
- Taxable loss
- −$9,090
- Est. tax savings @ 24.0%
- +$2,182
- After-tax cash flow
- $5,334/yr
For passive investors: Depreciation is non-cash, so a rental often shows a tax loss while cash-flowing — sheltering income. Rental losses are passive: they offset passive income freely, and up to $25,000/yr can offset ordinary (W-2) income if you actively participate and your MAGI is under $100k (phasing out to $0 by $150k); unused losses carry forward. On sale, claimed depreciation is recaptured at up to 25%, and gains may owe capital-gains tax (a 1031 exchange can defer both). Figures are a year-1 estimate at your 24.0% rate — not tax advice; consult a CPA.
Schools (NCES district)
- District
- Seattle Public Schools
- NCES district ID
- 5307710
- Math proficiency
- 64% ▼ -1.00%
- Reading proficiency
- 72% ▬ 0.00%
- Median HH income
- $68,695
- Composite
- 60.76/100
- National rank
- #1649
- State rank
- #19 of 291 in WA
Livability — Seattle
- Score
- 75/100
- State rank
- #166
- US rank
- #4033
Category grades
Schools grade is shown separately in the Schools card above.
Census & demographics
- Census place
- Seattle, WA
- County
- King County · 2,251,916 people
- City population
- 706,262
- Metro
- Seattle-Tacoma-Bellevue, WA
- Population (ZIP)
- 43,234
- Household income
- $106,886
- Rent vs Own
- Severe rent burden
- 3225.0
Population outlook (King County) Hauer SSP2
- Today (2025)
- 2,576,485 people
- By 2030
- 2,803,316 · +8.8%
- By 2040
- 3,255,921 · +26.4%
- By 2050
- 3,706,444 · +43.9%
- By 2075
- 4,746,063 · +84.2%
- By 2100
- 5,407,730 · +109.9%
Race, ethnicity, and origin ACS 2023
- Neighborhood character
- Diverse neighborhood (Simpson 0.63)
- Race & ethnicity
- White 58% Asian 15% Two or more races 12% Black 9% Hispanic / Latino 8%
- Hispanic origin (detail)
- Mexican 5%
- Common ancestry
- Italian 4% Lithuanian 3% Romanian 3%
- Foreign-born
- 17% · Canada, China, South Korea
- Languages at home
- 80% English-only · Spanish 4% Chinese 4% Other Indo-European 4%
Political lean MEDSL · King
- 2024 margin
- Solid D (+51.7) · D 74.2% · R 22.5% · Other 3.4%
- 2008→2024 swing
- +9.6pp toward D · 2008: 42.1pp · 2024: 51.7pp
- All cycles
- 2024: D+51.7 2020: D+52.7 2016: D+50.4 2012: D+39.9 2008: D+42.1
Not yet ingested
- Civics
- —
Market trends
- HPI YoY
- ▼ -986.26%
- Current HPI
- 277.8948
- Rent YoY
- ▲ 1.30%
- Metro
- Seattle-Tacoma-Bellevue, WA
- State GDP YoY
- ▲ 4.65%
- F500 in state
- 22
Industry mix (Fortune 500 HQ in WA)
| Industry | F500 HQs | Revenue |
|---|---|---|
| Retail | 2 | $269B |
|
||
| Technology / Retail | 1 | $638B |
|
||
| Technology | 1 | $245B |
|
||
| Telecommunications | 1 | $38B |
|
||
| Food / Beverage | 1 | $36B |
|
||
| Automotive / Trucks | 1 | $34B |
|
||
Price history
-12.1% since first listed10 events — show timeline
- 2026-04-18 Price Changed $725,000 NWMLS as Distributed by MLS Grid
- 2026-04-18 Price Changed $725,000 NWMLS as Distributed by MLS Grid
- 2026-01-09 Relisted — NWMLS as Distributed by MLS Grid
- 2026-01-09 Relisted — NWMLS as Distributed by MLS Grid
- 2026-01-06 Pending — NWMLS as Distributed by MLS Grid
- 2026-01-06 Pending — NWMLS as Distributed by MLS Grid
- 2025-12-20 Price Changed $775,000 NWMLS as Distributed by MLS Grid
- 2025-12-20 Price Changed $775,000 NWMLS as Distributed by MLS Grid
- 2025-10-28 Listed $825,000 NWMLS as Distributed by MLS Grid
- 2025-10-28 Listed $825,000 NWMLS as Distributed by MLS Grid
Property tax history
+5.1%/yrLatest (2025): $8,195 · +3.3% YoY. Source: county tax records.
Cash-flow waterfall
monthlySold comps — $/sqft
last 12 mo · ≤1 miLoading sold comps…