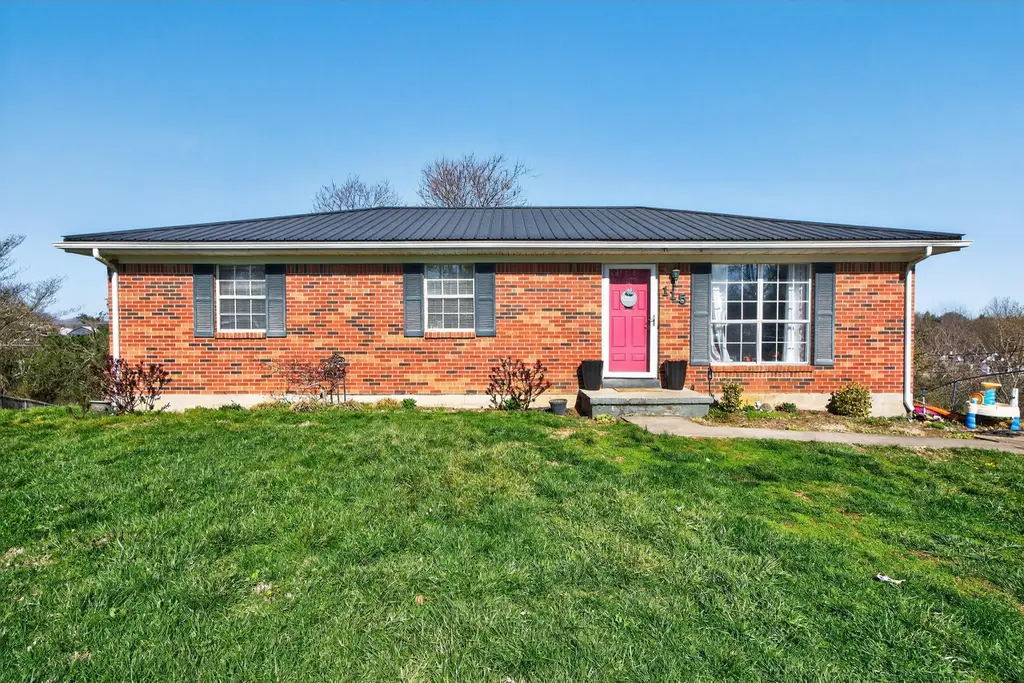
115 Overlook Ct · Junction City, KY
Flood risk 1/10 · Minimal
- FEMA flood zone
- X (unshaded)
- Chance of flooding over 30 yrs
- 0.0%
- Est. flood insurance / yr
- $507 – $1,088
Fire risk 4/10 · Minor
- Est. fire insurance / yr
- $839 – $1,559
Heat risk 4/10 · Minor
- Hot days now (above 102°F)
- 7 days/yr
- Hot days in 30 yrs
- 20 days/yr
Wind risk 3/10 · Minor
- Chance of severe wind over 30 yrs
- 5.0%
Air-quality risk 1/10 · Minimal
- Unhealthy air days now
- 0 days/yr
- Unhealthy air days in 30 yrs
- 0 days/yr
Risk factors via First Street. Map © Google.
Why this score? — see what drove the D grade
The composite is a weighted blend of 9 inputs, each scored 0–100. Each bar is that input's sub-score; the figure is the points it added to the 100-point composite (weight × sub-score).
- Cash flow +15.1/30.0
- ARV discount +7.5/15.0
- DSCR +4.6/10.0
- Schools +4.5/10.0
- Livability +3.1/5.0
- 1% rule +3.0/10.0
- Rent growth +2.5/5.0
- Condition / age +2.5/5.0
- Appreciation +0.0/10.0
$172,500
🖨 Deal sheet (PDF) 📄 Offer letter ✓ Due diligence
Listing remarks
This welcoming 3-bedroom, 1-bath ranch offers comfortable one-level living in a peaceful setting! This home features a spacious eat-in kitchen perfect for everyday meals or entertaining, large living room and bedrooms. Roof & Water Heater only 6 years old. Heat is ceiling heat and AC is window units . Step outside to enjoy a large yard with beautiful views. A one-year home warranty is included with an accepted offer, providing added peace of mind. Don't miss this opportunity for country-style living with convenience! Will not qualify for FHA, VA or USDA. Property is a great opportunity for a buyer to do TLC and build equity. Consider renovation financing options including 203K loans.
Key facts
- 0.33 acre lot
- Listed 85 days
Property features AI
Finance
- Other: Parcel number CAS-001-024
- HOA & community: Subdivision: Castle Rock
Exterior
- Parking: Driveway; Off-street parking
- Utilities: Public water; Public sewer; Electricity connected; Sewer connected; Water connected
- Home design: One-story house
- Construction: Brick veneer construction; Metal roof; Block foundation; Built area approximately 1,170
- Exterior features: Chain link fencing; Neighborhood and farm views
Interior
- Kitchen: Dishwasher; Refrigerator; Range
- Bedrooms: Total rooms: 6
- Flooring: Carpet; Ceramic tile; Laminate
- Bathrooms: 1 full bathroom
- Heating & cooling: Ceiling heating; Window unit cooling
- Interior features: Eat-in kitchen; Primary bedroom on the first floor; Ceiling fans
- Laundry & utility: Washer hookup; Electric dryer hookup
Neighborhood map
What this means for you Summary
Snapshot
- This is a 3-bed/1.0-bath other listed at $172k.
Deal economics
- At list price, monthly cash flow is $58 ($698/yr) — positive.
- The deal already cash-flows at list — no discount required.
- To meet the 1% rule (rent ≥ 1% of price), the offer needs to be $138k (20.1% below list).
- Recommended offer: $138k (20.1% below list) — sets the bar for 1% rule.
- Cap rate 6.7% vs local median 2.2% in Junction City — top-decile yield for the area; either an underpriced asset or a hidden risk that comps aren't pricing in. Stress-test before assuming the spread holds.
Location & tenants
- Location reads 62/100 on livability (#344 in KY) — a middle-class / working-renter tenant base. Strengths: crime A+, cost of living A+, housing A+; Watch: health & safety D+, amenities F, commute F.
- Boyle County (town): math 49% / reading 57% proficiency, ranked #7 of 165 in KY (top 4%) — acceptable for families but not a draw, mixed tenant base, ~2y average lease.
- Zoned schools: Junction City Elementary School (math 37% / reading 47%, grade F, #178 of 676 statewide, top 29%, 420 students, 63% FRL); Boyle County Middle School (math 52% / reading 58%, grade B-, #9 of 217 statewide, top 5%, 679 students, 50% FRL); Boyle County High School (math 42% / reading 57%, grade D, #13 of 254 statewide, top 5%, 884 students, 45% FRL) — zoned schools average 53% FRL vs 38% district-wide (15 pts higher); higher-poverty schools than district average — tighter screening recommended.
- Market conditions: 166 active listings in the ZIP; 1 comparable units currently listed for rent nearby; 85 units permitted in Boyle County in 2024 (0 in 5+ unit buildings).
Forward outlook
- Local home prices are declining (-3.0%/yr); year-one equity from $1k of loan paydown is wiped out by about $5k of value loss. Plan a longer hold.
- Boyle County population projected at +13% by 2050 — modest demand growth; plan on rents tracking national, not racing it.
Negotiation context
- It's been on market 86 days — a 6% lower offer ($162k) is reasonable based on typical stale-listing flexibility.
- 3 sale attempts with the ask held roughly flat each time — persistent listings suggest the price (not the market) is what's stuck; bring a comps-based counter.
- Current owner paid $40k; list at $172k implies a 331% gain — meaningful room to come down on a strong offer.
Questions for the listing agent
- It's been on market 86 days. Have you received any prior offers? Is the seller open to a 20% concession, seller financing, or rate buy-down credit?
- Why hasn't it sold? Are there any deal-killer items the seller is aware of (foundation, flood, title, zoning, code violations)?
- Is there a deadline driving the sale (1031 exchange, divorce, estate, relocation)? That informs how much negotiation room exists.
- Schools are B-rated — typically a magnet for longer-tenancy family renters. What's the average tenant stay here, and is there a school-zone premium baked into asking?
- The area grade is low — what's the realistic commute time and amenity access for the typical tenant pool here? Any planned neighborhood developments (good or bad) we should know about?
- What's the average days-on-market for RENTAL listings here right now (not sales)? A rising rental-DOM trend means longer vacancies and softer asking-rent achievability than the comps imply.
- What's the recent tenant-quality profile in this submarket — average credit score on applications, eviction rate, late-payment / NSF rate, and stable-employment percentage? A property-management company in the area should have these aggregated.
- How much new for-sale + rental construction is in the pipeline within 1–3 miles? Heavy new supply typically softens prices + rents 12–24 months out; constrained supply supports both.
Investment metrics
- 1% rule
- 0.80% ✗
- Cap rate
- 6.70%
- Cash-on-cash
- 1.45%
- DSCR
- 1.06
- GRM
- 10.4
CMA / ARV
No comps found within radius.
Projected returns pro-forma
-3.0% appreciation · 3.0% rent growth · sell at horizon
- IRR
- -14.1%
- Equity multiple
- 0.50×
- Total profit
- $-24,327
- Equity at exit
- $25,720
- IRR
- -5.3%
- Equity multiple
- 0.65×
- Total profit
- $-16,733
- Equity at exit
- $14,915
Cash invested: $48,300 (down + closing). Projections, not guarantees.
Landlord ↔ Tenant lean methodology
- Overall (STATE)
- 83 Strongly Landlord-Friendly
- State Kentucky
- 83 Strongly Landlord-Friendly · R+16
- County
- — inherits STATE
- City
- — inherits STATE
ZIP-level market 40422
- Home prices YoY
- -12.8%
- Active inventory
- 166
- Price-to-rent
- 10.4×
Monthly cashflow live
- Estimated rent
- $1,378 medium interval (Pro) →
- Mortgage (P&I)
- −$905
- Tax from tax record
- −$54 /mo · $644/yr
- Insurance
- −$72
- HOA
- −$0
- Vacancy / Maint / Mgmt
- −$289
- Net cashflow
- $58
Break-even live
Sensitivity live
| Price | -10% $156 | -5% $107 | +0% $58 | +5% $9 | +10% $-39 |
|---|---|---|---|---|---|
| Rent | -10% $-51 | -5% $4 | +0% $58 | +5% $113 | +10% $167 |
| Rate | -1.0pp $145 | -0.5pp $102 | base $58 | +0.5pp $13 | +1.0pp $-32 |
UW: 25.0% down · 7.5% · 30yr · 1.5% tax · 5.0% vac · 8.0% maint · 8.0% mgmt
Financing live
Cash to close
- Down payment
- $43,125
- Closing costs
- $5,175
- Reserves months
- —
- Total cash needed
- —
Loan-product check · same deal, 3 products live
Conventional
25% down · 7.5% · 30yr
- Down + closing
- —
- Monthly P&I
- —
- Monthly cashflow
- —
- DSCR
- —
- Eligible?
- —
Personal DTI + credit; lowest rate.
DSCR
20% down · 8.5% · 30yr
- Down + closing
- —
- Monthly P&I
- —
- Monthly cashflow
- —
- DSCR
- —
- Eligible?
- —
No personal income docs; deal must DSCR.
Hard money
10% down · 12.0% · 12mo
- Down + closing
- —
- Monthly P&I
- —
- Monthly cashflow
- —
- DSCR
- —
- Eligible?
- —
Short-term bridge; refi at stabilization.
Rent comps 1 comps
| Address | Beds | Baths | Sqft | Rent | $/sqft | DOM | Units | Dist |
|---|---|---|---|---|---|---|---|---|
| 4776 Hustonville Rd Danville, KY | 3.0 | 1.0 | 1136 | $1,250 | $1.10 | 45d | 1 | 1.09mi |
Listing history 24 events
-
2026-06-19days on market $172,500 Active 86 DOM
-
2026-06-18days on market $172,500 Active 85 DOM
-
2026-06-17days on market $172,500 Active 84 DOM
-
2026-06-16days on market $172,500 Active 83 DOM
-
2026-06-15days on market $172,500 Active 82 DOM
-
2026-06-14days on market $172,500 Active 80 DOM
-
2026-06-12days on market $172,500 Active 79 DOM
-
2026-06-09days on market $172,500 Active 76 DOM
-
2026-06-08days on market $172,500 Active 75 DOM
-
2026-06-07days on market $172,500 Active 74 DOM
-
2026-06-07days on market $172,500 Active 73 DOM
-
2026-06-03days on market $172,500 Active 70 DOM
-
2026-06-02days on market $172,500 Active 69 DOM
-
2026-06-01days on market $172,500 Active 68 DOM
-
2026-05-31days on market $172,500 Active 67 DOM
-
2026-05-30days on market $172,500 Active 66 DOM
-
2026-03-25$172,500 Active
-
2025-09-02price $160,000
-
2025-08-01status Active
-
2025-07-26historical Contingent
-
2025-07-26historical
-
2025-06-04price $165,000
-
2025-06-02$211,000 Active
-
1995-02-01soldstatus $40,000
ⓘ Source: listings_history table (triggers on properties + properties_extension) + one-shot
backfill from property_details.listing_events for pre-trigger history.
Tax reassessment forecast KY · Resets to sale price
- Current annual tax
- $644 · $54/mo
- Projected year-2 tax
- $1,484 · $124/mo
- Expected delta
- +$840/yr (+$70/mo · 130.4%)
ⓘ Screening estimate from a state-policy table — verify with the county assessor before closing.
Climate risk First Street
- Flood 1/10 Low FEMA zone X (unshaded) · 0% chance over 30 yrs
- Wildfire 4/10 Moderate
- Heat 4/10 Moderate 7 d/yr ≥102°F today · 20 d/yr by 30 yrs out
- Wind 3/10 Moderate 5% chance of damaging wind over 30 yrs
- Air quality 1/10 Low 0 unhealthy d/yr today · 0 by 30 yrs out
Nearby sold comps map
Loading sold comps map…
Walkable amenities ~0.75 mi
Loading nearby amenities…
Taxation est. · year 1
- Rental income
- $16,531
- − Mortgage interest
- −$9,663
- − Property taxes
- −$644
- − Insurance
- −$862
- − Repairs & maintenance
- −$1,323
- − Management
- −$1,323
- − Depreciation
- −$5,018
- Taxable loss
- −$2,301
- Est. tax savings @ 24.0%
- +$552
- After-tax cash flow
- $1,250/yr
For passive investors: Depreciation is non-cash, so a rental often shows a tax loss while cash-flowing — sheltering income. Rental losses are passive: they offset passive income freely, and up to $25,000/yr can offset ordinary (W-2) income if you actively participate and your MAGI is under $100k (phasing out to $0 by $150k); unused losses carry forward. On sale, claimed depreciation is recaptured at up to 25%, and gains may owe capital-gains tax (a 1031 exchange can defer both). Figures are a year-1 estimate at your 24.0% rate — not tax advice; consult a CPA.
Schools (NCES district)
- District
- Boyle County
- NCES district ID
- 2100630
- Math proficiency
- 49% ▼ -18.00%
- Reading proficiency
- 57% ▼ -18.00%
- Median HH income
- $48,352
- Composite
- 45.09/100
- National rank
- #2692
- State rank
- #7 of 165 in KY
Livability — Junction City
- Score
- 62/100
- State rank
- #344
- US rank
- #16311
Category grades
Schools grade is shown separately in the Schools card above.
Census & demographics
- Census place
- Junction City, KY
- County
- Boyle County · 25,950 people
- Metro
- Danville, KY
- Population (ZIP)
- 25,950
- Household income
- $59,615
- Rent vs Own
- Severe rent burden
- 1047.0
Population outlook (Boyle County) Hauer SSP2
- Today (2025)
- 31,908 people
- By 2030
- 32,875 · +3.0%
- By 2040
- 34,549 · +8.3%
- By 2050
- 36,095 · +13.1%
- By 2075
- 39,800 · +24.7%
- By 2100
- 40,157 · +25.9%
Race, ethnicity, and origin ACS 2023
- Neighborhood character
- Predominantly White (81%)
- Race & ethnicity
- White 81% Black 9% Two or more races 6% Hispanic / Latino 5%
- Common ancestry
- Italian 2% Slovak 2% Lithuanian 1%
- Foreign-born
- 3% · Canada
- Languages at home
- 96% English-only · Spanish 2%
Political lean MEDSL · Boyle
- 2024 margin
- Strong R (+29.0) · D 34.7% · R 63.7% · Other 1.5%
- 2008→2024 swing
- -5.8pp toward R · 2008: -23.2pp · 2024: -29.0pp
- All cycles
- 2024: R+29.0 2020: R+24.7 2016: R+29.1 2012: R+26.1 2008: R+23.2
Not yet ingested
- Civics
- —
Market trends
- HPI YoY
- ▼ -38.55%
- Current HPI
- 262.516
- Rent YoY
- —
- Metro
- Danville, KY
- State GDP YoY
- ▲ 1.81%
- F500 in state
- 4
Industry mix (Fortune 500 HQ in KY)
| Industry | F500 HQs | Revenue |
|---|---|---|
| Healthcare | 1 | $118B |
|
||
| Food / Beverage | 1 | $7B |
|
||
Price history
+331.2% since first listed8 events — show timeline
- 2026-03-25 Listed $172,500 ImagineMLS
- 2025-09-02 Price Changed $160,000 ImagineMLS
- 2025-08-01 Relisted — ImagineMLS
- 2025-07-26 Contingent — ImagineMLS
- 2025-07-26 Listing Removed — ImagineMLS
- 2025-06-04 Price Changed $165,000 ImagineMLS
- 2025-06-02 Listed $211,000 ImagineMLS
- 1995-02-01 Sold (Public Records) $40,000 Public Records
Cash-flow waterfall
monthlySold comps — $/sqft
last 12 mo · ≤1 miLoading sold comps…