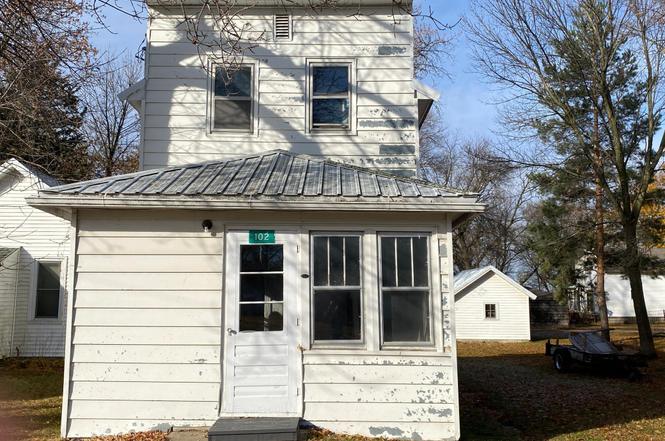
102 Main St · Myrtle, MN
Flood risk 1/10 · Minimal
- FEMA flood zone
- X (unshaded)
- Chance of flooding over 30 yrs
- 0.0%
- Est. flood insurance / yr
- $507 – $1,088
Fire risk 1/10 · Minimal
- Est. fire insurance / yr
- $888 – $1,650
Heat risk 1/10 · Minimal
- Hot days now (above 98°F)
- 7 days/yr
- Hot days in 30 yrs
- 16 days/yr
Wind risk 2/10 · Minimal
- Chance of severe wind over 30 yrs
- —
Air-quality risk 1/10 · Minimal
- Unhealthy air days now
- 0 days/yr
- Unhealthy air days in 30 yrs
- 0 days/yr
Risk factors via First Street. Map © Google.
Why this score? — see what drove the B+ grade
The composite is a weighted blend of 9 inputs, each scored 0–100. Each bar is that input's sub-score; the figure is the points it added to the 100-point composite (weight × sub-score).
- Cash flow +30.0/30.0
- 1% rule +10.0/10.0
- DSCR +10.0/10.0
- Appreciation +10.0/10.0
- ARV discount +7.5/15.0
- Schools +4.3/10.0
- Livability +3.0/5.0
- Rent growth +2.5/5.0
- Condition / age +2.5/5.0
$41,999
🖨 Deal sheet (PDF) 📄 Offer letter ✓ Due diligence
Listing remarks
Here it is , a nicely updated 1 bedroom home, with that small town vibe. Main floor bathroom, with kitchen and open floor plan on main floor. Upstairs features 1 bedroom with an open space off the landing, that could be used as an office area. Cheaper than renting, you can own all of this at this amazing price. Get it before it is gone!!!!
Key facts
- Open floor plan
- Office area
- 5,967 sq ft lot
Tags
Property features AI
Finance
- Financial info: Mortgage type: Conventional; Other annual assessment amount listed (details not included here)
Exterior
- Parking: Detached or attached garage not specified, 1 garage space (14 x 20, approx. 280 sq ft)
- Utilities: City water (connected); Septic system compliant; Propane fuel; Electric service (provider listed)
- Home design: Residential property; One and one-half stories; Facing information not provided
- Construction: Frame construction; Metal roof; Foundation area approximately 512 (dimensions listed as 512); Built/constructed year not provided
- Exterior features: Rear porch; No fencing; City street frontage; Publicly maintained road
Interior
- Kitchen: Eat-in kitchen; Kitchen window
- Bedrooms: 1 bedroom (upper level)
- Bathrooms: 1 full bathroom (main level)
- Heating & cooling: Other heating; No central cooling
- Interior features: Gas water heater; Kitchen window; Main floor full bathroom; Eat-in kitchen; No basement
- Laundry & utility: Gas water heater
Neighborhood map
What this means for you Summary
Snapshot
- This is a 1-bed/1.0-bath single-family listed at $42k.
Deal economics
- At list price, monthly cash flow is $306 ($4k/yr) — positive.
- The deal already cash-flows at list — no discount required.
- Meets the 1% rule at list price ($775 rent vs $42k).
- Recommended offer: $37k (12.0% below list) — sets the bar for market timing.
Location & tenants
- Location reads 60/100 on livability (#760 in MN) — a middle-class / working-renter tenant base. Strengths: cost of living A+, housing A+; Watch: health & safety C-, crime D-, amenities F.
- Glenville-Emmons School District (rural): math 50% / reading 45% proficiency, ranked #305 of 467 in MN (top 65%) — families likely to look elsewhere, expect single-tenant / working-renter base with shorter leases.
- Zoned schools: Glenville Emmons Elementary (math 27% / reading 42%, grade F, #655 of 857 statewide, top 78%, 116 students, 48% FRL); Glenville-Emmons Secondary (math 24% / reading 24%, grade F, #383 of 471 statewide, top 88%, 98 students, 34% FRL) — zoned schools average 41% FRL vs 26% district-wide (16 pts higher); higher-poverty schools than district average — tighter screening recommended.
- Zoned-school proficiency averages 30% at this address vs 48% district-wide (-18 pts) — the specific schools serving this property underperform the Glenville-Emmons School District average; the district grade overstates school quality for this exact location.
- Market conditions: 13 active listings in the ZIP; 16 units permitted in Freeborn County in 2024 (0 in 5+ unit buildings).
Forward outlook
- In year one you build about $4k of equity ($290 loan paydown + $4k appreciation (10.0% local appreciation)).
- Freeborn County population projected at -11% by 2050 — secular population decline; favor cash flow + early exit over multi-decade hold.
- At projected returns (10.0% appreciation + 3.0% rent growth), your $12k cash investment doubles in ~2 years — after that, you're playing with house money.
- By year 7, paydown + projected appreciation supports a ~$32k cash-out refi (75% LTV) — recoverable capital for the next deal without selling this one.
Negotiation context
- It's been on market 544 days — a 12% lower offer ($37k) is reasonable based on typical stale-listing flexibility.
- 3 sale attempts since 2y ago; this cycle's ask has dropped $8k (16%) from the opening price — seller is motivated, your offer sets the floor, not the list.
- Current owner paid $17k; list at $42k implies a 147% gain — meaningful room to come down on a strong offer.
Risks & watch-outs
- Watch-outs: built in 1900 — expect roof / HVAC / electrical / plumbing capex.
Questions for the listing agent
- It's been on market 544 days. Have you received any prior offers? Is the seller open to a 12% concession, seller financing, or rate buy-down credit?
- Built in 1900 — when were the roof, HVAC, electrical panel, plumbing, and water heater last replaced?
- Why hasn't it sold? Are there any deal-killer items the seller is aware of (foundation, flood, title, zoning, code violations)?
- Is there a deadline driving the sale (1031 exchange, divorce, estate, relocation)? That informs how much negotiation room exists.
- Schools are F-rated, which usually means shorter tenancies and higher turnover. Who's the typical renter profile here, and what's been the actual vacancy rate?
- Crime grade is D in this area — have there been break-ins, vandalism, or insurance claims at this property in the last 3 years? What carrier currently insures it and at what premium?
- What's the average days-on-market for RENTAL listings here right now (not sales)? A rising rental-DOM trend means longer vacancies and softer asking-rent achievability than the comps imply.
- What's the recent tenant-quality profile in this submarket — average credit score on applications, eviction rate, late-payment / NSF rate, and stable-employment percentage? A property-management company in the area should have these aggregated.
- How much new for-sale + rental construction is in the pipeline within 1–3 miles? Heavy new supply typically softens prices + rents 12–24 months out; constrained supply supports both.
Investment metrics
- 1% rule
- 1.85% ✓
- Cap rate
- 15.03%
- Cash-on-cash
- 31.21%
- DSCR
- 2.39
- GRM
- 4.5
CMA / ARV
No comps found within radius.
Projected returns pro-forma
10.0% appreciation · 3.0% rent growth · sell at horizon
- IRR
- 48.1%
- Equity multiple
- 4.60×
- Total profit
- $42,378
- Equity at exit
- $37,836
- IRR
- 41.9%
- Equity multiple
- 10.31×
- Total profit
- $109,519
- Equity at exit
- $81,595
Cash invested: $11,760 (down + closing). Projections, not guarantees.
Landlord ↔ Tenant lean methodology
- Overall (STATE)
- 46 Balanced
- State Minnesota
- 46 Balanced · D+2
- County
- — inherits STATE
- City
- — inherits STATE
ZIP-level market 56036
- Home prices YoY
- 6.7%
- Active inventory
- 13
- Price-to-rent
- 4.5×
Monthly cashflow live
- Estimated rent
- $775 medium interval (Pro) →
- Mortgage (P&I)
- −$220
- Tax from tax record
- −$69 /mo · $824/yr
- Insurance
- −$17
- HOA
- −$0
- Vacancy / Maint / Mgmt
- −$163
- Net cashflow
- $306
Break-even live
Sensitivity live
| Price | -10% $330 | -5% $318 | +0% $306 | +5% $294 | +10% $282 |
|---|---|---|---|---|---|
| Rent | -10% $245 | -5% $275 | +0% $306 | +5% $337 | +10% $367 |
| Rate | -1.0pp $327 | -0.5pp $317 | base $306 | +0.5pp $295 | +1.0pp $284 |
UW: 25.0% down · 7.5% · 30yr · 1.5% tax · 5.0% vac · 8.0% maint · 8.0% mgmt
Financing live
Cash to close
- Down payment
- $10,500
- Closing costs
- $1,260
- Reserves months
- —
- Total cash needed
- —
Loan-product check · same deal, 3 products live
Conventional
25% down · 7.5% · 30yr
- Down + closing
- —
- Monthly P&I
- —
- Monthly cashflow
- —
- DSCR
- —
- Eligible?
- —
Personal DTI + credit; lowest rate.
DSCR
20% down · 8.5% · 30yr
- Down + closing
- —
- Monthly P&I
- —
- Monthly cashflow
- —
- DSCR
- —
- Eligible?
- —
No personal income docs; deal must DSCR.
Hard money
10% down · 12.0% · 12mo
- Down + closing
- —
- Monthly P&I
- —
- Monthly cashflow
- —
- DSCR
- —
- Eligible?
- —
Short-term bridge; refi at stabilization.
Listing history 11 events
-
2026-05-01status Pending
-
2026-03-28price $41,999
-
2025-10-07price $47,500
-
2025-10-02status Active
-
2025-10-01historical
-
2025-05-31price $48,500
-
2024-11-01$49,900 Active
-
2024-07-24historical
-
2024-07-22soldstatus $17,000
-
2024-06-05$24,900 Active
-
2023-10-15soldstatus $10,500
ⓘ Source: listings_history table (triggers on properties + properties_extension) + one-shot
backfill from property_details.listing_events for pre-trigger history.
Tax reassessment forecast MN · Partial reset (capped growth)
- Current annual tax
- $824 · $69/mo
- Projected year-2 tax
- $824 · $69/mo
- Expected delta
- $0/yr ($0/mo · 0.0%)
ⓘ Screening estimate from a state-policy table — verify with the county assessor before closing.
Climate risk First Street
- Flood 1/10 Low FEMA zone X (unshaded) · 0% chance over 30 yrs
- Wildfire 1/10 Low
- Heat 1/10 Low 7 d/yr ≥98°F today · 16 d/yr by 30 yrs out
- Wind 2/10 Low
- Air quality 1/10 Low 0 unhealthy d/yr today · 0 by 30 yrs out
Nearby sold comps map
Loading sold comps map…
Walkable amenities ~0.75 mi
Loading nearby amenities…
Taxation est. · year 1
- Rental income
- $9,301
- − Mortgage interest
- −$2,353
- − Property taxes
- −$824
- − Insurance
- −$210
- − Repairs & maintenance
- −$744
- − Management
- −$744
- − Depreciation
- −$1,222
- Taxable income
- $3,204
- Est. tax owed @ 24.0%
- −$769
- After-tax cash flow
- $2,902/yr
For passive investors: Depreciation is non-cash, so a rental often shows a tax loss while cash-flowing — sheltering income. Rental losses are passive: they offset passive income freely, and up to $25,000/yr can offset ordinary (W-2) income if you actively participate and your MAGI is under $100k (phasing out to $0 by $150k); unused losses carry forward. On sale, claimed depreciation is recaptured at up to 25%, and gains may owe capital-gains tax (a 1031 exchange can defer both). Figures are a year-1 estimate at your 24.0% rate — not tax advice; consult a CPA.
Schools (NCES district)
- District
- Glenville-Emmons School District
- NCES district ID
- 2700148
- Math proficiency
- 50% ▲ 20.00%
- Reading proficiency
- 45% ▲ 15.00%
- Median HH income
- $49,815
- Composite
- 42.83/100
- National rank
- #6740
- State rank
- #305 of 467 in MN
Livability — Myrtle
- Score
- 60/100
- State rank
- #760
- US rank
- #18783
Category grades
Schools grade is shown separately in the Schools card above.
Census & demographics
- Census place
- Myrtle, MN
- Population (ZIP)
- 1,766
Population outlook (Freeborn County) Hauer SSP2
- Today (2025)
- 29,680 people
- By 2030
- 29,038 · -2.2%
- By 2040
- 27,650 · -6.8%
- By 2050
- 26,387 · -11.1%
- By 2075
- 25,224 · -15.0%
- By 2100
- 23,842 · -19.7%
Race, ethnicity, and origin ACS 2023
- Neighborhood character
- Predominantly White (91%)
- Race & ethnicity
- White 91% Two or more races 5% Hispanic / Latino 3%
- Common ancestry
- Portuguese 38% Lithuanian 2% Scottish 1%
- Foreign-born
- 1%
- Languages at home
- 98% English-only · Russian/Polish/Slavic 1% Spanish 1%
Political lean MEDSL · Freeborn
- 2024 margin
- Strong R (+21.3) · D 38.7% · R 60.0% · Other 1.3%
- 2008→2024 swing
- -38.5pp toward R · 2008: 17.1pp · 2024: -21.3pp
- All cycles
- 2024: R+21.3 2020: R+16.0 2016: R+17.4 2012: D+14.2 2008: D+17.1
Not yet ingested
- Civics
- —
Market trends
- HPI YoY
- ▲ 16.32%
- Current HPI
- 259.8986
- Rent YoY
- —
- Metro
- —
- State GDP YoY
- ▲ 2.41%
- F500 in state
- 34
Industry mix (Fortune 500 HQ in MN)
| Industry | F500 HQs | Revenue |
|---|---|---|
| Healthcare | 2 | $407B |
|
||
| Retail | 2 | $150B |
|
||
| Consumer Goods | 2 | $32B |
|
||
| Industrial Machinery | 2 | $6B |
|
||
| Agriculture | 1 | $40B |
|
||
| Healthcare / Medical Devices | 1 | $32B |
|
||
Price history
+300.0% since first listed11 events — show timeline
- 2026-05-01 Pending — NORTHSTARMLS as Distributed by MLS Grid
- 2026-03-28 Price Changed $41,999 NORTHSTARMLS as Distributed by MLS Grid
- 2025-10-07 Price Changed $47,500 NORTHSTARMLS as Distributed by MLS Grid
- 2025-10-02 Relisted — NORTHSTARMLS as Distributed by MLS Grid
- 2025-10-01 Listing Removed — NORTHSTARMLS as Distributed by MLS Grid
- 2025-05-31 Price Changed $48,500 NORTHSTARMLS as Distributed by MLS Grid
- 2024-11-01 Listed $49,900 NORTHSTARMLS as Distributed by MLS Grid
- 2024-07-24 Listing Removed — NORTHSTARMLS as Distributed by MLS Grid
- 2024-07-22 Sold (Public Records) $17,000 Public Records
- 2024-06-05 Listed $24,900 NORTHSTARMLS as Distributed by MLS Grid
- 2023-10-15 Sold (Public Records) $10,500 Public Records
Property tax history
+22.3%/yrLatest (2025): $824 · -8.4% YoY. Source: county tax records.
Cash-flow waterfall
monthlySold comps — $/sqft
last 12 mo · ≤1 miLoading sold comps…