 🏗️ New Construction
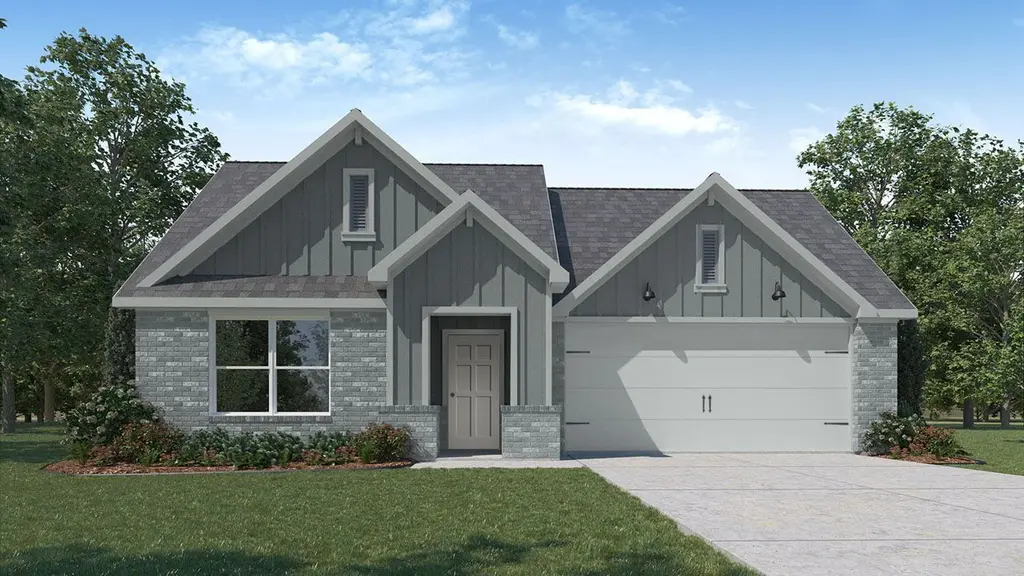
Seabrook Plan · Nolanville, TX
Flood risk 1/10 · Minimal
- FEMA flood zone
- X (unshaded)
- Chance of flooding over 30 yrs
- 0.0%
- Est. flood insurance / yr
- $507 – $1,088
Fire risk 5/10 · Moderate
- Est. fire insurance / yr
- $1,222 – $2,270
Heat risk 8/10 · Major
- Hot days now (above 107°F)
- 7 days/yr
- Hot days in 30 yrs
- 24 days/yr
Wind risk 6/10 · Moderate
- Chance of severe wind over 30 yrs
- 69.0%
Air-quality risk 2/10 · Minimal
- Unhealthy air days now
- 0 days/yr
- Unhealthy air days in 30 yrs
- 1 days/yr
Risk factors via First Street. Map © Google.
Why this score? — see what drove the F grade
The composite is a weighted blend of 9 inputs, each scored 0–100. Each bar is that input's sub-score; the figure is the points it added to the 100-point composite (weight × sub-score).
- ARV discount +7.5/15.0
- Cash flow +6.3/30.0
- Appreciation +5.0/10.0
- Condition / age +4.0/5.0
- Livability +3.7/5.0
- Schools +3.0/10.0
- Rent growth +2.5/5.0
- 1% rule +1.5/10.0
- DSCR +0.6/10.0
$283,990
🖨 Deal sheet (PDF) 📄 Offer letter ✓ Due diligence
Listing remarks
Introducing the Seabrook floorplan at Wildwood Estates in Nolanville, Texas, where every square foot is put-to-use with sophistication and comfort. You'll be calling the approximately 1,873 square foot, single-story, 2-car garage, and covered patio your new home. The 4-bedroom, 2-bathroom floorplan is perfect for you with the open concept living area. The kitchen, dining area, and living area creates a spacious environment. You'll find flat panel birch cabinetry and granite countertops. The kitchen includes a breakfast bar and an island with a built-in sink. The secondary bedrooms are cozy and carpeted, with plenty of closet space. The laundry room and a secondary bathroom are perfectly pla
Key facts
- Granite countertops
- Seabrook floorplan
- Breakfast bar
Tags
Property features AI
Finance
- Other: Address: Nolanville, TX (202 Morgans Cir)
- Financial info: List price $283,990
Exterior
- Parking: 2 total parking spaces; 2-car garage
- Home design: Single-family plan (Seabrook)
- Exterior features: Living area approximately 1,873
Interior
- Bedrooms: 4 bedrooms
- Bathrooms: 2 full bathrooms
- Interior features: New construction plan (Seabrook)
Neighborhood map
What this means for you Summary
Snapshot
- This is a 4-bed/2.0-bath single-family listed at $284k. Condition is rated good.
Deal economics
- At list price, monthly cash flow is $-577 ($-7k/yr) — negative.
- To cash-flow at today's rent, offer at most $244k (14.1% below list).
- To meet the 1% rule (rent ≥ 1% of price), the offer needs to be $213k (24.9% below list).
- Recommended offer: $213k (24.9% below list) — sets the bar for 1% rule.
- Cap rate 4.2% vs local median 3.5% in Nolanville — meaningfully above typical; check what's discounted (condition, days-on-market, listing class) to confirm the premium yield is real.
Location & tenants
- Location reads 74/100 on livability (#176 in TX, #4,655 nationally) — a middle-class / working-renter tenant base. Strengths: crime A+, cost of living A+, housing A+; Watch: amenities F, commute F.
- Killeen ISD (urban): math 31% / reading 38% proficiency, ranked #524 of 826 in TX (top 63%) — families likely to look elsewhere, expect single-tenant / working-renter base with shorter leases.
- Zoned schools: Richard E Cavazos El (math 43% / reading 46%, grade F, #1,155 of 4,322 statewide, top 29%, 607 students, 66% FRL); Rancier Middle (math 24% / reading 26%, grade F, #1,258 of 1,662 statewide, top 77%, 722 students, 81% FRL); Killeen H S (math 29% / reading 40%, grade F, #963 of 1,632 statewide, top 61%, 2,076 students, 69% FRL) — zoned schools average 72% FRL vs 47% district-wide (25 pts higher); higher-poverty schools than district average — tighter screening recommended.
- Market conditions: 239 active listings in the ZIP; 20 comparable units currently listed for rent nearby; rentals at typical pace (median 25d on market — plan ~3-4 weeks tenant-placement turnaround); 3,222 units permitted in Bell County in 2024 (246 in 5+ unit buildings).
Forward outlook
- In year one you build about $2k of equity ($2k loan paydown + $121 appreciation (0.0% local appreciation)).
- Bell County population projected at +21% by 2050 — long-run rental-demand tailwind backs the buy-and-hold thesis.
- By year 10, paydown + projected appreciation supports a ~$33k cash-out refi (75% LTV) — recoverable capital for the next deal without selling this one.
Negotiation context
- It's been on market 43 days — a 3% lower offer ($275k) is reasonable based on typical stale-listing flexibility.
Risks & watch-outs
- Climate carrying-cost: major wind risk, 69% chance of damaging wind over 30y; moderate wildfire risk; extreme-heat days projected 7→24/yr by 2055 (HVAC capex compounding) — expect insurance premiums to compound above CPI over the hold.
Questions for the listing agent
- What do current leases actually rent for vs. the listed asking? Can we see a recent rent roll and the last 12 months of T-12 income?
- It's been on market 43 days. Have you received any prior offers? Is the seller open to a 25% concession, seller financing, or rate buy-down credit?
- Is there a deadline driving the sale (1031 exchange, divorce, estate, relocation)? That informs how much negotiation room exists.
- Schools are D-rated, which usually means shorter tenancies and higher turnover. Who's the typical renter profile here, and what's been the actual vacancy rate?
- The area grade is low — what's the realistic commute time and amenity access for the typical tenant pool here? Any planned neighborhood developments (good or bad) we should know about?
- What's the average days-on-market for RENTAL listings here right now (not sales)? A rising rental-DOM trend means longer vacancies and softer asking-rent achievability than the comps imply.
- What's the recent tenant-quality profile in this submarket — average credit score on applications, eviction rate, late-payment / NSF rate, and stable-employment percentage? A property-management company in the area should have these aggregated.
- How much new for-sale + rental construction is in the pipeline within 1–3 miles? Heavy new supply typically softens prices + rents 12–24 months out; constrained supply supports both.
Investment metrics
- 1% rule
- 0.65% ✗
- Cap rate
- 4.18%
- Cash-on-cash
- -7.55%
- DSCR
- 0.66
- GRM
- 12.8
CMA / ARV
- ARV (median comp)
- $327,373
- List price
- $283,990
- Delta
- -13.25%
- Verdict
- UNDERPRICED
- Comps
- 12 within 1.0 mi
Show comp detail 4 sales within ~0.75 mi
| Address | Dist | Beds/Ba | Sqft | Sold | Price | $/sf | Match |
|---|---|---|---|---|---|---|---|
| 204 Sugar Maple Ct | 0.24mi | 4/2.0 | 1,978 (+6%) | 6mo | $315,000 | $159 | 75 |
| 905 N 1st St | 0.66mi | 4/2.0 | 1,921 (+3%) | 4mo | $453,000 | $236 | 62 |
| 106 Black Gum Ct | 0.34mi | 3/2.0 (-1) | 1,656 (-12%) | 7mo | $250,000 | $151 | 54 |
| 810 Freedom Cir | 0.41mi | 4/2.0 | 1,974 (+5%) | 21mo | $325,000 | $165 | 54 |
Match score weights: distance 35% · size 25% · config 20% · recency 20%. Top-matched comps best support the ARV.
Projected returns pro-forma
0.04% appreciation · 3.0% rent growth · sell at horizon
- IRR
- -10.7%
- Equity multiple
- 0.50×
- Total profit
- $-45,692
- Equity at exit
- $95,667
- IRR
- -4.4%
- Equity multiple
- 0.53×
- Total profit
- $-43,344
- Equity at exit
- $115,482
Cash invested: $91,664 (down + closing). Projections, not guarantees.
Landlord ↔ Tenant lean methodology
- Overall (STATE)
- 87 Strongly Landlord-Friendly
- State Texas
- 87 Strongly Landlord-Friendly · R+5
- County
- — inherits STATE
- City
- — inherits STATE
ZIP-level market 76559
- Home prices YoY
- 0.0%
- Active inventory
- 239
- Price-to-rent
- 11.1×
Monthly cashflow live
- Estimated rent
- $2,134 high interval (Pro) →
- Mortgage (P&I)
- −$1,717
- Tax est. 1.5%
- −$409 /mo · $4,911/yr
- Insurance
- −$136
- HOA
- −$0
- Vacancy / Maint / Mgmt
- −$448
- Net cashflow
- $-577
Break-even live
Sensitivity live
| Price | -10% $-350 | -5% $-463 | +0% $-577 | +5% $-690 | +10% $-803 |
|---|---|---|---|---|---|
| Rent | -10% $-745 | -5% $-661 | +0% $-577 | +5% $-492 | +10% $-408 |
| Rate | -1.0pp $-412 | -0.5pp $-493 | base $-577 | +0.5pp $-661 | +1.0pp $-748 |
UW: 25.0% down · 7.5% · 30yr · 1.5% tax · 5.0% vac · 8.0% maint · 8.0% mgmt
Financing live
Cash to close
- Down payment
- $81,843
- Closing costs
- $9,821
- Reserves months
- —
- Total cash needed
- —
Loan-product check · same deal, 3 products live
Conventional
25% down · 7.5% · 30yr
- Down + closing
- —
- Monthly P&I
- —
- Monthly cashflow
- —
- DSCR
- —
- Eligible?
- —
Personal DTI + credit; lowest rate.
DSCR
20% down · 8.5% · 30yr
- Down + closing
- —
- Monthly P&I
- —
- Monthly cashflow
- —
- DSCR
- —
- Eligible?
- —
No personal income docs; deal must DSCR.
Hard money
10% down · 12.0% · 12mo
- Down + closing
- —
- Monthly P&I
- —
- Monthly cashflow
- —
- DSCR
- —
- Eligible?
- —
Short-term bridge; refi at stabilization.
Rent comps 20 comps
| Address | Beds | Baths | Sqft | Rent | $/sqft | DOM | Units | Dist |
|---|---|---|---|---|---|---|---|---|
| 217 Slippery Elm Dr Nolanville, TX | 4.0 | 2.5 | 2076 | $2,250 | $1.08 | 15d | 1 | 0.21mi |
| 854 Freedom Cir Nolanville, TX | 4.0 | 3.0 | 2012 | $1,901 | $0.94 | 45d | 1 | 0.39mi |
| 810 Freedom Cir Nolanville, TX | 4.0 | 2.0 | 1974 | $3,895 | $1.97 | 15d | 1 | 0.40mi |
| 870 Freedom Cir Nolanville, TX | 4.0 | 3.0 | 2191 | $2,223 | $1.01 | 23d | 1 | 0.40mi |
| 853 Freedom Cir Nolanville, TX | 4.0 | 3.0 | 2012 | $2,073 | $1.03 | 15d | 1 | 0.43mi |
| 605 Old Glory Rd Nolanville, TX | 4.0 | 3.0 | 2012 | $2,073 | $1.03 | 25d | 1 | 0.43mi |
| 408 W St John Ave Apt A Nolanville, TX | 3.0 | 2.0 | 1250 | $1,100 | $0.88 | 45d | 1 | 0.47mi |
| 202 East Avenue H Unit H Nolanville, TX | 3.0 | 2.0 | 1384 | $1,550 | $1.12 | 25d | 1 | 0.88mi |
| 310 10th St Unit B Nolanville, TX | 3.0 | 2.0 | 1281 | $1,095 | $0.85 | 45d | 1 | 1.04mi |
| 406 Diana Ln Harker Heights, TX | 4.0 | 2.0 | 1617 | $1,600 | $0.99 | 45d | 1 | 1.09mi |
| 308 Cedar Ridge Dr Unit A Nolanville, TX | 3.0 | 2.0 | 2562 | $1,050 | $0.41 | 15d | 1 | 1.09mi |
| 1602 Old Nolanville Rd Unit B Nolanville, TX | 3.0 | 2.0 | 1276 | $1,350 | $1.06 | 25d | 1 | 1.17mi |
| 1806 Iron Jacket Trl Harker Heights, TX | 4.0 | 2.0 | 2178 | $2,345 | $1.08 | 25d | 1 | 1.21mi |
| 1804 Iron Jacket Trl Harker Heights, TX | 4.0 | 3.0 | 2587 | $2,395 | $0.93 | 45d | 1 | 1.21mi |
| 2003 Renea Cir Harker Heights, TX | 5.0 | 2.5 | 1985 | $2,200 | $1.11 | 25d | 1 | 1.25mi |
| 1805 Diana Ln Harker Heights, TX | 4.0 | 2.0 | 1732 | $1,595 | $0.92 | 45d | 1 | 1.28mi |
| 7026 Chimney Hill Dr Nolanville, TX | 4.0 | 2.5 | 2041 | $2,200 | $1.08 | 25d | 1 | 1.29mi |
| 106 Cedar Ridge Dr Nolanville, TX | 4.0 | 2.0 | 1807 | $1,695 | $0.94 | 15d | 1 | 1.30mi |
| 707 End O Trl Harker Heights, TX | 3.0 | 2.0 | 1508 | $1,850 | $1.23 | 15d | 1 | 1.34mi |
| 1901 Horatio St Nolanville, TX | 3.0 | 2.0 | 1945 | $2,050 | $1.05 | 25d | 1 | 1.48mi |
Listing history 17 events
-
2026-06-22days on market $283,990 Active 43 DOM
-
2026-06-18days on market $283,990 Active 40 DOM
-
2026-06-17days on market $283,990 Active 39 DOM
-
2026-06-16days on market $283,990 Active 38 DOM
-
2026-06-15days on market $283,990 Active 37 DOM
-
2026-06-14days on market $283,990 Active 35 DOM
-
2026-06-13days on market $283,990 Active 34 DOM
-
2026-06-10days on market $283,990 Active 32 DOM
-
2026-06-09days on market $283,990 Active 31 DOM
-
2026-06-08days on market $283,990 Active 30 DOM
-
2026-06-07days on market $283,990 Active 29 DOM
-
2026-06-03days on market $283,990 Active 25 DOM
-
2026-06-02days on market $283,990 Active 24 DOM
-
2026-06-01days on market $283,990 Active 23 DOM
-
2026-05-31days on market $283,990 Active 22 DOM
-
2026-05-30days on market $283,990 Active 21 DOM
-
2026-05-09$283,990 Active 1072-char remark
ⓘ Source: listings_history table (triggers on properties + properties_extension) + one-shot
backfill from property_details.listing_events for pre-trigger history.
Climate risk First Street
- Flood 1/10 Low FEMA zone X (unshaded) · 0% chance over 30 yrs
- Wildfire 5/10 Major
- Heat 8/10 Severe 7 d/yr ≥107°F today · 24 d/yr by 30 yrs out
- Wind 6/10 Major 69% chance of damaging wind over 30 yrs
- Air quality 2/10 Low 0 unhealthy d/yr today · 1 by 30 yrs out
Nearby sold comps map
Loading sold comps map…
Walkable amenities ~0.75 mi
Loading nearby amenities…
Taxation est. · year 1
- Rental income
- $25,608
- − Mortgage interest
- −$18,338
- − Property taxes
- −$4,911
- − Insurance
- −$1,637
- − Repairs & maintenance
- −$2,049
- − Management
- −$2,049
- − Depreciation
- −$9,524
- Taxable loss
- −$12,898
- Est. tax savings @ 24.0%
- +$3,096
- After-tax cash flow
- $-3,823/yr
For passive investors: Depreciation is non-cash, so a rental often shows a tax loss while cash-flowing — sheltering income. Rental losses are passive: they offset passive income freely, and up to $25,000/yr can offset ordinary (W-2) income if you actively participate and your MAGI is under $100k (phasing out to $0 by $150k); unused losses carry forward. On sale, claimed depreciation is recaptured at up to 25%, and gains may owe capital-gains tax (a 1031 exchange can defer both). Figures are a year-1 estimate at your 24.0% rate — not tax advice; consult a CPA.
Condition & rehab AI · 1 photo
The home is in good condition with minor cosmetic updates needed to enhance its resale and rental value.
Value-add opportunities
- Both Paint the interior walls — Fresh paint can enhance the home's curb appeal and interior aesthetics.
- Both Replace the carpet in the secondary bedrooms — Modern flooring can significantly improve the home's resale and rental value.
- Resale Install new kitchen backsplash — A new backsplash can modernize the kitchen and add value.
- Resale Install new bathroom fixtures — Upgraded fixtures can enhance the bathrooms and add value.
- Both Landscaping improvements — Enhanced landscaping can improve curb appeal and add value to the property.
Renovation cost estimate screening
Value-add ROI direction
- Both Paint the interior walls — Fresh paint can enhance the home's curb appeal and interior aesthetics. ↑
- Both Replace the carpet in the secondary bedrooms — Modern flooring can significantly improve the home's resale and rental value. ↑
- Resale Install new kitchen backsplash — A new backsplash can modernize the kitchen and add value. ↑
- Resale Install new bathroom fixtures — Upgraded fixtures can enhance the bathrooms and add value. ↑
- Both Landscaping improvements — Enhanced landscaping can improve curb appeal and add value to the property. ↑
ⓘ Cost ranges are severity-bucket heuristics (US national rule-of-thumb). Get contractor quotes + a written scope before underwriting a rehab budget.
Schools (NCES district)
- District
- Killeen ISD
- NCES district ID
- 4825660
- Math proficiency
- 31% ▼ -16.00%
- Reading proficiency
- 38% ▼ -3.00%
- Median HH income
- $47,665
- Composite
- 29.69/100
- National rank
- #6458
- State rank
- #524 of 826 in TX
Livability — Nolanville
- Score
- 74/100
- State rank
- #176
- US rank
- #4655
Category grades
Schools grade is shown separately in the Schools card above.
Census & demographics
- Census place
- Nolanville, TX
- City population
- 6,896
- Population (ZIP)
- 6,896
Population outlook (Bell County) Hauer SSP2
- Today (2025)
- 371,114 people
- By 2030
- 389,104 · +4.8%
- By 2040
- 420,592 · +13.3%
- By 2050
- 447,779 · +20.7%
- By 2075
- 499,130 · +34.5%
- By 2100
- 505,680 · +36.3%
Race, ethnicity, and origin ACS 2023
- Neighborhood character
- Diverse neighborhood (Simpson 0.65)
- Race & ethnicity
- White 52% Hispanic / Latino 20% Black 20% Two or more races 6% Asian 5% Pacific Islander 2%
- Hispanic origin (detail)
- Mexican 16% Puerto Rican 1%
- Common ancestry
- Italian 2% Lithuanian 1% Danish 1%
- Foreign-born
- 8% · Canada, Vietnam, South Korea
- Languages at home
- 88% English-only · Spanish 9% Other Indo-European 1% Korean 1%
Political lean MEDSL · Bell
- 2024 margin
- R (+16.2) · D 41.3% · R 57.6% · Other 1.1%
- 2008→2024 swing
- -6.5pp toward R · 2008: -9.8pp · 2024: -16.2pp
- All cycles
- 2024: R+16.2 2020: R+8.5 2016: R+15.1 2012: R+16.4 2008: R+9.8
Not yet ingested
- Civics
- —
Market trends
- HPI YoY
- ▬ 0.04%
- Current HPI
- 170.1375
- Rent YoY
- —
- Metro
- —
- State GDP YoY
- ▲ 3.95%
- F500 in state
- 110
Industry mix (Fortune 500 HQ in TX)
| Industry | F500 HQs | Revenue |
|---|---|---|
| Energy | 16 | $1,198B |
|
||
| Technology | 5 | $198B |
|
||
| Engineering / Construction | 4 | $72B |
|
||
| Energy Services | 3 | $60B |
|
||
| Utilities | 3 | $41B |
|
||
| Healthcare | 2 | $330B |
|
||
Cash-flow waterfall
monthlySold comps — $/sqft
last 12 mo · ≤1 miLoading sold comps…