 🏗️ New Construction
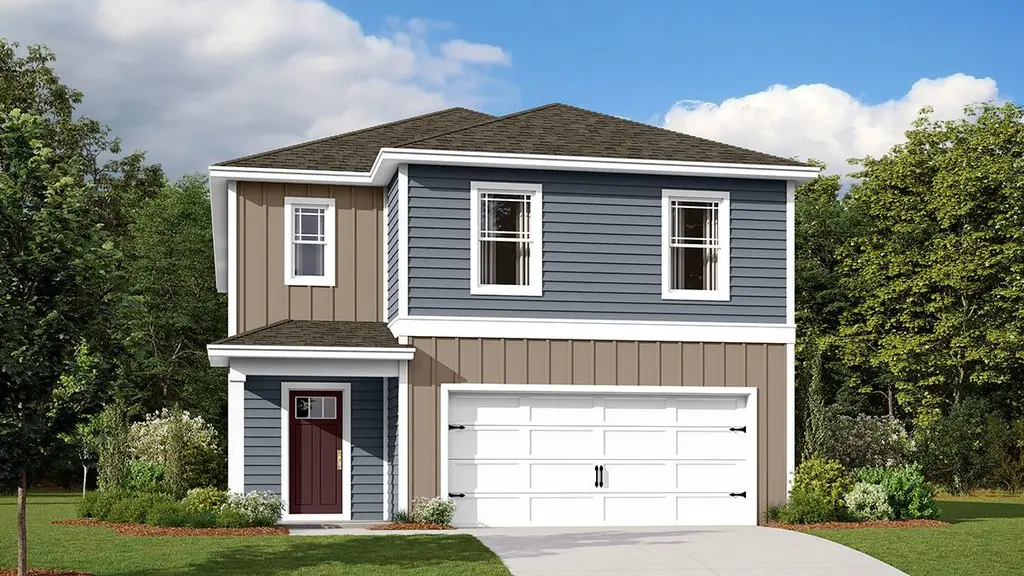
ELM Plan · Millville, DE
Flood risk No data
- FEMA flood zone
- —
- Chance of flooding over 30 yrs
- —
- Est. flood insurance / yr
- —
Fire risk No data
- Est. fire insurance / yr
- —
Heat risk No data
- Hot days now (above threshold)
- —
- Hot days in 30 yrs
- —
Wind risk No data
- Chance of severe wind over 30 yrs
- —
Air-quality risk No data
- Unhealthy air days now
- —
- Unhealthy air days in 30 yrs
- —
Risk factors via First Street. Map © Google.
Why this score? — see what drove the F grade
The composite is a weighted blend of 9 inputs, each scored 0–100. Each bar is that input's sub-score; the figure is the points it added to the 100-point composite (weight × sub-score).
- Appreciation +10.0/10.0
- ARV discount +7.5/15.0
- Livability +3.2/5.0
- Schools +2.9/10.0
- Rent growth +2.5/5.0
- Condition / age +2.5/5.0
- Cash flow +0.0/30.0
- 1% rule +0.0/10.0
- DSCR +0.0/10.0
$422,990
🖨 Deal sheet 📄 Offer letter ✓ Due diligence
Listing remarks
The Elm, a contemporary 2,415 square feet two-story home, features five bedrooms, three bathrooms, a loft and a two-car garage. As you step into the home's distinct foyer you will notice that the stairs are separated from the main living space. Continuing into the home, the open-concept floorplan comes to life as you take in the kitchen, dining area and living room. The spacious kitchen showcases an abundance of cabinetry and counter space, an ample walk-in pantry, a large island with sink and additional room for seating and stainless-steel appliances. The kitchen has an eat-in dining space that flows perfectly into the sizeable living room. A coat closet is tucked away near the entrance of
Key facts
- 2 garage spots
- Listed 2 days
Property features AI
Finance
- Other: Address: Frankford, DE 19945
- Financial info: List price $422,990
Exterior
- Parking: 2 garage spaces; 2 total parking spaces
- Home design: New construction plan; Single-family property (ELM plan)
- Exterior features: Living area approximately 2415
Interior
- Bedrooms: 5 bedrooms
- Bathrooms: 3 full bathrooms
- Interior features: Plan model named ELM
Neighborhood map
What this means for you Summary
Snapshot
- This is a 5-bed/3.0-bath single-family listed at $423k.
Deal economics
- At list price, monthly cash flow is $-4k ($-48k/yr) — negative.
- To cash-flow at today's rent, offer at most $259k (38.7% below list).
- To meet the 1% rule (rent ≥ 1% of price), the offer needs to be $227k (46.3% below list).
- Recommended offer: $227k (46.3% below list) — sets the bar for 1% rule.
- Cap rate 0.6% vs local median 2.4% in Millville — below-typical yield; the buyer is paying a premium for something (appreciation thesis, condition, location) that the cap rate doesn't capture.
Location & tenants
- Location reads 64/100 on livability (#49 in DE) — a middle-class / working-renter tenant base. Strengths: crime A+, employment A, housing A; Watch: schools F, amenities F, commute F.
- Indian River School District (rural): math 25% / reading 41% proficiency, ranked #14 of 26 in DE (top 54%) — families likely to look elsewhere, expect single-tenant / working-renter base with shorter leases.
- Market conditions: 281 active listings in the ZIP; 4,354 units permitted in Sussex County in 2024 (344 in 5+ unit buildings).
Forward outlook
- In year one you build about $89k of equity ($6k loan paydown + $83k appreciation (10.0% local appreciation)).
- Sussex County population projected at +25% by 2050 — long-run rental-demand tailwind backs the buy-and-hold thesis.
- By year 2, paydown + projected appreciation supports a ~$143k cash-out refi (75% LTV) — recoverable capital for the next deal without selling this one.
Negotiation context
- Only 2 days on market — expect competitive offers; lowballing is unlikely to land.
Risks & watch-outs
- Watch-outs: property tax is 3.0% of price.
Questions for the listing agent
- What do current leases actually rent for vs. the listed asking? Can we see a recent rent roll and the last 12 months of T-12 income?
- Property tax is high relative to price — has the assessment been appealed recently, and will the sale trigger a re-assessment?
- Is there a deadline driving the sale (1031 exchange, divorce, estate, relocation)? That informs how much negotiation room exists.
- Schools are F-rated, which usually means shorter tenancies and higher turnover. Who's the typical renter profile here, and what's been the actual vacancy rate?
- The area grade is low — what's the realistic commute time and amenity access for the typical tenant pool here? Any planned neighborhood developments (good or bad) we should know about?
- What's the average days-on-market for RENTAL listings here right now (not sales)? A rising rental-DOM trend means longer vacancies and softer asking-rent achievability than the comps imply.
- What's the recent tenant-quality profile in this submarket — average credit score on applications, eviction rate, late-payment / NSF rate, and stable-employment percentage? A property-management company in the area should have these aggregated.
- How much new for-sale + rental construction is in the pipeline within 1–3 miles? Heavy new supply typically softens prices + rents 12–24 months out; constrained supply supports both.
Investment metrics
- 1% rule
- 0.27% ✗
- Cap rate
- 0.58%
- Cash-on-cash
- -20.41%
- DSCR
- 0.09
- GRM
- 30.6
CMA / ARV
- ARV (median comp)
- $834,273
- List price
- $422,990
- Delta
- -49.30%
- Verdict
- UNDERPRICED
- Comps
- 3 within 1.0 mi
Show comp detail 1 sale within ~0.75 mi
| Address | Dist | Beds/Ba | Sqft | Sold | Price | $/sf | Match |
|---|---|---|---|---|---|---|---|
| 24003 Pembroke Ln | 0.64mi | 4/2.5 (-1) | 2,272 (-6%) | 21mo | $530,000 | $233 | 36 |
Match score weights: distance 35% · size 25% · config 20% · recency 20%. Top-matched comps best support the ARV.
Projected returns pro-forma
10.0% appreciation · 3.0% rent growth · sell at horizon
- IRR
- 10.3%
- Equity multiple
- 1.86×
- Total profit
- $201,400
- Equity at exit
- $751,580
- IRR
- 11.5%
- Equity multiple
- 4.39×
- Total profit
- $792,116
- Equity at exit
- $1,620,810
Cash invested: $233,597 (down + closing). Projections, not guarantees.
Landlord ↔ Tenant lean methodology
- Overall (STATE)
- 70 Landlord-Friendly
- State Delaware
- 70 Landlord-Friendly · D+7
- County
- — inherits STATE
- City
- — inherits STATE
ZIP-level market 19945
- Home prices YoY
- 16.9%
- Active inventory
- 281
- Price-to-rent
- 15.5×
Monthly cashflow live
- Estimated rent
- $2,270 medium interval (Pro) →
- Mortgage (P&I)
- −$4,375
- Tax est. 1.5%
- −$1,043 /mo · $12,514/yr
- Insurance
- −$348
- HOA
- −$0
- Vacancy / Maint / Mgmt
- −$477
- Net cashflow
- $-3,972
Break-even live
UW: 25.0% down · 7.5% · 30yr · 1.5% tax · 5.0% vac · 8.0% maint · 8.0% mgmt
Financing live
Cash to close
- Down payment
- $208,568
- Closing costs
- $25,028
- Reserves months
- —
- Total cash needed
- —
Loan-product check · same deal, 3 products live
Conventional
25% down · 7.5% · 30yr
- Down + closing
- —
- Monthly P&I
- —
- Monthly cashflow
- —
- DSCR
- —
- Eligible?
- —
Personal DTI + credit; lowest rate.
DSCR
20% down · 8.5% · 30yr
- Down + closing
- —
- Monthly P&I
- —
- Monthly cashflow
- —
- DSCR
- —
- Eligible?
- —
No personal income docs; deal must DSCR.
Hard money
10% down · 12.0% · 12mo
- Down + closing
- —
- Monthly P&I
- —
- Monthly cashflow
- —
- DSCR
- —
- Eligible?
- —
Short-term bridge; refi at stabilization.
Listing history 15 events
-
2026-06-18days on market $422,990 Active 2 DOM
-
2026-06-16days on market $422,990 Active 1 DOM
-
2026-06-16days on market $422,990 Active 89 DOM
-
2026-06-15days on market $422,990 Active 88 DOM
-
2026-06-14days on market $422,990 Active 86 DOM
-
2026-06-13days on market $422,990 Active 85 DOM
-
2026-06-10days on market $422,990 Active 83 DOM
-
2026-06-09days on market $422,990 Active 82 DOM
-
2026-06-08days on market $422,990 Active 81 DOM
-
2026-06-07days on market $422,990 Active 80 DOM
-
2026-06-02days on market $422,990 Active 75 DOM
-
2026-06-01days on market $422,990 Active 74 DOM
-
2026-05-31days on market $422,990 Active 73 DOM
-
2026-05-30days on market $422,990 Active 72 DOM
-
2026-03-20$422,990 Active 1489-char remark
ⓘ Source: listings_history table (triggers on properties + properties_extension) + one-shot
backfill from property_details.listing_events for pre-trigger history.
Nearby sold comps map
Loading sold comps map…
Walkable amenities ~0.75 mi
Loading nearby amenities…
Taxation est. · year 1
- Rental income
- $27,237
- − Mortgage interest
- −$46,732
- − Property taxes
- −$12,514
- − Insurance
- −$4,171
- − Repairs & maintenance
- −$2,179
- − Management
- −$2,179
- − Depreciation
- −$24,270
- Taxable loss
- −$64,808
- Est. tax savings @ 24.0%
- +$15,554
- After-tax cash flow
- $-32,114/yr
For passive investors: Depreciation is non-cash, so a rental often shows a tax loss while cash-flowing — sheltering income. Rental losses are passive: they offset passive income freely, and up to $25,000/yr can offset ordinary (W-2) income if you actively participate and your MAGI is under $100k (phasing out to $0 by $150k); unused losses carry forward. On sale, claimed depreciation is recaptured at up to 25%, and gains may owe capital-gains tax (a 1031 exchange can defer both). Figures are a year-1 estimate at your 24.0% rate — not tax advice; consult a CPA.
Schools (NCES district)
- District
- Indian River School District
- NCES district ID
- 1000680
- Math proficiency
- 25% ▼ -27.00%
- Reading proficiency
- 41% ▼ -17.00%
- Median HH income
- $53,838
- Composite
- 28.99/100
- National rank
- #6620
- State rank
- #14 of 26 in DE
Livability — Millville
- Score
- 64/100
- State rank
- #49
- US rank
- #13839
Category grades
Schools grade is shown separately in the Schools card above.
Census & demographics
- Census place
- Millville, DE
- City population
- 2,093
- Population (ZIP)
- 8,917
Population outlook (Sussex County) Hauer SSP2
- Today (2025)
- 248,853 people
- By 2030
- 264,464 · +6.3%
- By 2040
- 290,980 · +16.9%
- By 2050
- 311,259 · +25.1%
- By 2075
- 352,488 · +41.6%
- By 2100
- 367,406 · +47.6%
Race, ethnicity, and origin ACS 2023
- Neighborhood character
- Predominantly White (77%)
- Race & ethnicity
- White 77% Black 12% Hispanic / Latino 8% Two or more races 7%
- Hispanic origin (detail)
- Mexican 4%
- Common ancestry
- Romanian 3% Slovak 3% Lithuanian 1%
- Foreign-born
- 5% · Canada
- Languages at home
- 91% English-only · Spanish 8%
Political lean MEDSL · Sussex
- 2024 margin
- R (+11.0) · D 43.9% · R 54.9% · Other 1.2%
- 2008→2024 swing
- -2.4pp toward R · 2008: -8.6pp · 2024: -11.0pp
- All cycles
- 2024: R+11.0 2020: R+11.2 2016: R+22.0 2012: R+13.0 2008: R+8.6
Not yet ingested
- Civics
- —
Market trends
- HPI YoY
- ▲ 46.51%
- Current HPI
- 322.2407
- Rent YoY
- —
- Metro
- —
- State GDP YoY
- —
- F500 in state
- 0
Cash-flow waterfall
monthlySold comps — $/sqft
last 12 mo · ≤1 miLoading sold comps…