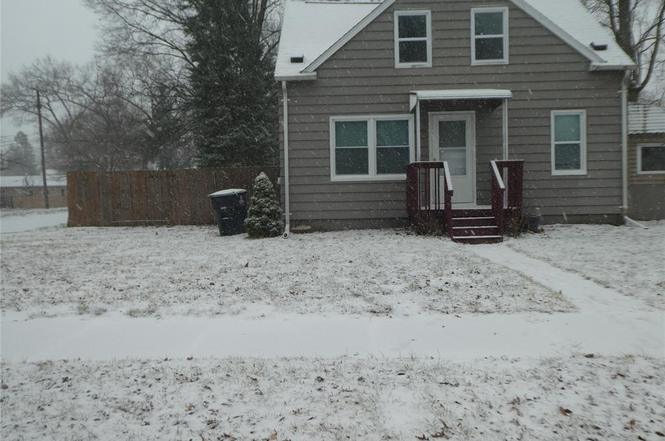
35209 Sheridan St · Westland, MI
Flood risk 1/10 · Minimal
- FEMA flood zone
- X (unshaded)
- Chance of flooding over 30 yrs
- 0.0%
- Est. flood insurance / yr
- $507 – $1,088
Fire risk 1/10 · Minimal
- Est. fire insurance / yr
- $784 – $1,456
Heat risk 3/10 · Minor
- Hot days now (above 97°F)
- 7 days/yr
- Hot days in 30 yrs
- 14 days/yr
Wind risk 2/10 · Minimal
- Chance of severe wind over 30 yrs
- —
Air-quality risk 2/10 · Minimal
- Unhealthy air days now
- 1 days/yr
- Unhealthy air days in 30 yrs
- 3 days/yr
Risk factors via First Street. Map © Google.
Why this score? — see what drove the C+ grade
The composite is a weighted blend of 9 inputs, each scored 0–100. Each bar is that input's sub-score; the figure is the points it added to the 100-point composite (weight × sub-score).
- Cash flow +24.5/30.0
- ARV discount +15.0/15.0
- DSCR +7.9/10.0
- 1% rule +6.1/10.0
- Livability +3.9/5.0
- Rent growth +2.5/5.0
- Condition / age +2.5/5.0
- Schools +1.6/10.0
- Appreciation +0.0/10.0
$129,999
🖨 Deal sheet 📄 Offer letter ✓ Due diligence
Listing remarks MLS
Attention investors, This property is perfect to work. Being sold as is condition. 3 bedroom house. Freshly painted and has newer carpet inside. Fully fenced backyard with privacy fence. This home is perfect for new investors or any buyer looking for a great home in westland. Buyers agent to verify all information. Buyer is resposnible for certificate of occupancy. Buyer is responsible for C of O. House is Winter resistant. Do not run the water while showing.
Key facts
- Privacy fence
- 8,712 sq ft lot
- Built 1946
Tags
Neighborhood map
What this means for you Summary
Snapshot
- This is a 3-bed/1.0-bath single-family listed at $130k.
Deal economics
- At list price, monthly cash flow is $265 ($3k/yr) — positive.
- The deal already cash-flows at list — no discount required.
- Meets the 1% rule at list price ($1k rent vs $130k).
- Recommended offer: $126k (3.0% below list) — sets the bar for market timing.
- Cap rate 8.7% vs local median 4.5% in Westland — top-decile yield for the area; either an underpriced asset or a hidden risk that comps aren't pricing in. Stress-test before assuming the spread holds.
Location & tenants
- Location reads 77/100 on livability (#124 in MI, #3,067 nationally) — a middle-class / working-renter tenant base. Strengths: commute A+, cost of living A+, housing A+; Watch: amenities C-, employment C-, crime D+.
- Wayne-Westland Community School District (suburban): math 11% / reading 27% proficiency, ranked #474 of 540 in MI (top 88%) — low school quality limits family demand, transient renter base, plan for 1-2y turnover.
- Market conditions: Rents flat; 161 active listings in the ZIP; 11 comparable units currently listed for rent nearby; rentals leasing fast (median 5d on market — plan ~1-2 weeks tenant-placement turnaround); 2,639 units permitted in Wayne County in 2024 (1,216 in 5+ unit buildings).
Forward outlook
- Local home prices are declining (-3.0%/yr); year-one equity from $899 of loan paydown is wiped out by about $4k of value loss. Plan a longer hold.
- Wayne County population projected at -17% by 2050 — secular population decline; favor cash flow + early exit over multi-decade hold.
Negotiation context
- It's been on market 32 days — a 3% lower offer ($126k) is reasonable based on typical stale-listing flexibility.
- 13 sale attempts since 10y ago; this cycle's ask has dropped $10k (7%) from the opening price — seller is motivated, your offer sets the floor, not the list.
- Current owner paid $76k; list at $130k implies a 71% gain — meaningful room to come down on a strong offer.
Risks & watch-outs
- Watch-outs: built in 1946 — expect roof / HVAC / electrical / plumbing capex.
Questions for the listing agent
- It's been on market 32 days. Have you received any prior offers? Is the seller open to a 3% concession, seller financing, or rate buy-down credit?
- Built in 1946 — when were the roof, HVAC, electrical panel, plumbing, and water heater last replaced?
- Is there a deadline driving the sale (1031 exchange, divorce, estate, relocation)? That informs how much negotiation room exists.
- Schools are D-rated, which usually means shorter tenancies and higher turnover. Who's the typical renter profile here, and what's been the actual vacancy rate?
- Crime grade is D in this area — have there been break-ins, vandalism, or insurance claims at this property in the last 3 years? What carrier currently insures it and at what premium?
- What's the average days-on-market for RENTAL listings here right now (not sales)? A rising rental-DOM trend means longer vacancies and softer asking-rent achievability than the comps imply.
- What's the recent tenant-quality profile in this submarket — average credit score on applications, eviction rate, late-payment / NSF rate, and stable-employment percentage? A property-management company in the area should have these aggregated.
- How much new for-sale + rental construction is in the pipeline within 1–3 miles? Heavy new supply typically softens prices + rents 12–24 months out; constrained supply supports both.
Investment metrics
- 1% rule
- 1.11% ✓
- Cap rate
- 8.74%
- Cash-on-cash
- 8.75%
- DSCR
- 1.39
- GRM
- 7.5
CMA / ARV
- ARV (on-the-fly)
- $165,594
- Comps found
- 12
Show comp detail 12 sales within ~0.75 mi
| Address | Dist | Beds/Ba | Sqft | Sold | Price | $/sf | Match |
|---|---|---|---|---|---|---|---|
| 34330 Florence Ave | 0.44mi | 3/1.0 | 907 (+6%) | 1mo | $179,000 | $197 | 69 |
| 35232 College St | 0.23mi | 3/1.5 | 936 (+9%) | 10mo | $160,000 | $171 | 64 |
| 144 N Karle St | 0.44mi | 3/1.0 | 906 (+6%) | 12mo | $171,000 | $189 | 60 |
| 125 N Parent St | 0.41mi | 2/1.0 (-1) | 952 (+11%) | 1mo | $129,900 | $136 | 56 |
| 35227 John Hauk St St | 0.50mi | 2/1.0 (-1) | 912 (+6%) | 9mo | $160,000 | $175 | 54 |
| 980 Radcliff St | 0.70mi | 3/1.0 | 900 (+5%) | 7mo | $180,000 | $200 | 53 |
| 34215 Florence St | 0.51mi | 3/2.0 | 907 (+6%) | 12mo | $210,500 | $232 | 52 |
| 322 N Hawthorne St | 0.61mi | 3/1.0 | 911 (+6%) | 12mo | $225,000 | $247 | 51 |
| 34315 Sheridan St | 0.44mi | 3/2.0 | 981 (+14%) | 1mo | $189,200 | $193 | 51 |
| 34942 Donnelly St | 0.49mi | 3/1.0 | 936 (+9%) | 23mo | $153,000 | $163 | 43 |
| 923 Van Sull Ave | 0.60mi | 3/1.0 | 971 (+13%) | 14mo | $221,500 | $228 | 39 |
| 35758 Somerset St | 0.61mi | 3/1.0 | 980 (+14%) | 20mo | $185,000 | $189 | 31 |
Match score weights: distance 35% · size 25% · config 20% · recency 20%. Top-matched comps best support the ARV.
Projected returns pro-forma
-3.0% appreciation · 0.17% rent growth · sell at horizon
- IRR
- -6.2%
- Equity multiple
- 0.78×
- Total profit
- $-8,162
- Equity at exit
- $19,383
- IRR
- -0.4%
- Equity multiple
- 0.98×
- Total profit
- $-832
- Equity at exit
- $11,240
Cash invested: $36,400 (down + closing). Projections, not guarantees.
Landlord ↔ Tenant lean methodology
- Overall (STATE)
- 62 Landlord-Friendly
- State Michigan
- 62 Landlord-Friendly · EVEN
- County
- — inherits STATE
- City
- — inherits STATE
ZIP-level market 48185
- Rents YoY
- 0.2%
- Active inventory
- 161
- Price-to-rent
- 7.5×
Monthly cashflow live
- Estimated rent
- $1,445 high interval (Pro) →
- Mortgage (P&I)
- −$682
- Tax from tax record
- −$140 /mo · $1,683/yr
- Insurance
- −$54
- HOA
- −$0
- Vacancy / Maint / Mgmt
- −$303
- Net cashflow
- $265
Break-even live
UW: 25.0% down · 7.5% · 30yr · 1.5% tax · 5.0% vac · 8.0% maint · 8.0% mgmt
Financing live
Cash to close
- Down payment
- $32,500
- Closing costs
- $3,900
- Reserves months
- —
- Total cash needed
- —
Loan-product check · same deal, 3 products live
Conventional
25% down · 7.5% · 30yr
- Down + closing
- —
- Monthly P&I
- —
- Monthly cashflow
- —
- DSCR
- —
- Eligible?
- —
Personal DTI + credit; lowest rate.
DSCR
20% down · 8.5% · 30yr
- Down + closing
- —
- Monthly P&I
- —
- Monthly cashflow
- —
- DSCR
- —
- Eligible?
- —
No personal income docs; deal must DSCR.
Hard money
10% down · 12.0% · 12mo
- Down + closing
- —
- Monthly P&I
- —
- Monthly cashflow
- —
- DSCR
- —
- Eligible?
- —
Short-term bridge; refi at stabilization.
Rent comps 11 comps
| Address | Beds | Baths | Sqft | Rent | $/sqft | DOM | Units | Dist |
|---|---|---|---|---|---|---|---|---|
| 2024 Imperial Hwy Westland, MI | 3.0 | 1.0 | 1008 | $1,600 | $1.59 | 1d | 1 | 0.56mi |
| 5800 N Christine Westland, MI | 1.0–2.0 | 1.0–2.0 | 910 | $1,340 | $1.47 | 2d | 8 | 0.78mi |
| 6200 N Wayne Rd Westland, MI | 2.0 | 1.0 | 748 | $1,200 | $1.60 | 43d | 1 | 0.93mi |
| 33381 Florence St Garden City, MI | 3.0 | 2.0 | 1000 | $1,540 | $1.54 | 3d | 1 | 0.93mi |
| 34856 Fairchild St Westland, MI | 3.0 | 1.0 | 1013 | $1,745 | $1.72 | 11d | 1 | 0.94mi |
| 5995 N Wildwood St Westland, MI | 2.0 | 1.0 | 960 | $1,084 | $1.13 | 43d | 1 | 0.94mi |
| 1353 S Linville Ave Westland, MI | 3.0 | 1.0 | 948 | $1,450 | $1.53 | 10d | 1 | 1.17mi |
| 6501 Yale St Westland, MI | 1.0–2.0 | 1.0 | 746 | $1,129 | $1.51 | 5d | 5 | 1.23mi |
| 6737 N Wayne Rd Westland, MI | 1.0–2.0 | 1.0–1.5 | 850 | $1,375 | $1.62 | 4d | 6 | 1.34mi |
| 110 Waterbury Ct Westland, MI | 2.0 | 1.0–2.0 | 581 | $1,350 | $2.32 | 2d | 7 | 1.43mi |
| 7000 Lakeview Blvd Westland, MI | 1.0–2.0 | 1.0 | 752 | $1,294 | $1.72 | 2d | 61 | 1.43mi |
Listing history 34 events
-
2026-02-16status Pending 463-char remark
Show marketing remark (463 chars)
Attention investors, This property is perfect to work. Being sold as is condition. 3 bedroom house. Freshly painted and has newer carpet inside. Fully fenced backyard with privacy fence. This home is perfect for new investors or any buyer looking for a great home in westland. Buyers agent to verify all information. Buyer is resposnible for certificate of occupancy. Buyer is responsible for C of O. House is Winter resistant. Do not run the water while showing.
-
2026-02-16status Pending
Show marketing remark (463 chars)
Attention investors, This property is perfect to work. Being sold as is condition. 3 bedroom house. Freshly painted and has newer carpet inside. Fully fenced backyard with privacy fence. This home is perfect for new investors or any buyer looking for a great home in westland. Buyers agent to verify all information. Buyer is resposnible for certificate of occupancy. Buyer is responsible for C of O. House is Winter resistant. Do not run the water while showing.
-
2026-01-24price $129,999 463-char remark
Show marketing remark (463 chars)
Attention investors, This property is perfect to work. Being sold as is condition. 3 bedroom house. Freshly painted and has newer carpet inside. Fully fenced backyard with privacy fence. This home is perfect for new investors or any buyer looking for a great home in westland. Buyers agent to verify all information. Buyer is resposnible for certificate of occupancy. Buyer is responsible for C of O. House is Winter resistant. Do not run the water while showing.
-
2026-01-23price $129,999
-
2026-01-12$139,999 Active 463-char remark
Show marketing remark (463 chars)
Attention investors, This property is perfect to work. Being sold as is condition. 3 bedroom house. Freshly painted and has newer carpet inside. Fully fenced backyard with privacy fence. This home is perfect for new investors or any buyer looking for a great home in westland. Buyers agent to verify all information. Buyer is resposnible for certificate of occupancy. Buyer is responsible for C of O. House is Winter resistant. Do not run the water while showing.
-
2026-01-12$139,999 Active
Show marketing remark (463 chars)
Attention investors, This property is perfect to work. Being sold as is condition. 3 bedroom house. Freshly painted and has newer carpet inside. Fully fenced backyard with privacy fence. This home is perfect for new investors or any buyer looking for a great home in westland. Buyers agent to verify all information. Buyer is resposnible for certificate of occupancy. Buyer is responsible for C of O. House is Winter resistant. Do not run the water while showing.
-
2025-10-27historical
-
2025-10-27historical
-
2025-07-13$125,000 Active
-
2025-07-12$125,000 Active
-
2024-09-04historical
-
2024-09-04historical
-
2024-06-29$160,000 Active
-
2024-06-29$160,000 Active
-
2024-06-27historical
-
2024-06-27historical
-
2017-11-01soldstatus $76,000
-
2017-10-16soldstatus $76,000 Sold
-
2017-10-16soldstatus $76,000 Closed
-
2017-08-18status Pending
-
2017-08-18status Pending
-
2017-08-14status Active
-
2017-08-14status Pending
-
2017-08-12status Active
-
2017-08-12status Active
-
2017-08-11status Pending
-
2017-08-11status Pending
-
2017-07-28$75,000 Active
-
2017-07-28$75,000 Active
-
2016-09-14historical
-
2016-09-14historical
-
2016-08-18$39,900 Active
-
2016-08-18$39,900 Active
-
2003-04-17soldstatus $69,000
ⓘ Source: listings_history table (triggers on properties + properties_extension) + one-shot
backfill from property_details.listing_events for pre-trigger history.
Tax reassessment forecast MI · Partial reset (capped growth)
- Current annual tax
- $1,683 · $140/mo
- Projected year-2 tax
- $1,842 · $154/mo
- Expected delta
- +$160/yr (+$13/mo · 9.5%)
ⓘ Screening estimate from a state-policy table — verify with the county assessor before closing.
Climate risk First Street
- Flood 1/10 Low FEMA zone X (unshaded) · 0% chance over 30 yrs
- Wildfire 1/10 Low
- Heat 3/10 Moderate 7 d/yr ≥97°F today · 14 d/yr by 30 yrs out
- Wind 2/10 Low
- Air quality 2/10 Low 1 unhealthy d/yr today · 3 by 30 yrs out
Nearby sold comps map
Loading sold comps map…
Walkable amenities ~0.75 mi
Loading nearby amenities…
Taxation est. · year 1
- Rental income
- $17,338
- − Mortgage interest
- −$7,282
- − Property taxes
- −$1,683
- − Insurance
- −$650
- − Repairs & maintenance
- −$1,387
- − Management
- −$1,387
- − Depreciation
- −$3,782
- Taxable income
- $1,167
- Est. tax owed @ 24.0%
- −$280
- After-tax cash flow
- $2,903/yr
For passive investors: Depreciation is non-cash, so a rental often shows a tax loss while cash-flowing — sheltering income. Rental losses are passive: they offset passive income freely, and up to $25,000/yr can offset ordinary (W-2) income if you actively participate and your MAGI is under $100k (phasing out to $0 by $150k); unused losses carry forward. On sale, claimed depreciation is recaptured at up to 25%, and gains may owe capital-gains tax (a 1031 exchange can defer both). Figures are a year-1 estimate at your 24.0% rate — not tax advice; consult a CPA.
Schools (NCES district)
- District
- Wayne-Westland Community School District
- NCES district ID
- 2600015
- Math proficiency
- 11% ▼ -6.00%
- Reading proficiency
- 27% ▼ -2.00%
- Median HH income
- $43,524
- Composite
- 16.4/100
- National rank
- #9195
- State rank
- #474 of 540 in MI
Livability — Westland
- Score
- 77/100
- State rank
- #124
- US rank
- #3067
Category grades
Schools grade is shown separately in the Schools card above.
Census & demographics
- Census place
- Westland, MI
- County
- Wayne County · 1,562,939 people
- City population
- 83,633
- Metro
- Detroit-Warren-Dearborn, MI
- Population (ZIP)
- 48,530
- Household income
- $60,854
- Rent vs Own
- Severe rent burden
- 2263.0
Population outlook (Wayne County) Hauer SSP2
- Today (2025)
- 1,675,273 people
- By 2030
- 1,620,300 · -3.3%
- By 2040
- 1,502,341 · -10.3%
- By 2050
- 1,384,039 · -17.4%
- By 2075
- 1,124,592 · -32.9%
- By 2100
- 881,193 · -47.4%
Race, ethnicity, and origin ACS 2023
- Neighborhood character
- Diverse neighborhood (Simpson 0.56)
- Race & ethnicity
- White 63% Black 22% Two or more races 7% Asian 5% Hispanic / Latino 5%
- Common ancestry
- Romanian 11% Lithuanian 3% Italian 2%
- Foreign-born
- 11% · Canada, China
- Languages at home
- 87% English-only · Other Indo-European 5% Arabic 2% Spanish 2%
Political lean MEDSL · Wayne
- 2024 margin
- Strong D (+29.0) · D 62.7% · R 33.7% · Other 3.6%
- 2008→2024 swing
- -20.5pp toward R · 2008: 49.5pp · 2024: 29.0pp
- All cycles
- 2024: D+29.0 2020: D+38.1 2016: D+37.3 2012: D+46.9 2008: D+49.5
Not yet ingested
- Civics
- —
Market trends
- HPI YoY
- ▼ -265.65%
- Current HPI
- 237.7594
- Rent YoY
- ▲ 0.17%
- Metro
- Detroit-Warren-Dearborn, MI
- State GDP YoY
- ▲ 1.37%
- F500 in state
- 28
Industry mix (Fortune 500 HQ in MI)
| Industry | F500 HQs | Revenue |
|---|---|---|
| Automotive Parts | 3 | $48B |
|
||
| Automotive | 2 | $372B |
|
||
| Chemicals | 1 | $45B |
|
||
| Automotive Retail | 1 | $29B |
|
||
| Healthcare / Medical Devices | 1 | $23B |
|
||
| Automotive Technology | 1 | $20B |
|
||
Price history
+88.4% since first listed34 events — show timeline
- 2026-02-16 Pending — MiRealSource-MiMLS
- 2026-02-16 Pending — REALCOMP
- 2026-01-24 Price Changed $129,999 MiRealSource-MiMLS
- 2026-01-23 Price Changed $129,999 REALCOMP
- 2026-01-12 Listed $139,999 REALCOMP
- 2026-01-12 Listed $139,999 MiRealSource-MiMLS
- 2025-10-27 Listing Removed — REALCOMP
- 2025-10-27 Listing Removed — MiRealSource-MiMLS
- 2025-07-13 Listed $125,000 REALCOMP
- 2025-07-12 Listed $125,000 MiRealSource-MiMLS
- 2024-09-04 Listing Removed — REALCOMP
- 2024-09-04 Listing Removed — MiRealSource-MiMLS
- 2024-06-29 Listed $160,000 MiRealSource-MiMLS
- 2024-06-29 Listed $160,000 REALCOMP
- 2024-06-27 Coming Soon — MiRealSource-MiMLS
- 2024-06-27 Coming Soon — REALCOMP
- 2017-11-01 Sold (Public Records) $76,000 Public Records
- 2017-10-16 Sold (MLS) $76,000 MiRealSource-MiMLS
- 2017-10-16 Sold (MLS) $76,000 REALCOMP
- 2017-08-18 Pending — MiRealSource-MiMLS
- 2017-08-18 Pending — REALCOMP
- 2017-08-14 Relisted — REALCOMP
- 2017-08-14 Pending — REALCOMP
- 2017-08-12 Relisted — MiRealSource-MiMLS
- 2017-08-12 Relisted — REALCOMP
- 2017-08-11 Pending — MiRealSource-MiMLS
- 2017-08-11 Pending — REALCOMP
- 2017-07-28 Listed $75,000 MiRealSource-MiMLS
- 2017-07-28 Listed $75,000 REALCOMP
- 2016-09-14 Listing Removed — REALCOMP
- 2016-09-14 Listing Removed — MiRealSource-MiMLS
- 2016-08-18 Listed $39,900 MiRealSource-MiMLS
- 2016-08-18 Listed $39,900 REALCOMP
- 2003-04-17 Sold (Public Records) $69,000 Public Records
Property tax history
-1.3%/yrLatest (2025): $1,683 · -17.5% YoY. Source: county tax records.
Cash-flow waterfall
monthlySold comps — $/sqft
last 12 mo · ≤1 miLoading sold comps…