 Triplex
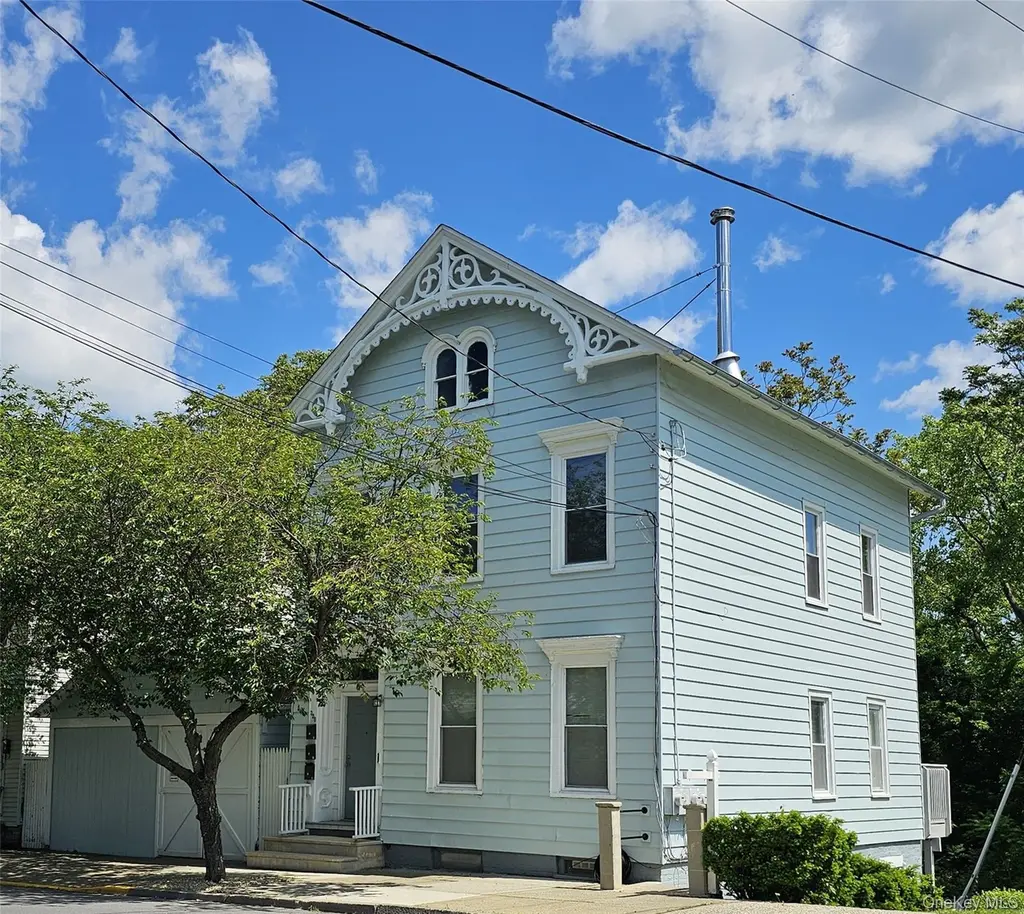
356-358 State St · Hudson, NY
Flood risk 1/10 · Minimal
- FEMA flood zone
- X
- Chance of flooding over 30 yrs
- 0.0%
- Est. flood insurance / yr
- $473 – $860
Fire risk 4/10 · Minor
- Est. fire insurance / yr
- $691 – $1,283
Heat risk 4/10 · Minor
- Hot days now (above 98°F)
- 7 days/yr
- Hot days in 30 yrs
- 17 days/yr
Wind risk 3/10 · Minor
- Chance of severe wind over 30 yrs
- 7.0%
Air-quality risk 2/10 · Minimal
- Unhealthy air days now
- 0 days/yr
- Unhealthy air days in 30 yrs
- 1 days/yr
Risk factors via First Street. Map © Google.
Why this score? — see what drove the C+ grade
The composite is a weighted blend of 9 inputs, each scored 0–100. Each bar is that input's sub-score; the figure is the points it added to the 100-point composite (weight × sub-score).
- Cash flow +17.9/30.0
- Appreciation +10.0/10.0
- ARV discount +7.5/15.0
- DSCR +5.6/10.0
- Rent growth +5.0/5.0
- 1% rule +4.8/10.0
- Condition / age +3.8/5.0
- Schools +3.6/10.0
- Livability +3.5/5.0
$679,900
🖨 Deal sheet 📄 Offer letter ✓ Due diligence
Multi-family units
County records classify this as Multi-Family (2-4 Unit). Listing-text estimate: 3 units. confirmed
Listing remarks
Fabulous owner-occupied or investment opportunity in the heart of Hudson on a double lot. This charming three-family home is just two blocks north of Warren Street's shops and restaurants, one block from the Armory, and a short walk to the train station -- an ideal downtown location. Each unit offers flexible living arrangements: the first- and second-floor apartments are both one-bedroom layouts with an additional office/guest room, living room, kitchen and bath. The lower-level unit is a bright, updated studio with plenty of natural light. The first and second floors have separate utilities, allowing flexible rental or owner-occupancy options. Live in one unit and have more than half your
Key facts
- Separate utilities
- Garden potential
- Updated studio
Tags
Property features AI
Exterior
- Parking: On-street parking; One garage space
- Utilities: Public sewer; Electricity connected; Natural gas connected
- Home design: Triplex
- Construction: Aluminum siding and wood frame construction; Brick and stone foundation
- Exterior features: Back yard; Not waterfront
Interior
- Bedrooms: Two 1-bedroom units
- Flooring: Laminate; Linoleum; Wood
- Bathrooms: Three full bathrooms (total)
- Heating & cooling: Forced air heating; Hot water heating; Natural gas heating; No central cooling
- Interior features: First-floor bedroom; First-floor full bathroom; Deck
Neighborhood map
What this means for you Summary
Snapshot
- This is a 3 × 1-bed/1.0-bath units multifamily listed at $680k. Condition is rated good.
Deal economics
- At list price, monthly cash flow is $571 ($7k/yr) — positive. Per door: $190/mo.
- The deal already cash-flows at list — no discount required.
- To meet the 1% rule (rent ≥ 1% of price), the offer needs to be $667k (1.9% below list).
- Recommended offer: $667k (1.9% below list) — sets the bar for 1% rule.
- Cap rate 7.3% vs local median 3.3% in Hudson — top-decile yield for the area; either an underpriced asset or a hidden risk that comps aren't pricing in. Stress-test before assuming the spread holds.
Location & tenants
- Location reads 70/100 on livability (#430 in NY) — a middle-class / working-renter tenant base. Strengths: amenities A+, health & safety A+; Watch: commute F, employment F.
- Hudson City School District (town): math 38% / reading 47% proficiency, ranked #494 of 590 in NY (top 84%) — families likely to look elsewhere, expect single-tenant / working-renter base with shorter leases.
- Zoned schools: Hudson High School (math 82% / reading 84%, grade A, #435 of 1,100 statewide, top 40%, 454 students, 57% FRL).
- Zoned-school proficiency averages 83% at this address vs 42% district-wide (+41 pts) — the actual schools serving this property are materially stronger than the Hudson City School District average implies; a family-tenant draw the district grade alone would hide.
- Market conditions: Rents rising fast (+10.9%/yr); 161 active listings in the ZIP; 136 units permitted in Columbia County in 2024 (0 in 5+ unit buildings).
- At $6,670/mo this rent would consume 110% of the median local household income ($73k/yr) (locally 1083% of renters already pay >50% of income on rent) — very limited rent-growth headroom before tenants either downsize or default.
Forward outlook
- In year one you build about $73k of equity ($5k loan paydown + $68k appreciation (10.0% local appreciation)).
- Columbia County population projected at -22% by 2050 — secular population decline; favor cash flow + early exit over multi-decade hold.
- At projected returns (10.0% appreciation + 8.0% rent growth), your $190k cash investment doubles in ~3 years — after that, you're playing with house money.
- By year 2, paydown + projected appreciation supports a ~$117k cash-out refi (75% LTV) — recoverable capital for the next deal without selling this one.
Negotiation context
- It's been on market 18 days — a 2% lower offer ($670k) is reasonable based on typical stale-listing flexibility.
Risks & watch-outs
- Watch-outs: built in 1890 — expect roof / HVAC / electrical / plumbing capex.
Questions for the listing agent
- Can we see the unit-by-unit rent roll, current vacancy, and any below-market leases? What's the average tenancy length?
- What capital expenditures (roof, boiler, parking lot, exteriors) have been made in the last 5 years, and what's planned in the next 2?
- Built in 1890 — when were the roof, HVAC, electrical panel, plumbing, and water heater last replaced?
- Is there a deadline driving the sale (1031 exchange, divorce, estate, relocation)? That informs how much negotiation room exists.
- What's the average days-on-market for RENTAL listings here right now (not sales)? A rising rental-DOM trend means longer vacancies and softer asking-rent achievability than the comps imply.
- What's the recent tenant-quality profile in this submarket — average credit score on applications, eviction rate, late-payment / NSF rate, and stable-employment percentage? A property-management company in the area should have these aggregated.
- How much new apartment / multifamily construction is in the pipeline within 1–3 miles? Heavy new supply (>2% of stock underway) typically softens rents 12–24 months out; light construction supports rent growth.
Investment metrics
- 1% rule
- 0.98% ✗
- Cap rate
- 7.30%
- Cash-on-cash
- 3.60%
- DSCR
- 1.16
- GRM
- 8.5
CMA / ARV
No comps found within radius.
Projected returns pro-forma
10.0% appreciation · 8.0% rent growth · sell at horizon
- IRR
- 28.8%
- Equity multiple
- 3.32×
- Total profit
- $441,987
- Equity at exit
- $612,508
- IRR
- 26.6%
- Equity multiple
- 8.15×
- Total profit
- $1,360,524
- Equity at exit
- $1,320,896
Cash invested: $190,372 (down + closing). Projections, not guarantees.
Landlord ↔ Tenant lean methodology
- Overall (STATE)
- 15 Strongly Tenant-Friendly
- State New York
- 15 Strongly Tenant-Friendly · D+10
- County
- — inherits STATE
- City
- — inherits STATE
ZIP-level market 12534
- Home prices YoY
- 5.6%
- Rents YoY
- 10.9%
- Active inventory
- 161
- Price-to-rent
- 25.5×
Monthly cashflow live
- Estimated rent
- $6,670 high interval (Pro) →
- Mortgage (P&I)
- −$3,565
- Tax est. 1.5%
- −$850 /mo · $10,198/yr
- Insurance
- −$283
- HOA
- −$0
- Vacancy / Maint / Mgmt
- −$1,401
- Net cashflow
- $571
Break-even live
3-unit breakdown (identical units grouped — click to expand)
| Units | Beds | Baths | Est. rent |
|---|---|---|---|
| 3× units | 1 | 1 | $6,669 |
| #1 | 1 | 1 | $2,223 |
| #2 | 1 | 1 | $2,223 |
| #3 | 1 | 1 | $2,223 |
| Total (3 units) | $6,670 | ||
UW: 25.0% down · 7.5% · 30yr · 1.5% tax · 5.0% vac · 8.0% maint · 8.0% mgmt
Financing live
Cash to close
- Down payment
- $169,975
- Closing costs
- $20,397
- Reserves months
- —
- Total cash needed
- —
Loan-product check · same deal, 3 products live
Conventional
25% down · 7.5% · 30yr
- Down + closing
- —
- Monthly P&I
- —
- Monthly cashflow
- —
- DSCR
- —
- Eligible?
- —
Personal DTI + credit; lowest rate.
DSCR
20% down · 8.5% · 30yr
- Down + closing
- —
- Monthly P&I
- —
- Monthly cashflow
- —
- DSCR
- —
- Eligible?
- —
No personal income docs; deal must DSCR.
Hard money
10% down · 12.0% · 12mo
- Down + closing
- —
- Monthly P&I
- —
- Monthly cashflow
- —
- DSCR
- —
- Eligible?
- —
Short-term bridge; refi at stabilization.
Listing history 13 events
-
2026-06-19days on market $679,900 Active 18 DOM
-
2026-06-18days on market $679,900 Active 17 DOM
-
2026-06-17days on market $679,900 Active 16 DOM
-
2026-06-16days on market $679,900 Active 15 DOM
-
2026-06-15days on market $679,900 Active 14 DOM
-
2026-06-14days on market $679,900 Active 12 DOM
-
2026-06-12days on market $679,900 Active 11 DOM
-
2026-06-09days on market $679,900 Active 8 DOM
-
2026-06-08days on market $679,900 Active 7 DOM
-
2026-06-07days on market $679,900 Active 6 DOM
-
2026-06-04days on market $679,900 Active 2 DOM
-
2026-06-01remarks 699-char remark
-
2026-06-01$679,900 Active 1 DOM
ⓘ Source: listings_history table (triggers on properties + properties_extension) + one-shot
backfill from property_details.listing_events for pre-trigger history.
Climate risk First Street
- Flood 1/10 Low FEMA zone X · 0% chance over 30 yrs
- Wildfire 4/10 Moderate
- Heat 4/10 Moderate 7 d/yr ≥98°F today · 17 d/yr by 30 yrs out
- Wind 3/10 Moderate 7% chance of damaging wind over 30 yrs
- Air quality 2/10 Low 0 unhealthy d/yr today · 1 by 30 yrs out
Nearby sold comps map
Loading sold comps map…
Walkable amenities ~0.75 mi
Loading nearby amenities…
Taxation est. · year 1
- Rental income
- $80,040
- − Mortgage interest
- −$38,085
- − Property taxes
- −$10,198
- − Insurance
- −$3,400
- − Repairs & maintenance
- −$6,403
- − Management
- −$6,403
- − Depreciation
- −$19,779
- Taxable loss
- −$4,228
- Est. tax savings @ 24.0%
- +$1,015
- After-tax cash flow
- $7,863/yr
For passive investors: Depreciation is non-cash, so a rental often shows a tax loss while cash-flowing — sheltering income. Rental losses are passive: they offset passive income freely, and up to $25,000/yr can offset ordinary (W-2) income if you actively participate and your MAGI is under $100k (phasing out to $0 by $150k); unused losses carry forward. On sale, claimed depreciation is recaptured at up to 25%, and gains may owe capital-gains tax (a 1031 exchange can defer both). Figures are a year-1 estimate at your 24.0% rate — not tax advice; consult a CPA.
Condition & rehab AI · 13 photos
This charming three-family home in Hudson is in good condition with a good condition score of 75. It offers flexible living arrangements and is located in a prime downtown location. The front porch and trim could be painted to enhance curb appeal and increase its value.
Value-add opportunities
- Both Paint the front porch and trim — Enhances curb appeal and can increase both resale and rental value.
- Both Update the kitchen appliances — Modernizing the kitchen can attract more buyers and renters.
Renovation cost estimate screening
Value-add ROI direction
- Both Paint the front porch and trim — Enhances curb appeal and can increase both resale and rental value. ↑
- Both Update the kitchen appliances — Modernizing the kitchen can attract more buyers and renters. ↑
ⓘ Cost ranges are severity-bucket heuristics (US national rule-of-thumb). Get contractor quotes + a written scope before underwriting a rehab budget.
Schools (NCES district)
- District
- Hudson City School District
- NCES district ID
- 3614940
- Math proficiency
- 38% ▲ 4.00%
- Reading proficiency
- 47% ▲ 7.00%
- Median HH income
- $44,663
- Composite
- 36.03/100
- National rank
- #4779
- State rank
- #494 of 590 in NY
Livability — Hudson
- Score
- 70/100
- State rank
- #430
- US rank
- #7443
Category grades
Schools grade is shown separately in the Schools card above.
Census & demographics
- Census place
- Hudson, NY
- County
- Columbia County · 17,176 people
- City population
- 17,176
- Metro
- Hudson, NY
- Population (ZIP)
- 17,176
- Household income
- $72,741
- Rent vs Own
- Severe rent burden
- 1083.0
Population outlook (Columbia County) Hauer SSP2
- Today (2025)
- 58,662 people
- By 2030
- 56,557 · -3.6%
- By 2040
- 51,324 · -12.5%
- By 2050
- 45,790 · -21.9%
- By 2075
- 35,232 · -39.9%
- By 2100
- 25,846 · -55.9%
Race, ethnicity, and origin ACS 2023
- Neighborhood character
- Predominantly White (74%)
- Race & ethnicity
- White 74% Two or more races 7% Black 7% Hispanic / Latino 7% Asian 6%
- Hispanic origin (detail)
- Mexican 2% Puerto Rican 1%
- Common ancestry
- Lithuanian 4% Romanian 4% Iranian 3%
- Foreign-born
- 10% · Canada, China
- Languages at home
- 88% English-only · Spanish 5% Other Indo-European 3% Chinese 1%
Political lean MEDSL · Columbia
- 2024 margin
- D (+14.7) · D 57.4% · R 42.6%
- 2008→2024 swing
- +1.3pp toward D · 2008: 13.4pp · 2024: 14.7pp
- All cycles
- 2024: D+14.7 2020: D+16.7 2016: D+1.4 2012: D+11.7 2008: D+13.4
Not yet ingested
- Civics
- —
Market trends
- HPI YoY
- ▲ 25.98%
- Current HPI
- 490.0412
- Rent YoY
- ▲ 10.88%
- Metro
- Hudson, NY
- State GDP YoY
- ▲ 2.60%
- F500 in state
- 92
Industry mix (Fortune 500 HQ in NY)
| Industry | F500 HQs | Revenue |
|---|---|---|
| Financial Services | 10 | $950B |
|
||
| Consumer Goods | 9 | $162B |
|
||
| Insurance | 4 | $225B |
|
||
| Telecommunications | 2 | $144B |
|
||
| Pharmaceuticals | 2 | $112B |
|
||
| Media / Entertainment | 2 | $69B |
|
||
Price history
1 event — show timeline
- 2026-05-29 Listed $679,900 OneKey® MLS as Distributed by MLS Grid
Cash-flow waterfall
monthlySold comps — $/sqft
last 12 mo · ≤1 miLoading sold comps…