10799 Sherman Grove Ave #18 · Los Angeles, CA
Flood risk 1/10 · Minimal
- FEMA flood zone
- X (unshaded)
- Chance of flooding over 30 yrs
- 0.0%
- Est. flood insurance / yr
- $507 – $1,088
Fire risk 8/10 · Major
- Est. fire insurance / yr
- $659 – $1,223
Heat risk 6/10 · Moderate
- Hot days now (above 97°F)
- 7 days/yr
- Hot days in 30 yrs
- 20 days/yr
Wind risk 1/10 · Minimal
- Chance of severe wind over 30 yrs
- —
Air-quality risk 9/10 · Severe
- Unhealthy air days now
- 18 days/yr
- Unhealthy air days in 30 yrs
- 21 days/yr
Risk factors via First Street. Map © Google.
Why this score? — see what drove the C- grade
The composite is a weighted blend of 9 inputs, each scored 0–100. Each bar is that input's sub-score; the figure is the points it added to the 100-point composite (weight × sub-score).
- Cash flow +25.1/30.0
- DSCR +8.2/10.0
- 1% rule +6.6/10.0
- Schools +3.6/10.0
- Livability +3.4/5.0
- Rent growth +2.5/5.0
- Condition / age +2.5/5.0
- ARV discount +0.0/15.0
- Appreciation +0.0/10.0
$165,000
🖨 Deal sheet 📄 Offer letter ✓ Due diligence
Listing remarks MLS
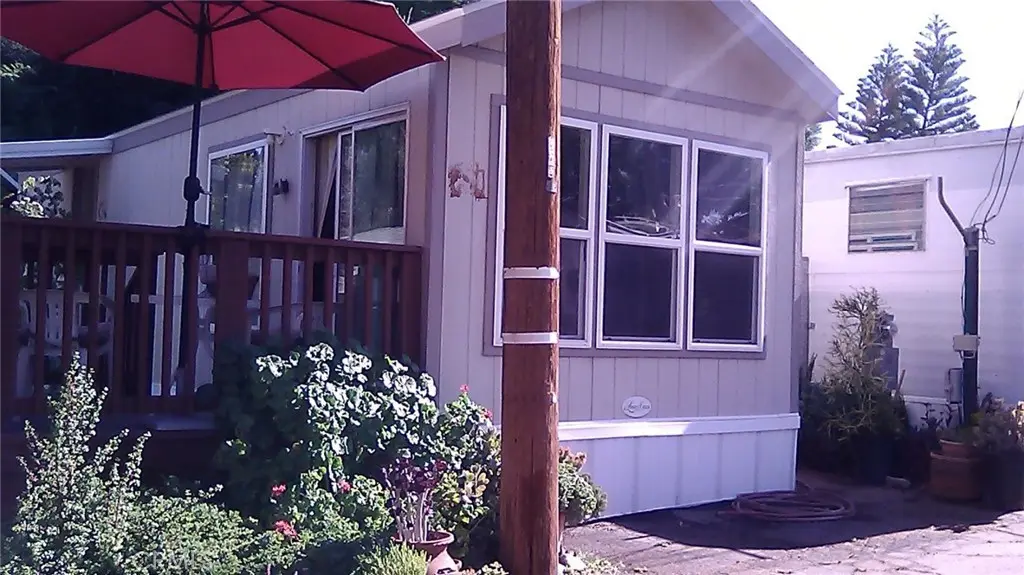
Welcome to this large lot, Cozy 1 bedroom, 1 bath mobile home located in a quiet and well-maintained mobile home park. This home features a bright living area, functional kitchen, and a comfortable bedroom with full bath. Enjoy low space rent and peaceful surroundings. Park is close to shopping, dining, and public transportation. Lots of mature trees and greenery. Stream , hiking trail and community room and community laundry available. Perfect for someone looking for affordable and simple living.
Key facts
- Functional kitchen
- Comfortable bedroom
- Bright living area
Tags
Neighborhood map
What this means for you Summary
Snapshot
- This is a 1-bed/1.0-bath manufactured listed at $165k.
Deal economics
- At list price, monthly cash flow is $367 ($4k/yr) — positive.
- The deal already cash-flows at list — no discount required.
- Meets the 1% rule at list price ($2k rent vs $165k).
- Recommended offer: $150k (9.0% below list) — sets the bar for market timing.
- Cap rate 9.0% vs local median 2.1% in Los Angeles — top-decile yield for the area; either an underpriced asset or a hidden risk that comps aren't pricing in. Stress-test before assuming the spread holds.
Location & tenants
- Location reads 68/100 on livability (#273 in CA) — a middle-class / working-renter tenant base. Strengths: amenities A+, commute A+, employment B; Watch: health & safety C-, schools D+, crime F.
- Los Angeles Unified (urban): math 29% / reading 54% proficiency, ranked #223 of 517 in CA (top 43%) — families likely to look elsewhere, expect single-tenant / working-renter base with shorter leases; 67% free/reduced lunch — lower-income household profile, screen leases tightly.
- Market conditions: 71 active listings in the ZIP; 27 comparable units currently listed for rent nearby; rentals at typical pace (median 25d on market — plan ~3-4 weeks tenant-placement turnaround); solid renter incomes; 19,697 units permitted in Los Angeles County in 2024 (9,426 in 5+ unit buildings).
Forward outlook
- Local home prices are declining (-3.0%/yr); year-one equity from $1k of loan paydown is wiped out by about $5k of value loss. Plan a longer hold.
- Los Angeles County population projected at +9% by 2050 — modest demand growth; plan on rents tracking national, not racing it.
Negotiation context
- It's been on market 97 days — a 9% lower offer ($150k) is reasonable based on typical stale-listing flexibility.
- 3 sale attempts since 18y ago with the ask held roughly flat each time — persistent listings suggest the price (not the market) is what's stuck; bring a comps-based counter.
Risks & watch-outs
- Climate carrying-cost: severe wildfire risk; extreme-heat days projected 7→20/yr by 2055 (HVAC capex compounding) — expect insurance premiums to compound above CPI over the hold.
Questions for the listing agent
- It's been on market 97 days. Have you received any prior offers? Is the seller open to a 9% concession, seller financing, or rate buy-down credit?
- Why hasn't it sold? Are there any deal-killer items the seller is aware of (foundation, flood, title, zoning, code violations)?
- Is there a deadline driving the sale (1031 exchange, divorce, estate, relocation)? That informs how much negotiation room exists.
- Schools are D-rated, which usually means shorter tenancies and higher turnover. Who's the typical renter profile here, and what's been the actual vacancy rate?
- Crime grade is F in this area — have there been break-ins, vandalism, or insurance claims at this property in the last 3 years? What carrier currently insures it and at what premium?
- What's the average days-on-market for RENTAL listings here right now (not sales)? A rising rental-DOM trend means longer vacancies and softer asking-rent achievability than the comps imply.
- What's the recent tenant-quality profile in this submarket — average credit score on applications, eviction rate, late-payment / NSF rate, and stable-employment percentage? A property-management company in the area should have these aggregated.
- How much new for-sale + rental construction is in the pipeline within 1–3 miles? Heavy new supply typically softens prices + rents 12–24 months out; constrained supply supports both.
Investment metrics
- 1% rule
- 1.16% ✓
- Cap rate
- 8.96%
- Cash-on-cash
- 9.53%
- DSCR
- 1.42
- GRM
- 7.2
CMA / ARV
- ARV (median comp)
- $131,500
- List price
- $165,000
- Delta
- 25.48%
- Verdict
- OVERPRICED
- Comps
- 2 within 1.0 mi
Show comp detail 7 sales within ~0.75 mi
| Address | Dist | Beds/Ba | Sqft | Sold | Price | $/sf | Match |
|---|---|---|---|---|---|---|---|
| 10711 Sherman Grove Ave #26 | 0.11mi | 2/2.0 (+1) | 700 (+8%) | 5mo | $135,000 | $193 | 69 |
| 8100 Foothill Blvd Unit SP67 | 0.75mi | 1/1.0 | 672 (+3%) | 14mo | $90,000 | $134 | 48 |
| 8100 Foothill Blvd #11 | 0.75mi | 1/1.0 | 616 (-5%) | 17mo | $85,000 | $138 | 42 |
| 8100 Foothill Blvd #11 | 0.75mi | 1/1.0 | 616 (-5%) | 17mo | $85,000 | $138 | 42 |
| 8100 Foothill Blvd #80 | 0.74mi | 1/1.0 | 612 (-6%) | 18mo | $70,000 | $114 | 41 |
| 8100 Foothill Blvd #71 | 0.72mi | 1/1.0 | 624 (-4%) | 24mo | $69,900 | $112 | 40 |
| 8100 Foothill Blvd #40 | 0.74mi | 2/1.0 (+1) | 700 (+8%) | 14mo | $89,900 | $128 | 37 |
Match score weights: distance 35% · size 25% · config 20% · recency 20%. Top-matched comps best support the ARV.
Projected returns pro-forma
-3.0% appreciation · 3.0% rent growth · sell at horizon
- IRR
- -1.9%
- Equity multiple
- 0.93×
- Total profit
- $-3,336
- Equity at exit
- $24,602
- IRR
- 7.8%
- Equity multiple
- 1.59×
- Total profit
- $27,307
- Equity at exit
- $14,266
Cash invested: $46,200 (down + closing). Projections, not guarantees.
Landlord ↔ Tenant lean methodology
- Overall (CITY)
- 0 Strongly Tenant-Friendly
- State California
- 18 Strongly Tenant-Friendly · D+13
- County
- — inherits STATE
- City Los Angeles
- 0 Strongly Tenant-Friendly · D+22
ZIP-level market 91040
- Active inventory
- 71
- Price-to-rent
- 7.2×
Monthly cashflow live
- Estimated rent
- $1,908 high interval (Pro) →
- Mortgage (P&I)
- −$865
- Tax est. 1.5%
- −$206 /mo · $2,475/yr
- Insurance
- −$69
- HOA
- −$0
- Vacancy / Maint / Mgmt
- −$401
- Net cashflow
- $367
Break-even live
UW: 25.0% down · 7.5% · 30yr · 1.5% tax · 5.0% vac · 8.0% maint · 8.0% mgmt
Financing live
Cash to close
- Down payment
- $41,250
- Closing costs
- $4,950
- Reserves months
- —
- Total cash needed
- —
Loan-product check · same deal, 3 products live
Conventional
25% down · 7.5% · 30yr
- Down + closing
- —
- Monthly P&I
- —
- Monthly cashflow
- —
- DSCR
- —
- Eligible?
- —
Personal DTI + credit; lowest rate.
DSCR
20% down · 8.5% · 30yr
- Down + closing
- —
- Monthly P&I
- —
- Monthly cashflow
- —
- DSCR
- —
- Eligible?
- —
No personal income docs; deal must DSCR.
Hard money
10% down · 12.0% · 12mo
- Down + closing
- —
- Monthly P&I
- —
- Monthly cashflow
- —
- DSCR
- —
- Eligible?
- —
Short-term bridge; refi at stabilization.
Rent comps 27 comps
| Address | Beds | Baths | Sqft | Rent | $/sqft | DOM | Units | Dist |
|---|---|---|---|---|---|---|---|---|
| 10647 Sherman Grove Ave Apt E Sunland, CA | 1.0 | 1.0 | 500 | $1,545 | $3.09 | 24d | 1 | 0.15mi |
| 8640 Hillrose St Sunland, CA | 1.0–2.0 | 1.0–1.5 | 841 | $1,600 | $1.90 | 2d | 2 | 0.17mi |
| 10635 Sherman Grove Ave Apt 5 Shadow Hills, CA | 1.0 | 1.0 | 480 | $2,000 | $4.17 | 24d | 1 | 0.17mi |
| 10523 Floralita Ave Sunland, CA | 1.0 | 1.0 | 514 | $1,825 | $3.55 | 10d | 3 | 0.33mi |
| 10500 Sherman Grove Ave Sunland, CA | 1.0–2.0 | 1.0–2.0 | 749 | $1,800 | $2.40 | 2d | 3 | 0.34mi |
| 11012 Quill Ave Sunland, CA | 1.0 | 1.5 | 601 | $2,195 | $3.65 | 24d | 1 | 0.35mi |
| 8541 Foothill Blvd Sunland, CA | 1.0–3.0 | 1.0–2.0 | 837 | $1,795 | $2.14 | 1d | 4 | 0.35mi |
| 8946 Oswego St Unit ADU Shadow Hills, CA | — | 1.0 | 350 | $1,850 | $5.29 | 43d | 1 | 0.41mi |
| 10730 Sunland Blvd Sun Valley, CA | 1.0–2.0 | 1.0 | 850 | $1,650 | $1.94 | 3d | 1 | 0.41mi |
| 11032 Scoville Ave Sunland, CA | 1.0 | 1.0 | 480 | $2,000 | $4.17 | 7d | 1 | 0.48mi |
| 10656 Nassau Ave Sunland, CA | 1.0 | 1.0 | 603 | $2,500 | $4.15 | 43d | 1 | 0.57mi |
| 10321 Sherman Grove Ave Sunland, CA | 1.0 | 1.0 | 485 | $1,800 | $3.71 | 17d | 1 | 0.57mi |
| 10425 Parr Ave Unit B Sunland, CA | 1.0 | 1.0 | 600 | $1,650 | $2.75 | 20d | 1 | 0.58mi |
| 10920 Nassau Ave Sunland, CA | 1.0 | 1.0 | 400 | $2,000 | $5.00 | 22d | 1 | 0.58mi |
| 10940 Nassau Ave Sunland, CA | 1.0 | 1.0 | 450 | $1,900 | $4.22 | 43d | 1 | 0.59mi |
| 8231 Wyngate St Unit 09 Sunland, CA | 1.0 | 1.0 | 665 | $1,599 | $2.40 | 14d | 1 | 0.63mi |
| 8231 Wyngate St Unit 17 Sunland, CA | 1.0 | 1.0 | 665 | $1,799 | $2.71 | 14d | 1 | 0.63mi |
| 11040 Nassau Ave Sunland, CA | — | 1.0 | 400 | $1,750 | $4.38 | 43d | 1 | 0.65mi |
| 10149 Langmuir Ave Sunland, CA | 1.0 | 1.0 | 640 | $2,600 | $4.06 | 24d | 1 | 1.00mi |
| 10542 Tinker Ave Tujunga, CA | 1.0 | 1.0 | 600 | $1,800 | $3.00 | 43d | 1 | 1.09mi |
| 7762 Foothill Blvd Tujunga, CA | 1.0 | 1.0 | 578 | $1,810 | $3.13 | 1d | 4 | 1.14mi |
| 7766 Wyngate St #07 Tujunga, CA | 1.0 | 1.0 | 641 | $1,695 | $2.64 | 43d | 1 | 1.14mi |
| 10943 Christine Way Tujunga, CA | 1.0 | 1.0 | 600 | $2,100 | $3.50 | 43d | 1 | 1.17mi |
| 10438 Irma Ave Tujunga, CA | — | 1.0 | 350 | $1,650 | $4.71 | 43d | 1 | 1.19mi |
| 10446 Kailua Ln Tujunga, CA | 1.0 | 1.0 | 650 | $1,750 | $2.69 | 24d | 1 | 1.27mi |
| 10533 Fernglen Ave Tujunga, CA | 1.0 | 1.0 | 660 | $2,200 | $3.33 | 43d | 1 | 1.48mi |
| 10407 McClemont Ave Tujunga, CA | 1.0 | 1.0 | 750 | $2,100 | $2.80 | 43d | 1 | 1.49mi |
Listing history 18 events
-
2026-06-18days on market $165,000 Active 97 DOM
-
2026-06-17days on market $165,000 Active 96 DOM
-
2026-06-16days on market $165,000 Active 95 DOM
-
2026-06-15days on market $165,000 Active 94 DOM
-
2026-06-13days on market $165,000 Active 92 DOM
-
2026-06-09days on market $165,000 Active 88 DOM
-
2026-06-08days on market $165,000 Active 87 DOM
-
2026-06-07days on market $165,000 Active 86 DOM
-
2026-06-04days on market $165,000 Active 83 DOM
-
2026-06-03days on market $165,000 Active 82 DOM
-
2026-06-02days on market $165,000 Active 81 DOM
-
2026-06-01days on market $165,000 Active 80 DOM
-
2026-05-31days on market $165,000 Active 79 DOM
-
2026-03-13$165,000 Active 502-char remark
Show marketing remark (502 chars)
Welcome to this large lot, Cozy 1 bedroom, 1 bath mobile home located in a quiet and well-maintained mobile home park. This home features a bright living area, functional kitchen, and a comfortable bedroom with full bath. Enjoy low space rent and peaceful surroundings. Park is close to shopping, dining, and public transportation. Lots of mature trees and greenery. Stream , hiking trail and community room and community laundry available. Perfect for someone looking for affordable and simple living.
-
2026-03-07historical
-
2025-10-09$175,000 Active
-
2009-01-12historical
-
2008-10-17$70,000
ⓘ Source: listings_history table (triggers on properties + properties_extension) + one-shot
backfill from property_details.listing_events for pre-trigger history.
Climate risk First Street
- Flood 1/10 Low FEMA zone X (unshaded) · 0% chance over 30 yrs
- Wildfire 8/10 Severe
- Heat 6/10 Major 7 d/yr ≥97°F today · 20 d/yr by 30 yrs out
- Wind 1/10 Low
- Air quality 9/10 Extreme 18 unhealthy d/yr today · 21 by 30 yrs out
Nearby sold comps map
Loading sold comps map…
Walkable amenities ~0.75 mi
Loading nearby amenities…
Taxation est. · year 1
- Rental income
- $22,895
- − Mortgage interest
- −$9,243
- − Property taxes
- −$2,475
- − Insurance
- −$825
- − Repairs & maintenance
- −$1,832
- − Management
- −$1,832
- − Depreciation
- −$4,800
- Taxable income
- $1,889
- Est. tax owed @ 24.0%
- −$453
- After-tax cash flow
- $3,950/yr
For passive investors: Depreciation is non-cash, so a rental often shows a tax loss while cash-flowing — sheltering income. Rental losses are passive: they offset passive income freely, and up to $25,000/yr can offset ordinary (W-2) income if you actively participate and your MAGI is under $100k (phasing out to $0 by $150k); unused losses carry forward. On sale, claimed depreciation is recaptured at up to 25%, and gains may owe capital-gains tax (a 1031 exchange can defer both). Figures are a year-1 estimate at your 24.0% rate — not tax advice; consult a CPA.
Schools (NCES district)
- District
- Los Angeles Unified
- NCES district ID
- 0622710
- Math proficiency
- 29% ▼ -4.00%
- Reading proficiency
- 54% ▲ 10.00%
- Median HH income
- $50,403
- Composite
- 35.67/100
- National rank
- #4875
- State rank
- #223 of 517 in CA
Livability — Los Angeles
- Score
- 68/100
- State rank
- #273
- US rank
- #9237
Category grades
Schools grade is shown separately in the Schools card above.
Census & demographics
- Census place
- Los Angeles, CA
- County
- Los Angeles County · 9,444,647 people
- City population
- 3,838,149
- Metro
- Los Angeles-Long Beach-Anaheim, CA
- Population (ZIP)
- 20,821
- Household income
- $98,256
- Rent vs Own
- Severe rent burden
- 866.0
Population outlook (Los Angeles County) Hauer SSP2
- Today (2025)
- 10,940,515 people
- By 2030
- 11,256,481 · +2.9%
- By 2040
- 11,729,929 · +7.2%
- By 2050
- 11,948,407 · +9.2%
- By 2075
- 11,818,114 · +8.0%
- By 2100
- 10,842,928 · -0.9%
Race, ethnicity, and origin ACS 2023
- Neighborhood character
- Diverse neighborhood (Simpson 0.57)
- Race & ethnicity
- White 61% Hispanic / Latino 22% Two or more races 16% Asian 9% Black 3%
- Hispanic origin (detail)
- Mexican 13%
- Common ancestry
- Lithuanian 2% Slovak 2% Romanian 1%
- Foreign-born
- 32% · Canada, South Korea
- Languages at home
- 55% English-only · Other Indo-European 23% Spanish 14% Tagalog/Filipino 2%
Political lean MEDSL · Los Angeles
- 2024 margin
- Solid D (+32.9) · D 64.8% · R 31.9% · Other 3.3%
- 2008→2024 swing
- -7.4pp toward R · 2008: 40.4pp · 2024: 32.9pp
- All cycles
- 2024: D+32.9 2020: D+44.2 2016: D+48.0 2012: D+40.0 2008: D+40.4
Not yet ingested
- Civics
- —
Market trends
- HPI YoY
- ▼ -794.48%
- Current HPI
- 408.964
- Rent YoY
- —
- Metro
- Los Angeles-Long Beach-Anaheim, CA
- State GDP YoY
- ▲ 3.21%
- F500 in state
- 116
Industry mix (Fortune 500 HQ in CA)
| Industry | F500 HQs | Revenue |
|---|---|---|
| Technology | 27 | $1,492B |
|
||
| Financial Services | 3 | $174B |
|
||
| Retail | 3 | $44B |
|
||
| Insurance | 3 | $26B |
|
||
| Media / Entertainment | 2 | $115B |
|
||
| Pharmaceuticals / Biotech | 2 | $62B |
|
||
Price history
+135.7% since first listed5 events — show timeline
- 2026-03-13 Listed $165,000 CRMLS
- 2026-03-07 Listing Removed — CRMLS
- 2025-10-09 Listed $175,000 CRMLS
- 2009-01-12 Listing Removed — CRMLS
- 2008-10-17 Listed $70,000 CRMLS
Cash-flow waterfall
monthlySold comps — $/sqft
last 12 mo · ≤1 miLoading sold comps…