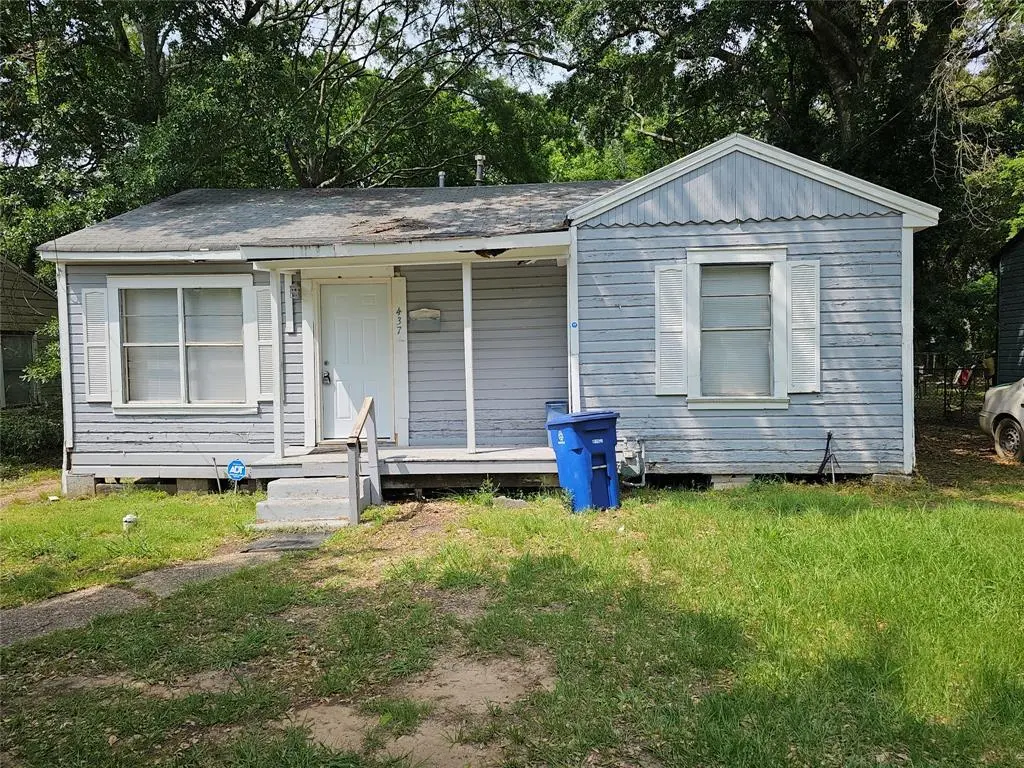
437 W 75th St · Shreveport, LA
Flood risk 1/10 · Minimal
- FEMA flood zone
- X (unshaded)
- Chance of flooding over 30 yrs
- 0.0%
- Est. flood insurance / yr
- $507 – $1,088
Fire risk 1/10 · Minimal
- Est. fire insurance / yr
- $1,269 – $2,357
Heat risk 7/10 · Major
- Hot days now (above 110°F)
- 7 days/yr
- Hot days in 30 yrs
- 21 days/yr
Wind risk 6/10 · Moderate
- Chance of severe wind over 30 yrs
- 70.0%
Air-quality risk 2/10 · Minimal
- Unhealthy air days now
- 1 days/yr
- Unhealthy air days in 30 yrs
- 1 days/yr
Risk factors via First Street. Map © Google.
Why this score? — see what drove the B grade
The composite is a weighted blend of 9 inputs, each scored 0–100. Each bar is that input's sub-score; the figure is the points it added to the 100-point composite (weight × sub-score).
- Cash flow +30.0/30.0
- ARV discount +12.3/15.0
- 1% rule +10.0/10.0
- DSCR +10.0/10.0
- Rent growth +4.4/5.0
- Livability +3.0/5.0
- Condition / age +2.5/5.0
- Schools +2.2/10.0
- Appreciation +0.0/10.0
$40,000
🖨 Deal sheet 📄 Offer letter ✓ Due diligence
Listing remarks
Prime Investment Opportunity - This 3-bedroom, 1-bathroom property is an excellent opportunity for investors seeking immediate cash flow. Previously leased for $750. This home offers a steady stream of rental income. This property combines stability with growth potential, making it a solid addition to any investment portfolio. 437 W 75th st —Offered as part of a ($345K) package deal with the following additional listings: MLS#21255204- 8218 S Lakeshore DR, MLS#21255197 -2711 Parkridge st, MLS#21255202 437- Desoto st and MLS#21255133- 1808 Corbitt st. Individual sales will be considered. Buyer to verify all information; property sold AS-IS. Schedule you showing today!!
Key facts
- 7,057 sq ft lot
- Built 1983
- Listed 48 days
Property features AI
Finance
- Other: Listing status: Active; Possession at closing/funding; Listing agreement: Exclusive right to sell
- Financial info: No second mortgage; Loan type: Treat as clear
- HOA & community: No homeowners association
Exterior
- Parking: Driveway
- Utilities: Cable available; City water; Not in a municipal utility district
- Home design: Single-family residence; One story; Residential property
- Construction: Built in 1983
- Exterior features: Lot under 0.5 acre (approximately 0.162 acres); Subdivision: Linwood Park Add
Interior
- Kitchen: Gas water heater
- Bedrooms: 3 bedrooms (primary bedroom on level 1)
- Bathrooms: 1 full bathroom
- Heating & cooling: Central heating; Central air conditioning
- Interior features: Cable TV available; One living area; Two total rooms
Neighborhood map
What this means for you Summary
Snapshot
- This is a 3-bed/1.0-bath single-family listed at $40k.
Deal economics
- At list price, monthly cash flow is $585 ($7k/yr) — positive.
- The deal already cash-flows at list — no discount required.
- Meets the 1% rule at list price ($1k rent vs $40k).
- Recommended offer: $39k (3.0% below list) — sets the bar for market timing.
- Cap rate 23.8% vs local median 5.7% in Shreveport — top-decile yield for the area; either an underpriced asset or a hidden risk that comps aren't pricing in. Stress-test before assuming the spread holds.
Location & tenants
- Location reads 59/100 on livability (#270 in LA) — a working-class tenant base; expect higher turnover. Strengths: cost of living A+, housing A; Watch: schools D+, crime F, amenities F.
- Caddo Parish (urban): math 21% / reading 32% proficiency, ranked #53 of 98 in LA (top 54%) — low school quality limits family demand, transient renter base, plan for 1-2y turnover; 64% free/reduced lunch — lower-income household profile, screen leases tightly.
- Market conditions: Rents rising fast (+7.5%/yr); 485 active listings in the ZIP; 17 comparable units currently listed for rent nearby; rentals lingering (median 44d on market — plan ~5-8 weeks vacancy on turnover, expect pricing pressure); 65% of comp listings sitting > 30 days — soft ceiling on asking rent; solid renter incomes; 221 units permitted in Caddo Parish in 2024 (0 in 5+ unit buildings).
- This rent is only 16% of the median local income ($81k/yr) — well below the 30% rent-burden line; pricing power to push rent on renewal without tenant pushback.
Forward outlook
- Local home prices are declining (-3.0%/yr); year-one equity from $277 of loan paydown is wiped out by about $1k of value loss. Plan a longer hold.
- Caddo County population projected at -15% by 2050 — secular population decline; favor cash flow + early exit over multi-decade hold.
- At projected returns (-3.0% appreciation + 7.5% rent growth), your $11k cash investment doubles in ~2 years — after that, you're playing with house money.
Negotiation context
- It's been on market 48 days — a 3% lower offer ($39k) is reasonable based on typical stale-listing flexibility.
- Current owner paid $19k; list at $40k implies a 111% gain — meaningful room to come down on a strong offer.
Risks & watch-outs
- Climate carrying-cost: major wind risk, 70% chance of damaging wind over 30y; extreme-heat days projected 7→21/yr by 2055 (HVAC capex compounding) — expect insurance premiums to compound above CPI over the hold.
Questions for the listing agent
- It's been on market 48 days. Have you received any prior offers? Is the seller open to a 3% concession, seller financing, or rate buy-down credit?
- Is there a deadline driving the sale (1031 exchange, divorce, estate, relocation)? That informs how much negotiation room exists.
- Schools are D-rated, which usually means shorter tenancies and higher turnover. Who's the typical renter profile here, and what's been the actual vacancy rate?
- Crime grade is F in this area — have there been break-ins, vandalism, or insurance claims at this property in the last 3 years? What carrier currently insures it and at what premium?
- What's the average days-on-market for RENTAL listings here right now (not sales)? A rising rental-DOM trend means longer vacancies and softer asking-rent achievability than the comps imply.
- What's the recent tenant-quality profile in this submarket — average credit score on applications, eviction rate, late-payment / NSF rate, and stable-employment percentage? A property-management company in the area should have these aggregated.
- How much new for-sale + rental construction is in the pipeline within 1–3 miles? Heavy new supply typically softens prices + rents 12–24 months out; constrained supply supports both.
Investment metrics
- 1% rule
- 2.67% ✓
- Cap rate
- 23.84%
- Cash-on-cash
- 62.65%
- DSCR
- 3.79
- GRM
- 3.1
CMA / ARV
- ARV (median comp)
- $44,733
- List price
- $40,000
- Delta
- -10.58%
- Verdict
- UNDERPRICED
- Comps
- 20 within 1.0 mi
Show comp detail 12 sales within ~0.75 mi
| Address | Dist | Beds/Ba | Sqft | Sold | Price | $/sf | Match |
|---|---|---|---|---|---|---|---|
| 717 Damaka Dr | 0.33mi | 3/1.5 | 1,371 (+4%) | 5mo | $45,000 | $33 | 71 |
| 533 W 77th St | 0.16mi | 3/1.0 | 1,162 (-12%) | 4mo | $24,000 | $21 | 69 |
| 518 W 76th St | 0.11mi | 3/2.0 | 1,250 (-5%) | 16mo | $65,000 | $52 | 69 |
| 721 Damaka Dr | 0.34mi | 3/2.0 | 1,243 (-6%) | 8mo | $45,000 | $36 | 64 |
| 431 Melrose St | 0.34mi | 2/1.0 (-1) | 1,177 (-11%) | 9mo | $40,000 | $34 | 54 |
| 7101 Devonshire Cir | 0.62mi | 4/1.5 (+1) | 1,376 (+5%) | 4mo | $70,000 | $51 | 53 |
| 1015 Pine Tree Dr | 0.68mi | 3/1.5 | 1,303 (-1%) | 16mo | $52,000 | $40 | 51 |
| 7123 Wyngate Blvd | 0.55mi | 3/1.0 | 1,146 (-13%) | 2mo | $35,000 | $31 | 51 |
| 7135 Wyngate Blvd | 0.52mi | 3/1.0 | 1,124 (-15%) | 4mo | $51,950 | $46 | 48 |
| 1022 Huntington Ln | 0.75mi | 3/1.0 | 1,254 (-5%) | 12mo | $27,900 | $22 | 47 |
| 7910 Woodfield Dr | 0.54mi | 3/2.0 | 1,470 (+12%) | 11mo | $115,000 | $78 | 42 |
| 7118 Wyngate Blvd | 0.58mi | 4/1.0 (+1) | 1,193 (-9%) | 16mo | $49,900 | $42 | 40 |
Match score weights: distance 35% · size 25% · config 20% · recency 20%. Top-matched comps best support the ARV.
Projected returns pro-forma
-3.0% appreciation · 7.51% rent growth · sell at horizon
- IRR
- 66.6%
- Equity multiple
- 4.20×
- Total profit
- $35,833
- Equity at exit
- $5,964
- IRR
- 72.2%
- Equity multiple
- 10.11×
- Total profit
- $102,004
- Equity at exit
- $3,458
Cash invested: $11,200 (down + closing). Projections, not guarantees.
Landlord ↔ Tenant lean methodology
- Overall (STATE)
- 90 Strongly Landlord-Friendly
- State Louisiana
- 90 Strongly Landlord-Friendly · R+12
- County
- — inherits STATE
- City
- — inherits STATE
ZIP-level market 71106
- Rents YoY
- 7.5%
- Active inventory
- 485
- Price-to-rent
- 3.1×
Monthly cashflow live
- Estimated rent
- $1,068 high interval (Pro) →
- Mortgage (P&I)
- −$210
- Tax from tax record
- −$33 /mo · $391/yr
- Insurance
- −$17
- HOA
- −$0
- Vacancy / Maint / Mgmt
- −$224
- Net cashflow
- $585
Break-even live
UW: 25.0% down · 7.5% · 30yr · 1.5% tax · 5.0% vac · 8.0% maint · 8.0% mgmt
Financing live
Cash to close
- Down payment
- $10,000
- Closing costs
- $1,200
- Reserves months
- —
- Total cash needed
- —
Loan-product check · same deal, 3 products live
Conventional
25% down · 7.5% · 30yr
- Down + closing
- —
- Monthly P&I
- —
- Monthly cashflow
- —
- DSCR
- —
- Eligible?
- —
Personal DTI + credit; lowest rate.
DSCR
20% down · 8.5% · 30yr
- Down + closing
- —
- Monthly P&I
- —
- Monthly cashflow
- —
- DSCR
- —
- Eligible?
- —
No personal income docs; deal must DSCR.
Hard money
10% down · 12.0% · 12mo
- Down + closing
- —
- Monthly P&I
- —
- Monthly cashflow
- —
- DSCR
- —
- Eligible?
- —
Short-term bridge; refi at stabilization.
Rent comps 17 comps
| Address | Beds | Baths | Sqft | Rent | $/sqft | DOM | Units | Dist |
|---|---|---|---|---|---|---|---|---|
| 638 Bringhurst Dr Shreveport, LA | 3.0 | 1.5 | 1704 | $1,200 | $0.70 | 21d | 1 | 0.29mi |
| 702 Bringhurst Dr Shreveport, LA | 3.0 | 1.5 | 1206 | $1,100 | $0.91 | 43d | 1 | 0.30mi |
| 7137 Burlingame Blvd Shreveport, LA | 3.0 | 1.5 | 1100 | $700 | $0.64 | 43d | 1 | 0.48mi |
| 223 W 69th St Shreveport, LA | 2.0 | 1.0 | 990 | $750 | $0.76 | 43d | 1 | 0.48mi |
| 7913 Woodfield Dr Shreveport, LA | 3.0 | 1.0 | 1067 | $1,000 | $0.94 | 43d | 1 | 0.50mi |
| 749 W 68th St Shreveport, LA | 3.0 | 1.0 | 1232 | $800 | $0.65 | 43d | 1 | 0.58mi |
| 323 W 83rd St Shreveport, LA | 3.0 | 1.0 | 973 | $750 | $0.77 | 43d | 1 | 0.60mi |
| 513 Sassafras Ave Shreveport, LA | 3.0 | 1.0 | 960 | $870 | $0.91 | 21d | 1 | 0.69mi |
| 629 David Dr Shreveport, LA | 3.0 | 1.5 | 1064 | $1,100 | $1.03 | 21d | 1 | 0.75mi |
| 629 Woodmont Pl Shreveport, LA | 3.0 | 1.0 | 1431 | $1,295 | $0.90 | 44d | 1 | 0.86mi |
| 570 Sally Ann Dr Shreveport, LA | 3.0 | 1.0 | 1082 | $825 | $0.76 | 13d | 1 | 0.87mi |
| 530 E 81st St Shreveport, LA | 3.0 | 1.0 | 1298 | $800 | $0.62 | 21d | 1 | 1.08mi |
| 8902 Coyth Ln Shreveport, LA | 3.0 | 2.0 | 1082 | $1,200 | $1.11 | 43d | 1 | 1.10mi |
| 7504 W Canal Blvd Shreveport, LA | 3.0 | 1.0 | 1388 | $1,150 | $0.83 | 43d | 1 | 1.22mi |
| 2762 Marquette St Shreveport, LA | 3.0 | 1.0 | 1054 | $1,000 | $0.95 | 21d | 1 | 1.23mi |
| 2721 Sunnybrook St Shreveport, LA | 3.0 | 1.0 | 913 | $1,000 | $1.10 | 43d | 1 | 1.23mi |
| 6002 Henderson Ave Shreveport, LA | 3.0 | 1.0 | 1059 | $1,050 | $0.99 | 43d | 1 | 1.30mi |
Listing history 20 events
-
2026-06-18days on market $40,000 Active 48 DOM
-
2026-06-17days on market $40,000 Active 47 DOM
-
2026-06-16days on market $40,000 Active 46 DOM
-
2026-06-15days on market $40,000 Active 45 DOM
-
2026-06-14days on market $40,000 Active 43 DOM
-
2026-06-13days on market $40,000 Active 42 DOM
-
2026-06-10days on market $40,000 Active 40 DOM
-
2026-06-09days on market $40,000 Active 39 DOM
-
2026-06-08days on market $40,000 Active 38 DOM
-
2026-06-07days on market $40,000 Active 37 DOM
-
2026-06-05days on market $40,000 Active 34 DOM
-
2026-06-03days on market $40,000 Active 33 DOM
-
2026-06-02days on market $40,000 Active 32 DOM
-
2026-06-01days on market $40,000 Active 31 DOM
-
2026-05-31days on market $40,000 Active 30 DOM
-
2026-05-30days on market $40,000 Active 29 DOM
-
2026-05-01$45,000 Active 688-char remark
-
2010-01-12soldstatus $19,000
-
2006-08-22soldstatus
-
2003-07-03soldstatus
ⓘ Source: listings_history table (triggers on properties + properties_extension) + one-shot
backfill from property_details.listing_events for pre-trigger history.
Tax reassessment forecast LA · Resets to sale price
- Current annual tax
- $391 · $33/mo
- Projected year-2 tax
- $391 · $33/mo
- Expected delta
- $0/yr ($0/mo · 0.0%)
ⓘ Screening estimate from a state-policy table — verify with the county assessor before closing.
Climate risk First Street
- Flood 1/10 Low FEMA zone X (unshaded) · 0% chance over 30 yrs
- Wildfire 1/10 Low
- Heat 7/10 Severe 7 d/yr ≥110°F today · 21 d/yr by 30 yrs out
- Wind 6/10 Major 70% chance of damaging wind over 30 yrs
- Air quality 2/10 Low 1 unhealthy d/yr today · 1 by 30 yrs out
Nearby sold comps map
Loading sold comps map…
Walkable amenities ~0.75 mi
Loading nearby amenities…
Taxation est. · year 1
- Rental income
- $12,816
- − Mortgage interest
- −$2,241
- − Property taxes
- −$391
- − Insurance
- −$200
- − Repairs & maintenance
- −$1,025
- − Management
- −$1,025
- − Depreciation
- −$1,164
- Taxable income
- $6,771
- Est. tax owed @ 24.0%
- −$1,625
- After-tax cash flow
- $5,392/yr
For passive investors: Depreciation is non-cash, so a rental often shows a tax loss while cash-flowing — sheltering income. Rental losses are passive: they offset passive income freely, and up to $25,000/yr can offset ordinary (W-2) income if you actively participate and your MAGI is under $100k (phasing out to $0 by $150k); unused losses carry forward. On sale, claimed depreciation is recaptured at up to 25%, and gains may owe capital-gains tax (a 1031 exchange can defer both). Figures are a year-1 estimate at your 24.0% rate — not tax advice; consult a CPA.
Schools (NCES district)
- District
- Caddo Parish
- NCES district ID
- 2200300
- Math proficiency
- 21% ▼ -33.00%
- Reading proficiency
- 32% ▼ -30.00%
- Median HH income
- $39,227
- Composite
- 22.23/100
- National rank
- #8148
- State rank
- #53 of 98 in LA
Livability — Shreveport
- Score
- 59/100
- State rank
- #270
- US rank
- #19730
Category grades
Schools grade is shown separately in the Schools card above.
Census & demographics
- Census place
- Shreveport, LA
- County
- Caddo Parish · 178,536 people
- City population
- 164,123
- Metro
- Shreveport-Bossier City, LA
- Population (ZIP)
- 34,117
- Household income
- $81,452
- Rent vs Own
- Severe rent burden
- 1333.0
Population outlook (Caddo County) Hauer SSP2
- Today (2025)
- 243,190 people
- By 2030
- 237,231 · -2.5%
- By 2040
- 222,502 · -8.5%
- By 2050
- 206,516 · -15.1%
- By 2075
- 165,706 · -31.9%
- By 2100
- 122,262 · -49.7%
Race, ethnicity, and origin ACS 2023
- Neighborhood character
- Diverse neighborhood (Simpson 0.59)
- Race & ethnicity
- White 51% Black 39% Hispanic / Latino 5% Two or more races 5%
- Hispanic origin (detail)
- Mexican 3%
- Common ancestry
- Lithuanian 3% Slovak 2% Serbian 1%
- Foreign-born
- 3% · Canada
- Languages at home
- 96% English-only · Spanish 3% Other Indo-European 0%
Political lean MEDSL · Caddo
- 2024 margin
- Toss-up / Even · D 51.6% · R 47.0% · Other 1.4%
- 2008→2024 swing
- +1.6pp toward D · 2008: 3.0pp · 2024: 4.6pp
- All cycles
- 2024: D+4.6 2020: D+6.8 2016: D+4.2 2012: D+4.9 2008: D+3.0
Not yet ingested
- Civics
- —
Market trends
- HPI YoY
- ▼ -86.48%
- Current HPI
- 124.2416
- Rent YoY
- ▲ 7.51%
- Metro
- Shreveport-Bossier City, LA
- State GDP YoY
- ▲ 3.29%
- F500 in state
- 10
Industry mix (Fortune 500 HQ in LA)
| Industry | F500 HQs | Revenue |
|---|---|---|
| Telecommunications | 2 | $23B |
|
||
| Utilities | 1 | $12B |
|
||
| Wholesale / Distribution | 1 | $5B |
|
||
| Advertising | 1 | $2B |
|
||
Price history
+110.5% since first listed5 events — show timeline
- 2026-05-20 Price Changed $40,000 NTREIS
- 2026-05-01 Listed $45,000 NTREIS
- 2010-01-12 Sold (Public Records) $19,000 Public Records
- 2006-08-22 Sold (Public Records) — Public Records
- 2003-07-03 Sold (Public Records) — Public Records
Property tax history
-1.0%/yrLatest (2025): $391 · +0.4% YoY. Source: county tax records.
Cash-flow waterfall
monthlySold comps — $/sqft
last 12 mo · ≤1 miLoading sold comps…