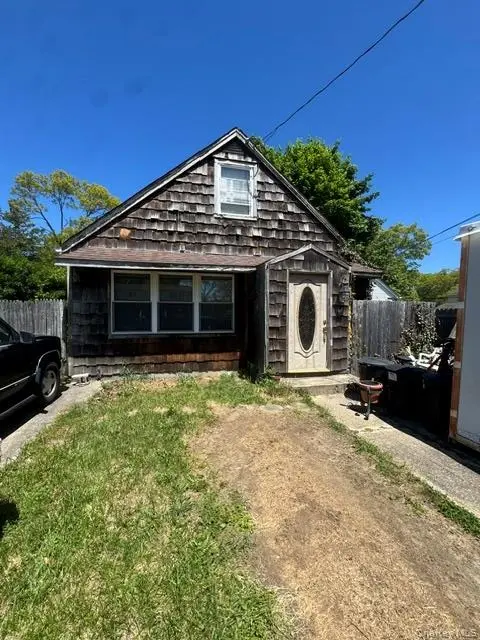
31 3rd St · Lake Ronkonkoma, NY
Flood risk 1/10 · Minimal
- FEMA flood zone
- X (unshaded)
- Chance of flooding over 30 yrs
- 0.0%
- Est. flood insurance / yr
- $473 – $860
Fire risk 1/10 · Minimal
- Est. fire insurance / yr
- $691 – $1,283
Heat risk 5/10 · Moderate
- Hot days now (above 93°F)
- 7 days/yr
- Hot days in 30 yrs
- 17 days/yr
Wind risk 6/10 · Moderate
- Chance of severe wind over 30 yrs
- 72.0%
Air-quality risk 4/10 · Minor
- Unhealthy air days now
- 4 days/yr
- Unhealthy air days in 30 yrs
- 6 days/yr
Risk factors via First Street. Map © Google.
Why this score? — see what drove the C- grade
The composite is a weighted blend of 9 inputs, each scored 0–100. Each bar is that input's sub-score; the figure is the points it added to the 100-point composite (weight × sub-score).
- ARV discount +15.0/15.0
- Cash flow +14.9/30.0
- Schools +6.6/10.0
- DSCR +4.6/10.0
- 1% rule +4.1/10.0
- Livability +3.9/5.0
- Rent growth +2.7/5.0
- Condition / age +2.5/5.0
- Appreciation +0.0/10.0
$419,000
🖨 Deal sheet 📄 Offer letter ✓ Due diligence
Listing remarks
4 Bedrooms 1 Full Bath, Crawl Space for Basement.
Key facts
- 3,920 sq ft lot
- Built 1962
- Listed 36 days
Property features AI
Exterior
- Parking: Driveway
- Utilities: Cesspool sewer; Cable available; Electricity available
- Home design: Single family residence
- Construction: Frame construction
- Exterior features: Frame construction; Not waterfront
Interior
- Kitchen: Refrigerator
- Bedrooms: Bedroom on the first floor
- Bathrooms: 1 full bathroom
- Heating & cooling: Baseboard heating; Hot water heating; Oil heating; No central cooling
- Interior features: First-floor bedroom; First-floor full bathroom; 7 total rooms; Scuttle attic; Crawl space basement
Neighborhood map
What this means for you Summary
Snapshot
- This is a 4-bed/1.0-bath single-family listed at $419k.
Deal economics
- At list price, monthly cash flow is $122 ($1k/yr) — positive.
- The deal already cash-flows at list — no discount required.
- To meet the 1% rule (rent ≥ 1% of price), the offer needs to be $381k (9.2% below list).
- Recommended offer: $381k (9.2% below list) — sets the bar for 1% rule.
- Cap rate 6.6% vs local median 4.0% in Lake Ronkonkoma — top-decile yield for the area; either an underpriced asset or a hidden risk that comps aren't pricing in. Stress-test before assuming the spread holds.
Location & tenants
- Location reads 78/100 on livability (#169 in NY, #2,606 nationally) — a middle-class / working-renter tenant base. Strengths: employment A+, housing A+, health & safety B; Watch: amenities D-, cost of living F.
- Sachem Central School District (suburban): math 69% / reading 76% proficiency, ranked #86 of 590 in NY (top 15%) — strong family-tenant draw, lease renewals of 3-5y typical; only 15% free/reduced lunch — higher-income household profile.
- Zoned schools: Wenonah School (math 62% / reading 72%, grade B+, #525 of 2,108 statewide, top 27%, 479 students, 24% FRL); Samoset Middle School (math 51% / reading 63%, grade B, #192 of 729 statewide, top 28%, 892 students, 31% FRL); Sachem High School North (math 96% / reading 95%, grade A+, #76 of 1,100 statewide, top 7%, 1,923 students, 25% FRL).
- Market conditions: Rents flat; 173 active listings in the ZIP; 1 comparable units currently listed for rent nearby; high-income renter base; 1,366 units permitted in Suffolk County in 2024 (216 in 5+ unit buildings).
- This rent runs 41% of the median local income ($112k/yr) — at the standard rent-burdened threshold; future hikes will face affordability resistance.
Forward outlook
- Local home prices are declining (-3.0%/yr); year-one equity from $3k of loan paydown is wiped out by about $13k of value loss. Plan a longer hold.
- Suffolk County population projected to shrink 5% by 2050 — rents likely to lag national; underwrite the cash flow, not the appreciation.
Negotiation context
- It's been on market 36 days — a 3% lower offer ($406k) is reasonable based on typical stale-listing flexibility.
Risks & watch-outs
- Climate carrying-cost: major wind risk, 72% chance of damaging wind over 30y; extreme-heat days projected 7→17/yr by 2055 (HVAC capex compounding) — expect insurance premiums to compound above CPI over the hold.
Questions for the listing agent
- It's been on market 36 days. Have you received any prior offers? Is the seller open to a 9% concession, seller financing, or rate buy-down credit?
- Built in 1962 — when were the roof, HVAC, electrical panel, plumbing, and water heater last replaced?
- Is there a deadline driving the sale (1031 exchange, divorce, estate, relocation)? That informs how much negotiation room exists.
- Schools are B-rated — typically a magnet for longer-tenancy family renters. What's the average tenant stay here, and is there a school-zone premium baked into asking?
- What's the average days-on-market for RENTAL listings here right now (not sales)? A rising rental-DOM trend means longer vacancies and softer asking-rent achievability than the comps imply.
- What's the recent tenant-quality profile in this submarket — average credit score on applications, eviction rate, late-payment / NSF rate, and stable-employment percentage? A property-management company in the area should have these aggregated.
- How much new for-sale + rental construction is in the pipeline within 1–3 miles? Heavy new supply typically softens prices + rents 12–24 months out; constrained supply supports both.
Investment metrics
- 1% rule
- 0.91% ✗
- Cap rate
- 6.64%
- Cash-on-cash
- 1.24%
- DSCR
- 1.06
- GRM
- 9.2
CMA / ARV
- ARV (median comp)
- $639,810
- List price
- $419,000
- Delta
- -34.51%
- Verdict
- UNDERPRICED
- Comps
- 20 within 1.0 mi
Show comp detail 1 sale within ~0.75 mi
| Address | Dist | Beds/Ba | Sqft | Sold | Price | $/sf | Match |
|---|---|---|---|---|---|---|---|
| 34 Weichers Ave | 0.56mi | 3/1.0 (-1) | 751 (-2%) | 12mo | $380,000 | $506 | 56 |
Match score weights: distance 35% · size 25% · config 20% · recency 20%. Top-matched comps best support the ARV.
Projected returns pro-forma
-3.0% appreciation · 0.79% rent growth · sell at horizon
- IRR
- -16.8%
- Equity multiple
- 0.42×
- Total profit
- $-68,383
- Equity at exit
- $62,474
- IRR
- -13.3%
- Equity multiple
- 0.30×
- Total profit
- $-81,875
- Equity at exit
- $36,227
Cash invested: $117,320 (down + closing). Projections, not guarantees.
Landlord ↔ Tenant lean methodology
- Overall (STATE)
- 15 Strongly Tenant-Friendly
- State New York
- 15 Strongly Tenant-Friendly · D+10
- County
- — inherits STATE
- City
- — inherits STATE
ZIP-level market 11779
- Rents YoY
- 0.8%
- Active inventory
- 173
- Price-to-rent
- 9.2×
Monthly cashflow live
- Estimated rent
- $3,806 medium interval (Pro) →
- Mortgage (P&I)
- −$2,197
- Tax from tax record
- −$513 /mo · $6,157/yr
- Insurance
- −$175
- HOA
- −$0
- Vacancy / Maint / Mgmt
- −$799
- Net cashflow
- $122
Break-even live
UW: 25.0% down · 7.5% · 30yr · 1.5% tax · 5.0% vac · 8.0% maint · 8.0% mgmt
Financing live
Cash to close
- Down payment
- $104,750
- Closing costs
- $12,570
- Reserves months
- —
- Total cash needed
- —
Loan-product check · same deal, 3 products live
Conventional
25% down · 7.5% · 30yr
- Down + closing
- —
- Monthly P&I
- —
- Monthly cashflow
- —
- DSCR
- —
- Eligible?
- —
Personal DTI + credit; lowest rate.
DSCR
20% down · 8.5% · 30yr
- Down + closing
- —
- Monthly P&I
- —
- Monthly cashflow
- —
- DSCR
- —
- Eligible?
- —
No personal income docs; deal must DSCR.
Hard money
10% down · 12.0% · 12mo
- Down + closing
- —
- Monthly P&I
- —
- Monthly cashflow
- —
- DSCR
- —
- Eligible?
- —
Short-term bridge; refi at stabilization.
Rent comps 1 comps
| Address | Beds | Baths | Sqft | Rent | $/sqft | DOM | Units | Dist |
|---|---|---|---|---|---|---|---|---|
| 2 Hawkins Ave Lake Ronkonkoma, NY | 3.0 | 1.0–2.0 | 959 | $4,980 | $5.19 | 1d | 129 | 0.39mi |
Listing history 15 events
-
2026-06-18days on market $419,000 Active 36 DOM
-
2026-06-17days on market $419,000 Active 35 DOM
-
2026-06-16days on market $419,000 Active 34 DOM
-
2026-06-15days on market $419,000 Active 33 DOM
-
2026-06-13days on market $419,000 Active 31 DOM
-
2026-06-13days on market $419,000 Active 30 DOM
-
2026-06-09days on market $419,000 Active 27 DOM
-
2026-06-08days on market $419,000 Active 26 DOM
-
2026-06-07days on market $419,000 Active 25 DOM
-
2026-06-04days on market $419,000 Active 22 DOM
-
2026-06-03days on market $419,000 Active 21 DOM
-
2026-06-02days on market $419,000 Active 20 DOM
-
2026-06-01days on market $419,000 Active 19 DOM
-
2026-05-31days on market $419,000 Active 18 DOM
-
2026-05-13$419,000 Active 49-char remark
ⓘ Source: listings_history table (triggers on properties + properties_extension) + one-shot
backfill from property_details.listing_events for pre-trigger history.
Tax reassessment forecast NY · Partial reset (capped growth)
- Current annual tax
- $6,157 · $513/mo
- Projected year-2 tax
- $6,619 · $552/mo
- Expected delta
- +$462/yr (+$38/mo · 7.5%)
ⓘ Screening estimate from a state-policy table — verify with the county assessor before closing.
Climate risk First Street
- Flood 1/10 Low FEMA zone X (unshaded) · 0% chance over 30 yrs
- Wildfire 1/10 Low
- Heat 5/10 Major 7 d/yr ≥93°F today · 17 d/yr by 30 yrs out
- Wind 6/10 Major 72% chance of damaging wind over 30 yrs
- Air quality 4/10 Moderate 4 unhealthy d/yr today · 6 by 30 yrs out
Nearby sold comps map
Loading sold comps map…
Walkable amenities ~0.75 mi
Loading nearby amenities…
Taxation est. · year 1
- Rental income
- $45,669
- − Mortgage interest
- −$23,471
- − Property taxes
- −$6,157
- − Insurance
- −$2,095
- − Repairs & maintenance
- −$3,654
- − Management
- −$3,654
- − Depreciation
- −$12,189
- Taxable loss
- −$5,550
- Est. tax savings @ 24.0%
- +$1,332
- After-tax cash flow
- $2,791/yr
For passive investors: Depreciation is non-cash, so a rental often shows a tax loss while cash-flowing — sheltering income. Rental losses are passive: they offset passive income freely, and up to $25,000/yr can offset ordinary (W-2) income if you actively participate and your MAGI is under $100k (phasing out to $0 by $150k); unused losses carry forward. On sale, claimed depreciation is recaptured at up to 25%, and gains may owe capital-gains tax (a 1031 exchange can defer both). Figures are a year-1 estimate at your 24.0% rate — not tax advice; consult a CPA.
Schools (NCES district)
- District
- Sachem Central School District
- NCES district ID
- 3625350
- Math proficiency
- 69% ▬ 0.00%
- Reading proficiency
- 76% ▲ 12.00%
- Median HH income
- $92,968
- Composite
- 65.53/100
- National rank
- #472
- State rank
- #86 of 590 in NY
Livability — Lake Ronkonkoma
- Score
- 78/100
- State rank
- #169
- US rank
- #2606
Category grades
Schools grade is shown separately in the Schools card above.
Census & demographics
- Census place
- Lake Ronkonkoma, NY
- County
- Suffolk County · 679,920 people
- City population
- 38,273
- Metro
- New York-Newark-Jersey City, NY-NJ-PA
- Population (ZIP)
- 38,206
- Household income
- $112,180
- Rent vs Own
- Severe rent burden
- 874.0
Population outlook (Suffolk County) Hauer SSP2
- Today (2025)
- 1,505,262 people
- By 2030
- 1,498,318 · -0.5%
- By 2040
- 1,471,101 · -2.3%
- By 2050
- 1,424,848 · -5.3%
- By 2075
- 1,337,157 · -11.2%
- By 2100
- 1,217,720 · -19.1%
Race, ethnicity, and origin ACS 2023
- Neighborhood character
- Predominantly White (67%)
- Race & ethnicity
- White 67% Hispanic / Latino 19% Two or more races 9% Asian 7% Black 5%
- Hispanic origin (detail)
- Puerto Rican 7% Dominican 1%
- Common ancestry
- Romanian 4% Scotch-Irish 1% Lithuanian 1%
- Foreign-born
- 14% · Canada, Jamaica, China
- Languages at home
- 79% English-only · Spanish 10% Other Indo-European 7% Other Asian/Pacific 1%
Political lean MEDSL · Suffolk
- 2024 margin
- Lean R (+10.0) · D 45.0% · R 55.0%
- 2008→2024 swing
- -16.0pp toward R · 2008: 6.0pp · 2024: -10.0pp
- All cycles
- 2024: R+10.0 2020: R+0.0 2016: R+8.2 2012: D+2.9 2008: D+6.0
Not yet ingested
- Civics
- —
Market trends
- HPI YoY
- ▼ -569.98%
- Current HPI
- 350.0973
- Rent YoY
- ▲ 0.79%
- Metro
- New York-Newark-Jersey City, NY-NJ-PA
- State GDP YoY
- ▲ 2.60%
- F500 in state
- 92
Industry mix (Fortune 500 HQ in NY)
| Industry | F500 HQs | Revenue |
|---|---|---|
| Financial Services | 10 | $950B |
|
||
| Consumer Goods | 9 | $162B |
|
||
| Insurance | 4 | $225B |
|
||
| Telecommunications | 2 | $144B |
|
||
| Pharmaceuticals | 2 | $112B |
|
||
| Media / Entertainment | 2 | $69B |
|
||
Price history
1 event — show timeline
- 2026-05-13 Listed $419,000 OneKey® MLS as Distributed by MLS Grid
Property tax history
+2.2%/yrLatest (2025): $6,157 · +0.0% YoY. Source: county tax records.
Cash-flow waterfall
monthlySold comps — $/sqft
last 12 mo · ≤1 miLoading sold comps…