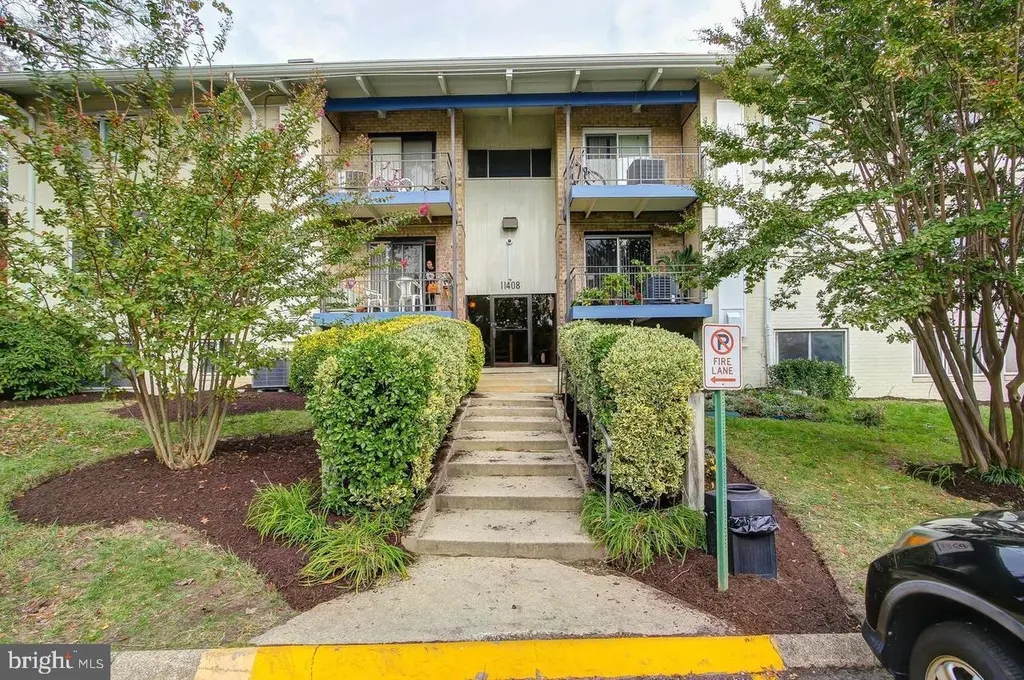
11408 Cherry Hill Rd #103 · Calverton, MD
Flood risk 1/10 · Minimal
- FEMA flood zone
- X (unshaded)
- Chance of flooding over 30 yrs
- 0.0%
- Est. flood insurance / yr
- $507 – $1,088
Fire risk 1/10 · Minimal
- Est. fire insurance / yr
- $755 – $1,403
Heat risk 7/10 · Major
- Hot days now (above 104°F)
- 7 days/yr
- Hot days in 30 yrs
- 15 days/yr
Wind risk 4/10 · Minor
- Chance of severe wind over 30 yrs
- 16.0%
Air-quality risk 4/10 · Minor
- Unhealthy air days now
- 5 days/yr
- Unhealthy air days in 30 yrs
- 6 days/yr
Risk factors via First Street. Map © Google.
Why this score? — see what drove the D grade
The composite is a weighted blend of 9 inputs, each scored 0–100. Each bar is that input's sub-score; the figure is the points it added to the 100-point composite (weight × sub-score).
- ARV discount +14.8/15.0
- Cash flow +7.7/30.0
- 1% rule +4.9/10.0
- Schools +3.6/10.0
- Livability +3.4/5.0
- Condition / age +2.5/5.0
- Rent growth +2.3/5.0
- DSCR +1.8/10.0
- Appreciation +0.0/10.0
$149,000
🖨 Deal sheet 📄 Offer letter ✓ Due diligence
Listing remarks MLS
Beautifully updated 1BR condo unit. Centrally located, modern flooring, newer kitchen, newer appliances, laundry room in building; available today. All Utilities (electric, gas, water) are all included in the moderate condo fee.
Key facts
- $393 HOA
- Built 1966
- Listed 67 days
Neighborhood map
What this means for you Summary
Snapshot
- This is a 1-bed/1.0-bath condo listed at $149k.
Deal economics
- At list price, monthly cash flow is $-170 ($-2k/yr) — negative.
- To cash-flow at today's rent, offer at most $119k (20.2% below list).
- To meet the 1% rule (rent ≥ 1% of price), the offer needs to be $147k (1.5% below list).
- Recommended offer: $119k (20.2% below list) — sets the bar for cash-flow.
- Cap rate 4.9% vs local median 3.6% in Calverton — top-decile yield for the area; either an underpriced asset or a hidden risk that comps aren't pricing in. Stress-test before assuming the spread holds.
Location & tenants
- Location reads 68/100 on livability (#203 in MD) — a middle-class / working-renter tenant base. Strengths: employment A+, housing A+; Watch: health & safety C-, schools D+, amenities D-.
- Montgomery County Public Schools (suburban): math 27% / reading 45% proficiency, ranked #3 of 24 in MD (top 12%) — families likely to look elsewhere, expect single-tenant / working-renter base with shorter leases.
- Market conditions: Rents soft (-0.9%/yr); 88 active listings in the ZIP; 4 comparable units currently listed for rent nearby; rentals leasing fast (median 5d on market — plan ~1-2 weeks tenant-placement turnaround); high-income renter base; 3,880 units permitted in Montgomery County in 2024 (2,054 in 5+ unit buildings).
- This rent is only 16% of the median local income ($110k/yr) — well below the 30% rent-burden line; pricing power to push rent on renewal without tenant pushback.
Forward outlook
- Local home prices are declining (-3.0%/yr); year-one equity from $1k of loan paydown is wiped out by about $4k of value loss. Plan a longer hold.
- Montgomery County population projected at +27% by 2050 — long-run rental-demand tailwind backs the buy-and-hold thesis.
Negotiation context
- It's been on market 67 days — a 6% lower offer ($140k) is reasonable based on typical stale-listing flexibility.
- 2 sale attempts with the ask held roughly flat each time — persistent listings suggest the price (not the market) is what's stuck; bring a comps-based counter.
- Current owner paid $115k; 30% above their basis — modest negotiation headroom, anchor on the comps not their cost.
Risks & watch-outs
- Watch-outs: HOA is 27% of rent.
- Climate carrying-cost: extreme-heat days projected 7→15/yr by 2055 (HVAC capex compounding) — expect insurance premiums to compound above CPI over the hold.
Questions for the listing agent
- What do current leases actually rent for vs. the listed asking? Can we see a recent rent roll and the last 12 months of T-12 income?
- It's been on market 67 days. Have you received any prior offers? Is the seller open to a 20% concession, seller financing, or rate buy-down credit?
- Built in 1966 — when were the roof, HVAC, electrical panel, plumbing, and water heater last replaced?
- What does the HOA fee cover, when was the last increase, and are there any pending special assessments or reserve-fund shortfalls?
- Any open or pending special assessments — roof, HVAC, plumbing, elevator, façade? What's the per-unit balance and payoff schedule, and is the seller paying it off at close or rolling it to the buyer?
- Why hasn't it sold? Are there any deal-killer items the seller is aware of (foundation, flood, title, zoning, code violations)?
- Is there a deadline driving the sale (1031 exchange, divorce, estate, relocation)? That informs how much negotiation room exists.
- Schools are D-rated, which usually means shorter tenancies and higher turnover. Who's the typical renter profile here, and what's been the actual vacancy rate?
- The area grade is low — what's the realistic commute time and amenity access for the typical tenant pool here? Any planned neighborhood developments (good or bad) we should know about?
- What's the average days-on-market for RENTAL listings here right now (not sales)? A rising rental-DOM trend means longer vacancies and softer asking-rent achievability than the comps imply.
- What's the recent tenant-quality profile in this submarket — average credit score on applications, eviction rate, late-payment / NSF rate, and stable-employment percentage? A property-management company in the area should have these aggregated.
- How much new apartment / multifamily construction is in the pipeline within 1–3 miles? Heavy new supply (>2% of stock underway) typically softens rents 12–24 months out; light construction supports rent growth.
Investment metrics
- 1% rule
- 0.99% ✗
- Cap rate
- 4.92%
- Cash-on-cash
- -4.89%
- DSCR
- 0.78
- GRM
- 8.5
CMA / ARV
- ARV (median comp)
- $177,965
- List price
- $149,000
- Delta
- -16.28%
- Verdict
- UNDERPRICED
- Comps
- 20 within 2.0 mi
Projected returns pro-forma
-3.0% appreciation · 0.0% rent growth · sell at horizon
- IRR
- -29.0%
- Equity multiple
- 0.06×
- Total profit
- $-39,071
- Equity at exit
- $22,216
- IRR
- -56.1%
- Equity multiple
- -0.53×
- Total profit
- $-63,757
- Equity at exit
- $12,883
Cash invested: $41,720 (down + closing). Projections, not guarantees.
Landlord ↔ Tenant lean methodology
- Overall (STATE)
- 27 Tenant-Leaning
- State Maryland
- 27 Tenant-Leaning · D+14
- County
- — inherits STATE
- City
- — inherits STATE
ZIP-level market 20705
- Rents YoY
- -0.9%
- Active inventory
- 88
- Price-to-rent
- 8.5×
Monthly cashflow live
- Estimated rent
- $1,468 medium interval (Pro) →
- Mortgage (P&I)
- −$781
- Tax from tax record
- −$93 /mo · $1,122/yr
- Insurance
- −$62
- HOA
- −$393
- Vacancy / Maint / Mgmt
- −$308
- Net cashflow
- $-170
Break-even live
UW: 25.0% down · 7.5% · 30yr · 1.5% tax · 5.0% vac · 8.0% maint · 8.0% mgmt
Financing live
Cash to close
- Down payment
- $37,250
- Closing costs
- $4,470
- Reserves months
- —
- Total cash needed
- —
Loan-product check · same deal, 3 products live
Conventional
25% down · 7.5% · 30yr
- Down + closing
- —
- Monthly P&I
- —
- Monthly cashflow
- —
- DSCR
- —
- Eligible?
- —
Personal DTI + credit; lowest rate.
DSCR
20% down · 8.5% · 30yr
- Down + closing
- —
- Monthly P&I
- —
- Monthly cashflow
- —
- DSCR
- —
- Eligible?
- —
No personal income docs; deal must DSCR.
Hard money
10% down · 12.0% · 12mo
- Down + closing
- —
- Monthly P&I
- —
- Monthly cashflow
- —
- DSCR
- —
- Eligible?
- —
Short-term bridge; refi at stabilization.
Rent comps 4 comps
| Address | Beds | Baths | Sqft | Rent | $/sqft | DOM | Units | Dist |
|---|---|---|---|---|---|---|---|---|
| 11457 Cherry Hill Rd Beltsville, MD | 1.0–3.0 | 1.0–2.0 | 959 | $1,470 | $1.53 | 18d | 10 | 0.21mi |
| 3598 Powder Mill Rd Beltsville, MD | 1.0–3.0 | 1.0–2.0 | 886 | $1,445 | $1.63 | 5d | 10 | 0.46mi |
| 12230 Longfield Dr Silver Spring, MD | 1.0–3.0 | 1.0–2.5 | 1756 | $2,020 | $1.15 | 2d | 17 | 1.06mi |
| 11932 Twinlakes Dr Beltsville, MD | 3.0 | 1.0–2.0 | 866 | $1,519 | $1.75 | 1d | 52 | 1.11mi |
HOA detail condo
- Monthly dues
- $393 · $4,716/yr
- Likely covers
- watergaselectric
- Assessments
- None detected in remarks — confirm with the listing agent.
Listing history 17 events
-
2026-06-18days on market $149,000 Active 67 DOM
-
2026-06-17pricedays on market $149,000 Active 66 DOM
-
2026-06-16days on market $150,000 Active 65 DOM
-
2026-06-15days on market $150,000 Active 64 DOM
-
2026-06-13days on market $150,000 Active 62 DOM
-
2026-06-09days on market $150,000 Active 58 DOM
-
2026-06-08days on market $150,000 Active 57 DOM
-
2026-06-07days on market $150,000 Active 56 DOM
-
2026-06-03days on market $150,000 Active 52 DOM
-
2026-06-02days on market $150,000 Active 51 DOM
-
2026-06-01days on market $150,000 Active 50 DOM
-
2026-05-31days on market $150,000 Active 49 DOM
-
2026-05-05price $150,000 228-char remark
Show marketing remark (228 chars)
Beautifully updated 1BR condo unit. Centrally located, modern flooring, newer kitchen, newer appliances, laundry room in building; available today. All Utilities (electric, gas, water) are all included in the moderate condo fee.
-
2026-04-21price $153,000 228-char remark
Show marketing remark (228 chars)
Beautifully updated 1BR condo unit. Centrally located, modern flooring, newer kitchen, newer appliances, laundry room in building; available today. All Utilities (electric, gas, water) are all included in the moderate condo fee.
-
2026-04-12$155,000 Active 228-char remark
Show marketing remark (228 chars)
Beautifully updated 1BR condo unit. Centrally located, modern flooring, newer kitchen, newer appliances, laundry room in building; available today. All Utilities (electric, gas, water) are all included in the moderate condo fee.
-
2026-01-21$1,380
-
2006-02-17soldstatus $115,000
ⓘ Source: listings_history table (triggers on properties + properties_extension) + one-shot
backfill from property_details.listing_events for pre-trigger history.
Tax reassessment forecast MD · Partial reset (capped growth)
- Current annual tax
- $1,122 · $93/mo
- Projected year-2 tax
- $1,373 · $114/mo
- Expected delta
- +$251/yr (+$21/mo · 22.4%)
ⓘ Screening estimate from a state-policy table — verify with the county assessor before closing.
Climate risk First Street
- Flood 1/10 Low FEMA zone X (unshaded) · 0% chance over 30 yrs
- Wildfire 1/10 Low
- Heat 7/10 Severe 7 d/yr ≥104°F today · 15 d/yr by 30 yrs out
- Wind 4/10 Moderate 16% chance of damaging wind over 30 yrs
- Air quality 4/10 Moderate 5 unhealthy d/yr today · 6 by 30 yrs out
Nearby sold comps map
Loading sold comps map…
Walkable amenities ~0.75 mi
Loading nearby amenities…
Taxation est. · year 1
- Rental income
- $17,619
- − Mortgage interest
- −$8,346
- − Property taxes
- −$1,122
- − Insurance
- −$745
- − Repairs & maintenance
- −$1,410
- − Management
- −$1,410
- − HOA
- −$4,716
- − Depreciation
- −$4,335
- Taxable loss
- −$4,464
- Est. tax savings @ 24.0%
- +$1,071
- After-tax cash flow
- $-969/yr
For passive investors: Depreciation is non-cash, so a rental often shows a tax loss while cash-flowing — sheltering income. Rental losses are passive: they offset passive income freely, and up to $25,000/yr can offset ordinary (W-2) income if you actively participate and your MAGI is under $100k (phasing out to $0 by $150k); unused losses carry forward. On sale, claimed depreciation is recaptured at up to 25%, and gains may owe capital-gains tax (a 1031 exchange can defer both). Figures are a year-1 estimate at your 24.0% rate — not tax advice; consult a CPA.
Schools (NCES district)
- District
- Montgomery County Public Schools
- NCES district ID
- 2400480
- Math proficiency
- 27% ▼ -21.00%
- Reading proficiency
- 45% ▼ -10.00%
- Median HH income
- $97,191
- Composite
- 35.62/100
- National rank
- #4889
- State rank
- #3 of 24 in MD
Livability — Calverton
- Score
- 68/100
- State rank
- #203
- US rank
- #9708
Category grades
Schools grade is shown separately in the Schools card above.
Census & demographics
- Census place
- Calverton, MD
- County
- Prince Georges County · 919,866 people
- Metro
- Washington-Arlington-Alexandria, DC-VA-MD-WV
- Population (ZIP)
- 28,713
- Household income
- $110,351
- Rent vs Own
- Severe rent burden
- 455.0
Population outlook (Montgomery County) Hauer SSP2
- Today (2025)
- 1,173,231 people
- By 2030
- 1,237,402 · +5.5%
- By 2040
- 1,365,115 · +16.4%
- By 2050
- 1,491,592 · +27.1%
- By 2075
- 1,803,893 · +53.8%
- By 2100
- 2,035,619 · +73.5%
Race, ethnicity, and origin ACS 2023
- Neighborhood character
- Highly diverse neighborhood (Simpson 0.71)
- Race & ethnicity
- Hispanic / Latino 38% Black 36% Asian 12% White 10% Two or more races 8%
- Hispanic origin (detail)
- Mexican 3% Dominican 1%
- Common ancestry
- Hispanic 1% Romanian 1% Slovak 1%
- Foreign-born
- 43% · Canada, China, Vietnam
- Languages at home
- 47% English-only · Spanish 32% Other Indo-European 4% French/Haitian/Cajun 2%
Political lean MEDSL · Montgomery
- 2024 margin
- Solid D (+53.3) · D 75.2% · R 21.9% · Other 2.9%
- 2008→2024 swing
- +8.7pp toward D · 2008: 44.6pp · 2024: 53.3pp
- All cycles
- 2024: D+53.3 2020: D+59.6 2016: D+55.5 2012: D+43.4 2008: D+44.6
Not yet ingested
- Civics
- —
Market trends
- HPI YoY
- ▼ -241.68%
- Current HPI
- 309.0138
- Rent YoY
- ▼ -0.94%
- Metro
- Washington-Arlington-Alexandria, DC-VA-MD-WV
- State GDP YoY
- ▲ 2.97%
- F500 in state
- 12
Industry mix (Fortune 500 HQ in MD)
| Industry | F500 HQs | Revenue |
|---|---|---|
| Aerospace / Defense | 1 | $71B |
|
||
| Utilities | 1 | $25B |
|
||
| Hotels | 1 | $24B |
|
||
| Consumer Goods | 1 | $7B |
|
||
| Real Estate | 1 | $6B |
|
||
| Chemicals | 1 | $2B |
|
||
Price history
+30.4% since first listed5 events — show timeline
- 2026-05-05 Price Changed $150,000 BRIGHT MLS
- 2026-04-21 Price Changed $153,000 BRIGHT MLS
- 2026-04-12 Listed $155,000 BRIGHT MLS
- 2026-01-21 Listed for Rent $1,380 BRIGHTMLS
- 2006-02-17 Sold (Public Records) $115,000 Public Records
Property tax history
+3.3%/yrLatest (2025): $1,122 · +5.0% YoY. Source: county tax records.
Cash-flow waterfall
monthlySold comps — $/sqft
last 12 mo · ≤1 miLoading sold comps…