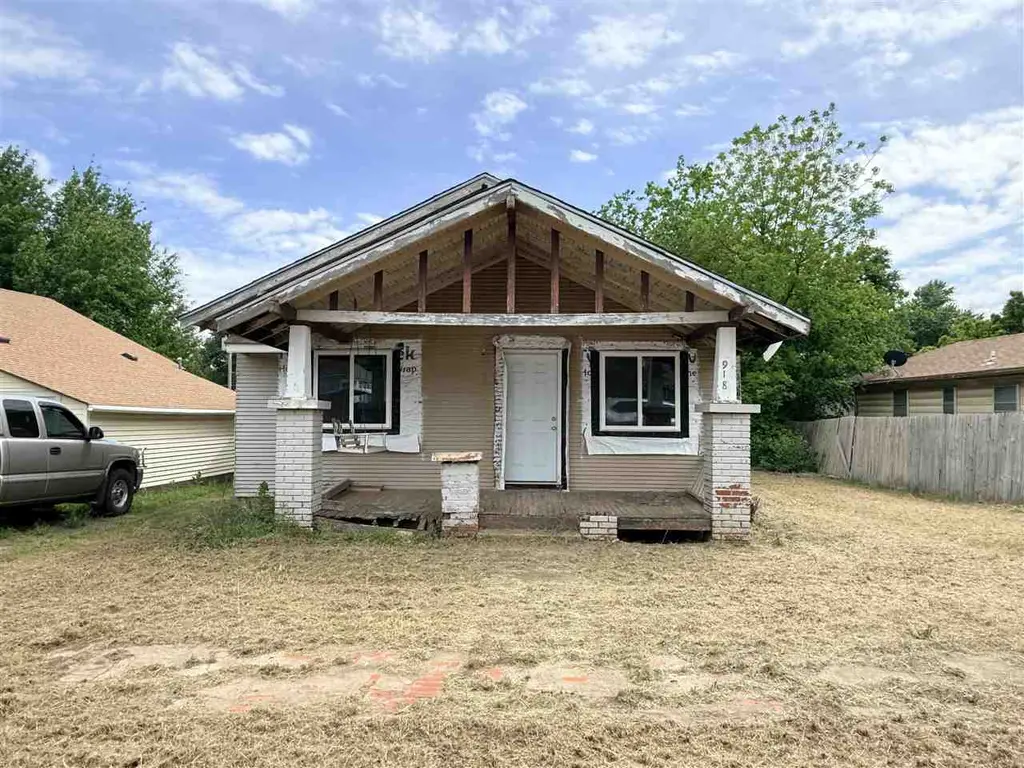
918 Holly · Perry, OK
Flood risk 1/10 · Minimal
- FEMA flood zone
- X (unshaded)
- Chance of flooding over 30 yrs
- 0.0%
- Est. flood insurance / yr
- $507 – $1,088
Fire risk 6/10 · Moderate
- Est. fire insurance / yr
- $2,463 – $4,575
Heat risk 6/10 · Moderate
- Hot days now (above 110°F)
- 7 days/yr
- Hot days in 30 yrs
- 19 days/yr
Wind risk 2/10 · Minimal
- Chance of severe wind over 30 yrs
- 2.0%
Air-quality risk 2/10 · Minimal
- Unhealthy air days now
- 1 days/yr
- Unhealthy air days in 30 yrs
- 2 days/yr
Risk factors via First Street. Map © Google.
Why this score? — see what drove the B- grade
The composite is a weighted blend of 9 inputs, each scored 0–100. Each bar is that input's sub-score; the figure is the points it added to the 100-point composite (weight × sub-score).
- Cash flow +30.0/30.0
- 1% rule +10.0/10.0
- DSCR +10.0/10.0
- ARV discount +7.5/15.0
- Livability +3.4/5.0
- Rent growth +2.5/5.0
- Condition / age +2.5/5.0
- Schools +2.2/10.0
- Appreciation +0.4/10.0
$25,000
🖨 Deal sheet (PDF) 📄 Offer letter ✓ Due diligence
Listing remarks MLS
FOR STATISTICAL PURPOSES ONLY. One Time Show & Sell Calling all investors, this one needs some LOVE!!!
Key facts
- Replaced the windows
- 8,150 sq ft lot
- Built 1930
Tags
Property features AI
Exterior
- Utilities: Public water; Public sewer
- Home design: Single-family residence; Residential property
- Exterior features: Lot dimensions approximately 50 x 163; Residential zoning (Perry)
Interior
- Bathrooms: 1 full bathroom
- Interior features: Spa / hot tub
Neighborhood map
What this means for you Summary
Snapshot
- This is a 2-bed/1.0-bath single-family listed at $25k.
Deal economics
- At list price, monthly cash flow is $547 ($7k/yr) — positive.
- The deal already cash-flows at list — no discount required.
- Meets the 1% rule at list price ($881 rent vs $25k).
- Recommended offer: $24k (3.0% below list) — sets the bar for market timing.
Location & tenants
- Location reads 68/100 on livability (#78 in OK) — a middle-class / working-renter tenant base. Strengths: cost of living A+, housing A+, crime A; Watch: employment C-, schools F, amenities F.
- Perry (rural): math 22% / reading 29% proficiency, ranked #102 of 270 in OK (top 38%) — low school quality limits family demand, transient renter base, plan for 1-2y turnover.
- Market conditions: 40 active listings in the ZIP; 4 units permitted in Noble County in 2024 (0 in 5+ unit buildings).
Forward outlook
- Local home prices are declining (-3.0%/yr); year-one equity from $173 of loan paydown is wiped out by about $750 of value loss. Plan a longer hold.
- Noble County population projected to shrink 4% by 2050 — rents likely to lag national; underwrite the cash flow, not the appreciation.
- At projected returns (-3.0% appreciation + 3.0% rent growth), your $7k cash investment doubles in ~2 years — after that, you're playing with house money.
Negotiation context
- It's been on market 51 days — a 3% lower offer ($24k) is reasonable based on typical stale-listing flexibility.
- 2 sale attempts since 6y ago with the ask held roughly flat each time — persistent listings suggest the price (not the market) is what's stuck; bring a comps-based counter.
- Current owner paid $8k; list at $25k implies a 233% gain — meaningful room to come down on a strong offer.
Risks & watch-outs
- Watch-outs: built in 1930 — expect roof / HVAC / electrical / plumbing capex.
- Climate carrying-cost: major wildfire risk; extreme-heat days projected 7→19/yr by 2055 (HVAC capex compounding) — expect insurance premiums to compound above CPI over the hold.
Questions for the listing agent
- It's been on market 51 days. Have you received any prior offers? Is the seller open to a 3% concession, seller financing, or rate buy-down credit?
- Built in 1930 — when were the roof, HVAC, electrical panel, plumbing, and water heater last replaced?
- Is there a deadline driving the sale (1031 exchange, divorce, estate, relocation)? That informs how much negotiation room exists.
- Schools are F-rated, which usually means shorter tenancies and higher turnover. Who's the typical renter profile here, and what's been the actual vacancy rate?
- What's the average days-on-market for RENTAL listings here right now (not sales)? A rising rental-DOM trend means longer vacancies and softer asking-rent achievability than the comps imply.
- What's the recent tenant-quality profile in this submarket — average credit score on applications, eviction rate, late-payment / NSF rate, and stable-employment percentage? A property-management company in the area should have these aggregated.
- How much new for-sale + rental construction is in the pipeline within 1–3 miles? Heavy new supply typically softens prices + rents 12–24 months out; constrained supply supports both.
Investment metrics
- 1% rule
- 3.53% ✓
- Cap rate
- 32.56%
- Cash-on-cash
- 93.82%
- DSCR
- 5.17
- GRM
- 2.4
CMA / ARV
- ARV (on-the-fly)
- $113,620
- Comps found
- 12
Show comp detail 12 sales within ~0.75 mi
| Address | Dist | Beds/Ba | Sqft | Sold | Price | $/sf | Match |
|---|---|---|---|---|---|---|---|
| 902 N 14th | 0.35mi | 2/1.0 | 1,001 (+1%) | 2mo | $115,000 | $115 | 80 |
| 1203 Elm | 0.30mi | 2/1.0 | 1,014 (+3%) | 18mo | $108,000 | $107 | 66 |
| 1106 Locust | 0.36mi | 2/1.0 | 891 (-10%) | 2mo | $115,000 | $129 | 66 |
| 409 N 11th St | 0.31mi | 2/1.0 | 888 (-10%) | 4mo | $109,000 | $123 | 65 |
| 1010 N 5th St | 0.58mi | 2/1.0 | 906 (-8%) | 1mo | $74,777 | $83 | 58 |
| 1313 Fir St | 0.35mi | 3/1.0 (+1) | 1,076 (+9%) | 7mo | $47,500 | $44 | 58 |
| 730 Holly St | 0.16mi | 3/2.0 (+1) | 1,101 (+11%) | 12mo | $178,000 | $162 | 54 |
| 303 Grove St | 0.70mi | 2/1.0 | 924 (-6%) | 9mo | $21,000 | $23 | 49 |
| 1107 N 7th St | 0.40mi | 3/1.0 (+1) | 1,107 (+12%) | 12mo | $135,000 | $122 | 46 |
| 1107 N 13th | 0.41mi | 3/1.0 (+1) | 1,111 (+12%) | 12mo | $110,000 | $99 | 45 |
| 1107 Jackson St | 0.23mi | 3/2.0 (+1) | 1,125 (+14%) | 15mo | $125,000 | $111 | 45 |
| 222 N 13th St | 0.50mi | 2/2.0 | 867 (-12%) | 10mo | $154,900 | $179 | 44 |
Match score weights: distance 35% · size 25% · config 20% · recency 20%. Top-matched comps best support the ARV.
Projected returns pro-forma
-3.0% appreciation · 3.0% rent growth · sell at horizon
- IRR
- 94.6%
- Equity multiple
- 5.40×
- Total profit
- $30,806
- Equity at exit
- $3,728
- IRR
- 97.4%
- Equity multiple
- 11.24×
- Total profit
- $71,705
- Equity at exit
- $2,162
Cash invested: $7,000 (down + closing). Projections, not guarantees.
Landlord ↔ Tenant lean methodology
- Overall (STATE)
- 83 Strongly Landlord-Friendly
- State Oklahoma
- 83 Strongly Landlord-Friendly · R+20
- County
- — inherits STATE
- City
- — inherits STATE
ZIP-level market 73077
- Home prices YoY
- -3.9%
- Active inventory
- 40
- Price-to-rent
- 2.4×
Monthly cashflow live
- Estimated rent
- $881 medium interval (Pro) →
- Mortgage (P&I)
- −$131
- Tax from tax record
- −$7 /mo · $89/yr
- Insurance
- −$10
- HOA
- −$0
- Vacancy / Maint / Mgmt
- −$185
- Net cashflow
- $547
Break-even live
Sensitivity live
| Price | -10% $561 | -5% $554 | +0% $547 | +5% $540 | +10% $533 |
|---|---|---|---|---|---|
| Rent | -10% $478 | -5% $512 | +0% $547 | +5% $582 | +10% $617 |
| Rate | -1.0pp $560 | -0.5pp $554 | base $547 | +0.5pp $541 | +1.0pp $534 |
UW: 25.0% down · 7.5% · 30yr · 1.5% tax · 5.0% vac · 8.0% maint · 8.0% mgmt
Financing live
Cash to close
- Down payment
- $6,250
- Closing costs
- $750
- Reserves months
- —
- Total cash needed
- —
Loan-product check · same deal, 3 products live
Conventional
25% down · 7.5% · 30yr
- Down + closing
- —
- Monthly P&I
- —
- Monthly cashflow
- —
- DSCR
- —
- Eligible?
- —
Personal DTI + credit; lowest rate.
DSCR
20% down · 8.5% · 30yr
- Down + closing
- —
- Monthly P&I
- —
- Monthly cashflow
- —
- DSCR
- —
- Eligible?
- —
No personal income docs; deal must DSCR.
Hard money
10% down · 12.0% · 12mo
- Down + closing
- —
- Monthly P&I
- —
- Monthly cashflow
- —
- DSCR
- —
- Eligible?
- —
Short-term bridge; refi at stabilization.
Listing history 20 events
-
2026-06-19days on market $25,000 Active 51 DOM
-
2026-06-18days on market $25,000 Active 50 DOM
-
2026-06-17days on market $25,000 Active 49 DOM
-
2026-06-16days on market $25,000 Active 48 DOM
-
2026-06-15days on market $25,000 Active 47 DOM
-
2026-06-14days on market $25,000 Active 45 DOM
-
2026-06-13days on market $25,000 Active 44 DOM
-
2026-06-10days on market $25,000 Active 42 DOM
-
2026-06-09days on market $25,000 Active 41 DOM
-
2026-06-08days on market $25,000 Active 40 DOM
-
2026-06-07days on market $25,000 Active 39 DOM
-
2026-06-03days on market $25,000 Active 35 DOM
-
2026-06-02days on market $25,000 Active 34 DOM
-
2026-06-01days on market $25,000 Active 33 DOM
-
2026-05-31days on market $25,000 Active 32 DOM
-
2026-05-30days on market $25,000 Active 31 DOM
-
2026-04-29$25,000 Active
-
2020-04-01soldstatus $7,500 Closed 109-char remark
Show marketing remark (109 chars)
FOR STATISTICAL PURPOSES ONLY. One Time Show & Sell Calling all investors, this one needs some LOVE!!!
-
2020-02-28$7,500 Active 109-char remark
Show marketing remark (109 chars)
FOR STATISTICAL PURPOSES ONLY. One Time Show & Sell Calling all investors, this one needs some LOVE!!!
-
2009-10-26soldstatus $15,000
ⓘ Source: listings_history table (triggers on properties + properties_extension) + one-shot
backfill from property_details.listing_events for pre-trigger history.
Tax reassessment forecast OK · Resets to sale price
- Current annual tax
- $89 · $7/mo
- Projected year-2 tax
- $225 · $19/mo
- Expected delta
- +$136/yr (+$11/mo · 152.8%)
ⓘ Screening estimate from a state-policy table — verify with the county assessor before closing.
Climate risk First Street
- Flood 1/10 Low FEMA zone X (unshaded) · 0% chance over 30 yrs
- Wildfire 6/10 Major
- Heat 6/10 Major 7 d/yr ≥110°F today · 19 d/yr by 30 yrs out
- Wind 2/10 Low 2% chance of damaging wind over 30 yrs
- Air quality 2/10 Low 1 unhealthy d/yr today · 2 by 30 yrs out
Nearby sold comps map
Loading sold comps map…
Walkable amenities ~0.75 mi
Loading nearby amenities…
Taxation est. · year 1
- Rental income
- $10,576
- − Mortgage interest
- −$1,400
- − Property taxes
- −$89
- − Insurance
- −$125
- − Repairs & maintenance
- −$846
- − Management
- −$846
- − Depreciation
- −$727
- Taxable income
- $6,542
- Est. tax owed @ 24.0%
- −$1,570
- After-tax cash flow
- $4,998/yr
For passive investors: Depreciation is non-cash, so a rental often shows a tax loss while cash-flowing — sheltering income. Rental losses are passive: they offset passive income freely, and up to $25,000/yr can offset ordinary (W-2) income if you actively participate and your MAGI is under $100k (phasing out to $0 by $150k); unused losses carry forward. On sale, claimed depreciation is recaptured at up to 25%, and gains may owe capital-gains tax (a 1031 exchange can defer both). Figures are a year-1 estimate at your 24.0% rate — not tax advice; consult a CPA.
Schools (NCES district)
- District
- Perry
- NCES district ID
- 4023850
- Math proficiency
- 22% ▼ -7.00%
- Reading proficiency
- 29% ▼ -6.00%
- Median HH income
- $43,886
- Composite
- 21.86/100
- National rank
- #8239
- State rank
- #102 of 270 in OK
Livability — Perry
- Score
- 68/100
- State rank
- #78
- US rank
- #10029
Category grades
Schools grade is shown separately in the Schools card above.
Census & demographics
- Census place
- Perry, OK
- Population (ZIP)
- 6,235
Population outlook (Noble County) Hauer SSP2
- Today (2025)
- 11,554 people
- By 2030
- 11,506 · -0.4%
- By 2040
- 11,345 · -1.8%
- By 2050
- 11,128 · -3.7%
- By 2075
- 10,658 · -7.8%
- By 2100
- 9,623 · -16.7%
Race, ethnicity, and origin ACS 2023
- Neighborhood character
- Predominantly White (87%)
- Race & ethnicity
- White 87% Two or more races 7% Hispanic / Latino 3% Black 2% Native American 1%
- Common ancestry
- Lithuanian 3% Iranian 2% Italian 2%
- Foreign-born
- 0%
- Languages at home
- 99% English-only · Spanish 1%
Political lean MEDSL · Noble
- 2024 margin
- Solid R (+57.4) · D 20.4% · R 77.7% · Other 1.9%
- 2008→2024 swing
- -3.8pp toward R · 2008: -53.6pp · 2024: -57.4pp
- All cycles
- 2024: R+57.4 2020: R+57.1 2016: R+57.6 2012: R+50.6 2008: R+53.6
Not yet ingested
- Civics
- —
Market trends
- HPI YoY
- ▼ -9.14%
- Current HPI
- 227.4711
- Rent YoY
- —
- Metro
- —
- State GDP YoY
- ▲ 1.55%
- F500 in state
- 6
Industry mix (Fortune 500 HQ in OK)
| Industry | F500 HQs | Revenue |
|---|---|---|
| Energy | 3 | $48B |
|
||
Price history
+66.7% since first listed4 events — show timeline
- 2026-04-29 Listed $25,000 SBOR
- 2020-04-01 Sold (MLS) $7,500 NWOAR
- 2020-02-28 Listed $7,500 NWOAR
- 2009-10-26 Sold (Public Records) $15,000 Public Records
Property tax history
-4.7%/yrLatest (2025): $89 · +1.1% YoY. Source: county tax records.
Cash-flow waterfall
monthlySold comps — $/sqft
last 12 mo · ≤1 miLoading sold comps…