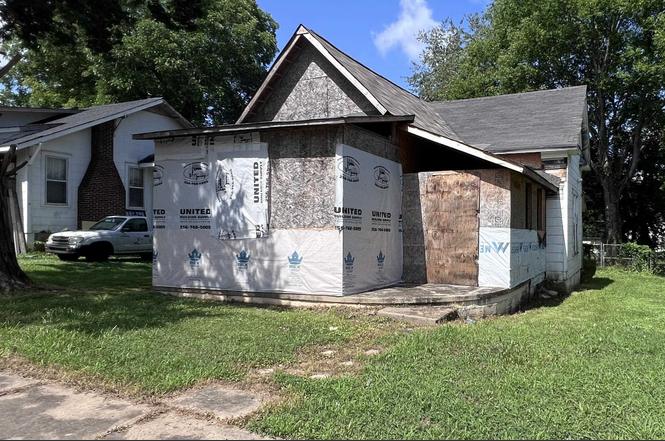
609 Annapolis Ave · Sheffield, AL
Flood risk 1/10 · Minimal
- FEMA flood zone
- X (unshaded)
- Chance of flooding over 30 yrs
- 0.0%
- Est. flood insurance / yr
- $507 – $1,088
Fire risk 3/10 · Minor
- Est. fire insurance / yr
- $916 – $1,700
Heat risk 6/10 · Moderate
- Hot days now (above 108°F)
- 7 days/yr
- Hot days in 30 yrs
- 20 days/yr
Wind risk 4/10 · Minor
- Chance of severe wind over 30 yrs
- 21.0%
Air-quality risk 2/10 · Minimal
- Unhealthy air days now
- 0 days/yr
- Unhealthy air days in 30 yrs
- 1 days/yr
Risk factors via First Street. Map © Google.
Why this score? — see what drove the B- grade
The composite is a weighted blend of 9 inputs, each scored 0–100. Each bar is that input's sub-score; the figure is the points it added to the 100-point composite (weight × sub-score).
- Cash flow +30.0/30.0
- 1% rule +10.0/10.0
- DSCR +10.0/10.0
- ARV discount +7.5/15.0
- Livability +3.0/5.0
- Rent growth +2.5/5.0
- Condition / age +2.5/5.0
- Schools +1.9/10.0
- Appreciation +0.0/10.0
$35,000
🖨 Deal sheet 📄 Offer letter ✓ Due diligence
Listing remarks
The Seller is storing building materials inside the house, which include several cabinets, dishwasher -- ALL stored items do not convey. No appointment is needed. House is unlocked. Use extreme caution when walking inside the house. No lockbox. Owner has not occupied the property.
Key facts
- 7,405 sq ft lot
- Built 1925
- Listed 8 days
Property features AI
Finance
- Other: Directions: From Hatch Blvd., turn right onto Annapolis Ave.; house is on the left
- Financial info: Tax amount listed
Exterior
- Utilities: Sewer: Unknown
- Home design: Single-family residence (residential property); Fixer condition
- Construction: Lot roughly 50' x 150' (0.17 acres); Zoned R1; Above-grade finished living area approx. 1,420
- Exterior features: Sidewalks
Interior
- Bedrooms: Three main-level bedrooms
- Bathrooms: Two full bathrooms, both on the main level
- Interior features: One fireplace; Nine total rooms
Neighborhood map
What this means for you Summary
Snapshot
- This is a 3-bed/2.0-bath single-family listed at $35k.
Deal economics
- At list price, monthly cash flow is $624 ($7k/yr) — positive.
- The deal already cash-flows at list — no discount required.
- Meets the 1% rule at list price ($1k rent vs $35k).
- Cap rate 27.7% vs local median 5.1% in Sheffield — top-decile yield for the area; either an underpriced asset or a hidden risk that comps aren't pricing in. Stress-test before assuming the spread holds.
Location & tenants
- Location reads 60/100 on livability (#312 in AL) — a middle-class / working-renter tenant base. Strengths: cost of living A+, housing A+; Watch: crime F, amenities F, commute F.
- Sheffield City (suburban): math 12% / reading 34% proficiency, ranked #103 of 129 in AL (top 80%) — low school quality limits family demand, transient renter base, plan for 1-2y turnover; 74% free/reduced lunch — lower-income household profile, screen leases tightly.
- Zoned schools: Wa Threadgill Primary School (304 students, 70% FRL); Sheffield High School (math 15% / reading 15%, grade F, #212 of 305 statewide, top 70%, 278 students, 66% FRL).
- Market conditions: 115 active listings in the ZIP; 3 comparable units currently listed for rent nearby; rentals lingering (median 44d on market — plan ~5-8 weeks vacancy on turnover, expect pricing pressure); 100% of comp listings sitting > 30 days — soft ceiling on asking rent; 91 units permitted in Colbert County in 2024 (0 in 5+ unit buildings).
Forward outlook
- Local home prices are declining (-3.0%/yr); year-one equity from $242 of loan paydown is wiped out by about $1k of value loss. Plan a longer hold.
- Colbert County population projected to shrink 7% by 2050 — rents likely to lag national; underwrite the cash flow, not the appreciation.
- At projected returns (-3.0% appreciation + 3.0% rent growth), your $10k cash investment doubles in ~2 years — after that, you're playing with house money.
Negotiation context
- Only 9 days on market — expect competitive offers; lowballing is unlikely to land.
- 5 sale attempts since 18y ago with the ask held roughly flat each time — persistent listings suggest the price (not the market) is what's stuck; bring a comps-based counter.
- Current owner paid $20k; list at $35k implies a 75% gain — meaningful room to come down on a strong offer.
Risks & watch-outs
- Watch-outs: built in 1925 — expect roof / HVAC / electrical / plumbing capex.
- Climate carrying-cost: extreme-heat days projected 7→20/yr by 2055 (HVAC capex compounding) — expect insurance premiums to compound above CPI over the hold.
Questions for the listing agent
- Built in 1925 — when were the roof, HVAC, electrical panel, plumbing, and water heater last replaced?
- Is there a deadline driving the sale (1031 exchange, divorce, estate, relocation)? That informs how much negotiation room exists.
- Schools are F-rated, which usually means shorter tenancies and higher turnover. Who's the typical renter profile here, and what's been the actual vacancy rate?
- Crime grade is F in this area — have there been break-ins, vandalism, or insurance claims at this property in the last 3 years? What carrier currently insures it and at what premium?
- What's the average days-on-market for RENTAL listings here right now (not sales)? A rising rental-DOM trend means longer vacancies and softer asking-rent achievability than the comps imply.
- What's the recent tenant-quality profile in this submarket — average credit score on applications, eviction rate, late-payment / NSF rate, and stable-employment percentage? A property-management company in the area should have these aggregated.
- How much new for-sale + rental construction is in the pipeline within 1–3 miles? Heavy new supply typically softens prices + rents 12–24 months out; constrained supply supports both.
Investment metrics
- 1% rule
- 2.99% ✓
- Cap rate
- 27.67%
- Cash-on-cash
- 76.36%
- DSCR
- 4.40
- GRM
- 2.8
CMA / ARV
- ARV (on-the-fly)
- $123,540
- Comps found
- 12
Show comp detail 12 sales within ~0.75 mi
| Address | Dist | Beds/Ba | Sqft | Sold | Price | $/sf | Match |
|---|---|---|---|---|---|---|---|
| 607 E 12th St | 0.40mi | 3/2.0 | 1,368 (-4%) | 3mo | $140,000 | $102 | 73 |
| 1506 E 28th St | 0.35mi | 3/2.0 | 1,512 (+6%) | 4mo | $125,000 | $83 | 70 |
| 606 N Nashville Ave | 0.18mi | 3/2.0 | 1,563 (+10%) | 6mo | $158,000 | $101 | 70 |
| 1203 N Nashville Ave | 0.44mi | 3/2.0 | 1,562 (+10%) | 5mo | $135,900 | $87 | 59 |
| 1217 Greer St | 0.72mi | 3/1.5 | 1,386 (-2%) | 2mo | $182,900 | $132 | 58 |
| 2612 E 17th Ave | 0.19mi | 3/1.0 | 1,210 (-15%) | 8mo | $71,550 | $59 | 56 |
| 503 Austin Ave | 0.41mi | 3/1.0 | 1,274 (-10%) | 6mo | $98,000 | $77 | 55 |
| 1510 E 29th St | 0.45mi | 3/1.0 | 1,279 (-10%) | 5mo | $128,400 | $100 | 54 |
| 1803 33rd St E | 0.73mi | 3/2.0 | 1,367 (-4%) | 8mo | $75,000 | $55 | 53 |
| 1305 Gordon Dr | 0.47mi | 3/2.0 | 1,212 (-15%) | 1mo | $80,000 | $66 | 52 |
| 401 St Louis Ave | 0.60mi | 3/2.0 | 1,218 (-14%) | 3mo | $165,000 | $135 | 46 |
| 805 Alabama Ave | 0.51mi | 2/1.0 (-1) | 1,597 (+12%) | 5mo | $113,990 | $71 | 42 |
Match score weights: distance 35% · size 25% · config 20% · recency 20%. Top-matched comps best support the ARV.
Projected returns pro-forma
-3.0% appreciation · 3.0% rent growth · sell at horizon
- IRR
- 76.3%
- Equity multiple
- 4.47×
- Total profit
- $34,039
- Equity at exit
- $5,219
- IRR
- 79.9%
- Equity multiple
- 9.24×
- Total profit
- $80,754
- Equity at exit
- $3,026
Cash invested: $9,800 (down + closing). Projections, not guarantees.
Landlord ↔ Tenant lean methodology
- Overall (STATE)
- 90 Strongly Landlord-Friendly
- State Alabama
- 90 Strongly Landlord-Friendly · R+15
- County
- — inherits STATE
- City
- — inherits STATE
ZIP-level market 35660
- Home prices YoY
- -29.5%
- Active inventory
- 115
- Price-to-rent
- 2.8×
Monthly cashflow live
- Estimated rent
- $1,048 medium interval (Pro) →
- Mortgage (P&I)
- −$184
- Tax from tax record
- −$6 /mo · $75/yr
- Insurance
- −$15
- HOA
- −$0
- Vacancy / Maint / Mgmt
- −$220
- Net cashflow
- $624
Break-even live
UW: 25.0% down · 7.5% · 30yr · 1.5% tax · 5.0% vac · 8.0% maint · 8.0% mgmt
Financing live
Cash to close
- Down payment
- $8,750
- Closing costs
- $1,050
- Reserves months
- —
- Total cash needed
- —
Loan-product check · same deal, 3 products live
Conventional
25% down · 7.5% · 30yr
- Down + closing
- —
- Monthly P&I
- —
- Monthly cashflow
- —
- DSCR
- —
- Eligible?
- —
Personal DTI + credit; lowest rate.
DSCR
20% down · 8.5% · 30yr
- Down + closing
- —
- Monthly P&I
- —
- Monthly cashflow
- —
- DSCR
- —
- Eligible?
- —
No personal income docs; deal must DSCR.
Hard money
10% down · 12.0% · 12mo
- Down + closing
- —
- Monthly P&I
- —
- Monthly cashflow
- —
- DSCR
- —
- Eligible?
- —
Short-term bridge; refi at stabilization.
Rent comps 3 comps
| Address | Beds | Baths | Sqft | Rent | $/sqft | DOM | Units | Dist |
|---|---|---|---|---|---|---|---|---|
| 1010 N Nashville Ave Sheffield, AL | 2.0 | 2.0 | 1200 | $1,100 | $0.92 | 44d | 1 | 0.32mi |
| 3323 Oakwood Blvd Sheffield, AL | 2.0 | 1.0 | 1100 | $1,000 | $0.91 | 44d | 1 | 0.93mi |
| 100 Brink Ct Sheffield, AL | 2.0 | 2.0 | 1100 | $899 | $0.82 | 44d | 5 | 1.17mi |
Listing history 8 events
-
2026-06-19days on market $35,000 Active 9 DOM
-
2026-06-18days on market $35,000 Active 8 DOM
-
2026-06-17days on market $35,000 Active 7 DOM
-
2026-06-16days on market $35,000 Active 6 DOM
-
2026-06-15days on market $35,000 Active 5 DOM
-
2026-06-14days on market $35,000 Active 3 DOM
-
2026-06-13remarks 281-char remark
-
2026-06-13$35,000 Active 2 DOM
ⓘ Source: listings_history table (triggers on properties + properties_extension) + one-shot
backfill from property_details.listing_events for pre-trigger history.
Tax reassessment forecast AL · Resets to sale price
- Current annual tax
- $75 · $6/mo
- Projected year-2 tax
- $144 · $12/mo
- Expected delta
- +$68/yr (+$6/mo · 90.8%)
ⓘ Screening estimate from a state-policy table — verify with the county assessor before closing.
Climate risk First Street
- Flood 1/10 Low FEMA zone X (unshaded) · 0% chance over 30 yrs
- Wildfire 3/10 Moderate
- Heat 6/10 Major 7 d/yr ≥108°F today · 20 d/yr by 30 yrs out
- Wind 4/10 Moderate 21% chance of damaging wind over 30 yrs
- Air quality 2/10 Low 0 unhealthy d/yr today · 1 by 30 yrs out
Nearby sold comps map
Loading sold comps map…
Walkable amenities ~0.75 mi
Loading nearby amenities…
Taxation est. · year 1
- Rental income
- $12,577
- − Mortgage interest
- −$1,961
- − Property taxes
- −$75
- − Insurance
- −$175
- − Repairs & maintenance
- −$1,006
- − Management
- −$1,006
- − Depreciation
- −$1,018
- Taxable income
- $7,336
- Est. tax owed @ 24.0%
- −$1,761
- After-tax cash flow
- $5,723/yr
For passive investors: Depreciation is non-cash, so a rental often shows a tax loss while cash-flowing — sheltering income. Rental losses are passive: they offset passive income freely, and up to $25,000/yr can offset ordinary (W-2) income if you actively participate and your MAGI is under $100k (phasing out to $0 by $150k); unused losses carry forward. On sale, claimed depreciation is recaptured at up to 25%, and gains may owe capital-gains tax (a 1031 exchange can defer both). Figures are a year-1 estimate at your 24.0% rate — not tax advice; consult a CPA.
Schools (NCES district)
- District
- Sheffield City
- NCES district ID
- 0103000
- Math proficiency
- 12% ▼ -30.00%
- Reading proficiency
- 34% ▼ -1.00%
- Median HH income
- $34,188
- Composite
- 18.8/100
- National rank
- #8866
- State rank
- #103 of 129 in AL
Livability — Sheffield
- Score
- 60/100
- State rank
- #312
- US rank
- #19366
Category grades
Schools grade is shown separately in the Schools card above.
Census & demographics
- Census place
- Sheffield, AL
- City population
- 9,385
- Population (ZIP)
- 9,385
Population outlook (Colbert County) Hauer SSP2
- Today (2025)
- 54,154 people
- By 2030
- 53,746 · -0.8%
- By 2040
- 52,431 · -3.2%
- By 2050
- 50,303 · -7.1%
- By 2075
- 44,789 · -17.3%
- By 2100
- 36,676 · -32.3%
Race, ethnicity, and origin ACS 2023
- Neighborhood character
- Predominantly White (68%)
- Race & ethnicity
- White 68% Black 26% Two or more races 4% Hispanic / Latino 2%
- Common ancestry
- Slovak 1% Lithuanian 1% Serbian 1%
- Foreign-born
- 1% · Canada
- Languages at home
- 98% English-only · Spanish 2%
Political lean MEDSL · Colbert
- 2024 margin
- Solid R (+46.4) · D 26.4% · R 72.8%
- 2008→2024 swing
- -26.2pp toward R · 2008: -20.3pp · 2024: -46.4pp
- All cycles
- 2024: R+46.4 2020: R+38.9 2016: R+38.3 2012: R+20.4 2008: R+20.3
Not yet ingested
- Civics
- —
Market trends
- HPI YoY
- ▼ -74.23%
- Current HPI
- 177.3226
- Rent YoY
- —
- Metro
- —
- State GDP YoY
- ▲ 2.94%
- F500 in state
- 4
Industry mix (Fortune 500 HQ in AL)
| Industry | F500 HQs | Revenue |
|---|---|---|
| Financial Services | 1 | $8B |
|
||
| Healthcare | 1 | $5B |
|
||
Price history
-46.1% since first listed8 events — show timeline
- 2026-06-10 Listed $35,000 SAARMLS
- 2024-04-16 Price Changed $7,500 SAARMLS
- 2024-03-26 Listed $9,900 SAARMLS
- 2014-10-28 Sold (MLS) $20,000 SAARMLS
- 2014-03-22 Listed $28,000 SAARMLS
- 2009-03-09 Sold (MLS) $54,650 SAARMLS
- 2008-11-03 Listed $59,900 SAARMLS
- 2008-04-25 Listed $64,900 SAARMLS
Property tax history
-9.0%/yrLatest (2025): $75 · +5.8% YoY. Source: county tax records.
Cash-flow waterfall
monthlySold comps — $/sqft
last 12 mo · ≤1 miLoading sold comps…