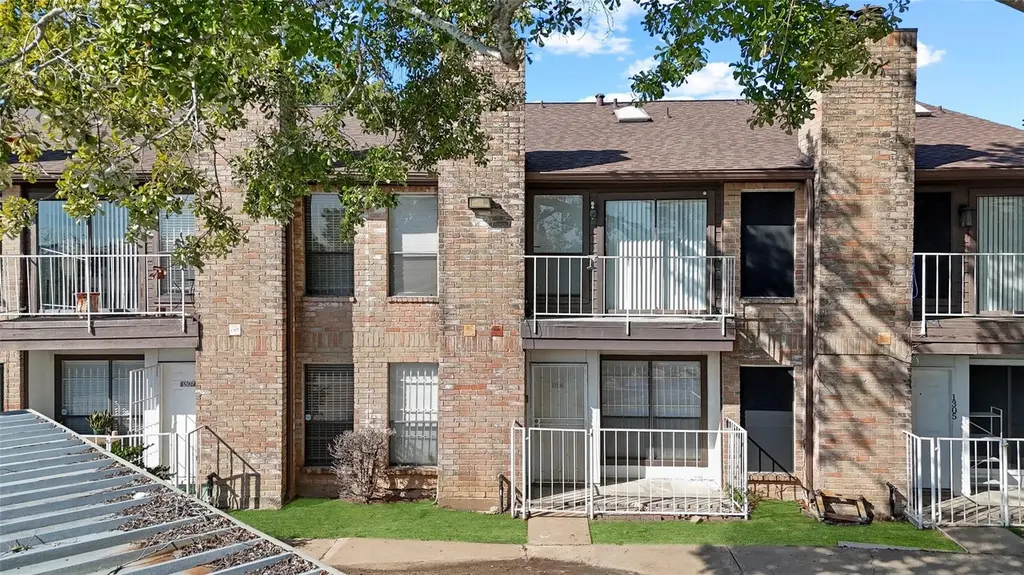
6633 W Airport Blvd #812 · Houston, TX
Flood risk 4/10 · Minor
- FEMA flood zone
- X (shaded)
- Chance of flooding over 30 yrs
- 0.22%
- Est. flood insurance / yr
- $507 – $1,088
Fire risk 1/10 · Minimal
- Est. fire insurance / yr
- $1,222 – $2,270
Heat risk 9/10 · Severe
- Hot days now (above 110°F)
- 7 days/yr
- Hot days in 30 yrs
- 24 days/yr
Wind risk 9/10 · Severe
- Chance of severe wind over 30 yrs
- 99.0%
Air-quality risk 3/10 · Minor
- Unhealthy air days now
- 2 days/yr
- Unhealthy air days in 30 yrs
- 3 days/yr
Risk factors via First Street. Map © Google.
Why this score? — see what drove the B- grade
The composite is a weighted blend of 9 inputs, each scored 0–100. Each bar is that input's sub-score; the figure is the points it added to the 100-point composite (weight × sub-score).
- Cash flow +30.0/30.0
- 1% rule +10.0/10.0
- DSCR +10.0/10.0
- ARV discount +7.5/15.0
- Livability +3.7/5.0
- Schools +2.7/10.0
- Rent growth +2.5/5.0
- Condition / age +2.5/5.0
- Appreciation +0.0/10.0
$66,900
🖨 Deal sheet 📄 Offer letter ✓ Due diligence
Listing remarks
BEST DEAL IN THIS CONDO COMPLEX. Fully renovated upper-level corner-unit condo in a gated community, priced to sell fast. This 2-bedroom, 2-bathroom unit features an open and functional layout, spacious bedrooms, updated laminate wood flooring, and a private balcony off the living room. The living room also includes a cozy fireplace, creating a comfortable space to relax and enjoy the home. Refrigerator and stove are included, and the unit has washer and dryer connections for added convenience. The property also comes with a carport that fits two cars and is currently vacant, making it ready for its next owner or investor. Per seller, the property has never flooded. Buyer is responsible for
Key facts
- $50 HOA
- Garage
- Community pool
Neighborhood map
What this means for you Summary
Snapshot
- This is a 2-bed/2.0-bath condo listed at $67k.
Deal economics
- At list price, monthly cash flow is $307 ($4k/yr) — positive.
- The deal already cash-flows at list — no discount required.
- Meets the 1% rule at list price ($1k rent vs $67k).
- Recommended offer: $66k (1.5% below list) — sets the bar for market timing.
- Cap rate 11.8% vs local median 3.2% in Houston — top-decile yield for the area; either an underpriced asset or a hidden risk that comps aren't pricing in. Stress-test before assuming the spread holds.
Location & tenants
- Location reads 74/100 on livability (#184 in TX, #4,771 nationally) — a middle-class / working-renter tenant base. Strengths: amenities A+, cost of living A+, housing A+; Watch: crime F.
- Houston ISD (urban): math 27% / reading 35% proficiency, ranked #593 of 826 in TX (top 72%) — families likely to look elsewhere, expect single-tenant / working-renter base with shorter leases; 71% free/reduced lunch — lower-income household profile, screen leases tightly.
- Zoned schools: Fondren Middle (math 13% / reading 20%, grade F, #1,536 of 1,662 statewide, top 93%, 840 students, 99% FRL); Westbury H S (math 19% / reading 31%, grade F, #1,250 of 1,632 statewide, top 77%, 2,243 students, 92% FRL) — zoned schools average 95% FRL vs 71% district-wide (24 pts higher); higher-poverty schools than district average — tighter screening recommended.
- Market conditions: Rents flat; 199 active listings in the ZIP; 40 comparable units currently listed for rent nearby; rentals at typical pace (median 22d on market — plan ~3-4 weeks tenant-placement turnaround); 45% of comp listings sitting > 30 days — soft ceiling on asking rent; 29,883 units permitted in Harris County in 2024 (8,621 in 5+ unit buildings).
Forward outlook
- Local home prices are declining (-3.0%/yr); year-one equity from $463 of loan paydown is wiped out by about $2k of value loss. Plan a longer hold.
- Harris County population projected at +47% by 2050 — long-run rental-demand tailwind backs the buy-and-hold thesis.
- At projected returns (-3.0% appreciation + 0.0% rent growth), your $19k cash investment doubles in ~9 years — after that, you're playing with house money.
Negotiation context
- It's been on market 19 days — a 2% lower offer ($66k) is reasonable based on typical stale-listing flexibility.
- 12 sale attempts since 21y ago; this cycle's ask has dropped $12k (15%) from the opening price — seller is motivated, your offer sets the floor, not the list.
Risks & watch-outs
- Watch-outs: property tax is 2.8% of price.
- Climate carrying-cost: severe wind risk, 99% chance of damaging wind over 30y; extreme-heat days projected 7→24/yr by 2055 (HVAC capex compounding) — expect insurance premiums to compound above CPI over the hold.
Questions for the listing agent
- Property tax is high relative to price — has the assessment been appealed recently, and will the sale trigger a re-assessment?
- What does the HOA fee cover, when was the last increase, and are there any pending special assessments or reserve-fund shortfalls?
- Any open or pending special assessments — roof, HVAC, plumbing, elevator, façade? What's the per-unit balance and payoff schedule, and is the seller paying it off at close or rolling it to the buyer?
- Is there a deadline driving the sale (1031 exchange, divorce, estate, relocation)? That informs how much negotiation room exists.
- Schools are D-rated, which usually means shorter tenancies and higher turnover. Who's the typical renter profile here, and what's been the actual vacancy rate?
- Crime grade is F in this area — have there been break-ins, vandalism, or insurance claims at this property in the last 3 years? What carrier currently insures it and at what premium?
- What's the average days-on-market for RENTAL listings here right now (not sales)? A rising rental-DOM trend means longer vacancies and softer asking-rent achievability than the comps imply.
- What's the recent tenant-quality profile in this submarket — average credit score on applications, eviction rate, late-payment / NSF rate, and stable-employment percentage? A property-management company in the area should have these aggregated.
- How much new apartment / multifamily construction is in the pipeline within 1–3 miles? Heavy new supply (>2% of stock underway) typically softens rents 12–24 months out; light construction supports rent growth.
Investment metrics
- 1% rule
- 1.69% ✓
- Cap rate
- 11.79%
- Cash-on-cash
- 19.64%
- DSCR
- 1.87
- GRM
- 4.9
CMA / ARV
No comps found within radius.
Projected returns pro-forma
-3.0% appreciation · 0.02% rent growth · sell at horizon
- IRR
- 7.8%
- Equity multiple
- 1.29×
- Total profit
- $5,492
- Equity at exit
- $9,975
- IRR
- 13.9%
- Equity multiple
- 1.94×
- Total profit
- $17,605
- Equity at exit
- $5,784
Cash invested: $18,732 (down + closing). Projections, not guarantees.
Landlord ↔ Tenant lean methodology
- Overall (STATE)
- 87 Strongly Landlord-Friendly
- State Texas
- 87 Strongly Landlord-Friendly · R+5
- County
- — inherits STATE
- City
- — inherits STATE
ZIP-level market 77035
- Rents YoY
- 0.0%
- Active inventory
- 199
- Price-to-rent
- 4.9×
Monthly cashflow live
- Estimated rent
- $1,127 high interval (Pro) →
- Mortgage (P&I)
- −$351
- Tax from tax record
- −$155 /mo · $1,865/yr
- Insurance
- −$28
- HOA
- −$50
- Vacancy / Maint / Mgmt
- −$237
- Net cashflow
- $307
Break-even live
UW: 25.0% down · 7.5% · 30yr · 1.5% tax · 5.0% vac · 8.0% maint · 8.0% mgmt
Financing live
Cash to close
- Down payment
- $16,725
- Closing costs
- $2,007
- Reserves months
- —
- Total cash needed
- —
Loan-product check · same deal, 3 products live
Conventional
25% down · 7.5% · 30yr
- Down + closing
- —
- Monthly P&I
- —
- Monthly cashflow
- —
- DSCR
- —
- Eligible?
- —
Personal DTI + credit; lowest rate.
DSCR
20% down · 8.5% · 30yr
- Down + closing
- —
- Monthly P&I
- —
- Monthly cashflow
- —
- DSCR
- —
- Eligible?
- —
No personal income docs; deal must DSCR.
Hard money
10% down · 12.0% · 12mo
- Down + closing
- —
- Monthly P&I
- —
- Monthly cashflow
- —
- DSCR
- —
- Eligible?
- —
Short-term bridge; refi at stabilization.
Rent comps 40 comps
| Address | Beds | Baths | Sqft | Rent | $/sqft | DOM | Units | Dist |
|---|---|---|---|---|---|---|---|---|
| 6633 W Airport Blvd Houston, TX | 1.0–2.0 | 1.5–2.0 | 1063 | $1,200 | $1.13 | 43d | 2 | 0.05mi |
| 12247 Sunset Meadow Ln Houston, TX | 1.0–3.0 | 1.0–2.0 | 990 | $1,392 | $1.41 | 3d | 1 | 0.16mi |
| 12271 Fondren Rd Houston, TX | 2.0 | 2.0 | 1007 | $1,050 | $1.04 | 22d | 1 | 0.17mi |
| 12271 Fondren Rd Houston, TX | 2.0 | 2.0 | 1007 | $1,050 | $1.04 | 18d | 1 | 0.17mi |
| 12245 Sunset Meadow Ln Houston, TX | 3.0 | 2.0 | 1257 | $1,515 | $1.21 | 43d | 1 | 0.17mi |
| 12500 Sandpiper Dr Houston, TX | 2.0 | 1.0–2.0 | 1018 | $1,094 | $1.07 | 43d | 6 | 0.20mi |
| 12211 Fondren Rd Houston, TX | 1.0–2.0 | 1.0–2.0 | 817 | $1,249 | $1.53 | 2d | 20 | 0.21mi |
| 6363 W Airport Blvd Unit 622 Houston, TX | 2.0 | 2.0 | 946 | $974 | $1.03 | 16d | 1 | 0.24mi |
| 6363 W Airport Blvd Houston, TX | 2.0 | 1.0–2.0 | 744 | $985 | $1.32 | 7d | 1 | 0.26mi |
| 6392 Peacock Hills Dr Houston, TX | 2.0 | 2.0 | 1244 | $1,400 | $1.13 | 43d | 1 | 0.28mi |
| 14550 Fonmeadow Dr Houston, TX | 1.0–2.0 | 1.0–2.0 | 1057 | $1,350 | $1.28 | 43d | 2 | 0.29mi |
| 6363 W Airport Blvd Apt 1823 Houston, TX | 2.0 | 1.0 | 875 | $790 | $0.90 | 43d | 1 | 0.31mi |
| 6363 W Airport Blvd Unit 2224 Houston, TX | 2.0 | 2.0 | 1033 | $985 | $0.95 | 16d | 1 | 0.31mi |
| 6363 W Airport Blvd Apt 721 Houston, TX | 2.0 | 1.0 | 940 | $875 | $0.93 | 43d | 1 | 0.31mi |
| 6363 W Airport Blvd Unit 528 Houston, TX | 1.0 | 1.0 | 728 | $650 | $0.89 | 16d | 1 | 0.31mi |
| 6363 W Airport Blvd Apt 2123 Houston, TX | 2.0 | 1.0 | 794 | $695 | $0.88 | 43d | 1 | 0.31mi |
| 12261 Fondren Rd Houston, TX | 2.0 | 2.0 | 1066 | $1,200 | $1.13 | 43d | 1 | 0.32mi |
| 12107 Fondren Rd Houston, TX | 2.0 | 2.0 | 990 | $1,125 | $1.14 | 24d | 1 | 0.32mi |
| 12351 Bob White Dr Houston, TX | 2.0 | 2.0 | 1000 | $987 | $0.99 | 43d | 1 | 0.39mi |
| 12351 Bob White Dr Houston, TX | 2.0 | 2.0 | 1000 | $987 | $0.99 | 13d | 1 | 0.39mi |
| 7706 W Airport Blvd Houston, TX | 2.0 | 1.0 | 875 | $1,080 | $1.23 | 43d | 1 | 0.42mi |
| 7700 W Airport Blvd Unit 7757 Houston, TX | 2.0 | 2.0 | 1005 | $1,232 | $1.23 | 14d | 1 | 0.43mi |
| 6319 Southwood Ct N Houston, TX | 3.0 | 1.0 | 1102 | $1,450 | $1.32 | 43d | 1 | 0.44mi |
| 12101 Fondren Rd Houston, TX | 1.0–2.0 | 1.0–2.0 | 790 | $1,198 | $1.52 | 43d | 23 | 0.47mi |
| 12500 Dunlap St Houston, TX | 1.0–3.0 | 1.0–2.0 | 907 | $970 | $1.07 | 2d | 57 | 0.63mi |
| 20 Alvarado Dr Houston, TX | 2.0 | 2.0 | 938 | $997 | $1.06 | 20d | 1 | 0.74mi |
| 20 Alvarado Dr Houston, TX | 2.0 | 2.0 | 938 | $997 | $1.06 | 43d | 1 | 0.74mi |
| 8030 W Airport Blvd Houston, TX | 1.0–2.0 | 1.0–2.0 | 780 | $1,044 | $1.34 | 1d | 31 | 0.86mi |
| 12800 Dunlap St Houston, TX | 1.0–3.0 | 1.0–2.0 | 851 | $1,012 | $1.19 | 1d | 62 | 0.89mi |
| 12202 Ormandy St Unit 12202 Houston, TX | 2.0 | 1.5 | 1352 | $1,200 | $0.89 | 4d | 1 | 0.91mi |
| 12214 Ormandy St Unit 12214 Houston, TX | 2.0 | 1.5 | 1352 | $1,200 | $0.89 | 4d | 1 | 0.92mi |
| 7809 Wolfield Ln Houston, TX | 2.0 | 2.0 | 1208 | $1,390 | $1.15 | 43d | 1 | 1.00mi |
| 8300 W Airport Blvd Houston, TX | 1.0–2.0 | 1.0–2.0 | 780 | $1,130 | $1.45 | 14d | 1 | 1.01mi |
| 1024 Sandpiper Dr Houston, TX | 1.0 | 1.0 | 711 | $910 | $1.28 | 43d | 1 | 1.02mi |
| 6 Sandpiper Dr Houston, TX | 3.0 | 2.0 | 993 | $1,225 | $1.23 | 12d | 1 | 1.03mi |
| 6 Sandpiper Dr Houston, TX | 3.0 | 2.0 | 993 | $1,225 | $1.23 | 43d | 1 | 1.03mi |
| 6 Sandpiper Dr Houston, TX | 2.0 | 2.0 | 960 | $1,094 | $1.14 | 18d | 1 | 1.03mi |
| 6 Sandpiper Dr Houston, TX | 2.0 | 2.0 | 960 | $1,094 | $1.14 | 22d | 1 | 1.03mi |
| 10925 Fondren Rd Houston, TX | 1.0 | 1.0 | 700 | $874 | $1.25 | 43d | 1 | 1.22mi |
| 8201 W Bellfort Ave Unit 2162 Houston, TX | 2.0 | 2.0 | 848 | $955 | $1.13 | 5d | 1 | 1.22mi |
HOA detail condo
- Monthly dues
- $50 · $600/yr
- Likely covers
- security
- Assessments
- None detected in remarks — confirm with the listing agent.
Listing history 12 events
-
2026-06-18days on market $66,900 Coming Soon 19 DOM
-
2026-06-17days on market $66,900 Coming Soon 18 DOM
-
2026-06-16days on market $66,900 Coming Soon 17 DOM
-
2026-06-15days on market $66,900 Coming Soon 16 DOM
-
2026-06-13days on market $66,900 Coming Soon 14 DOM
-
2026-06-09days on market $66,900 Coming Soon 10 DOM
-
2026-06-08days on market $66,900 Coming Soon 9 DOM
-
2026-06-07days on market $66,900 Coming Soon 8 DOM
-
2026-06-04days on market $66,900 Coming Soon 5 DOM
-
2026-06-03days on market $66,900 Coming Soon 4 DOM
-
2026-06-02days on market $66,900 Coming Soon 3 DOM
-
2026-06-01days on market $66,900 Coming Soon 2 DOM
ⓘ Source: listings_history table (triggers on properties + properties_extension) + one-shot
backfill from property_details.listing_events for pre-trigger history.
Tax reassessment forecast TX · Resets to sale price
- Current annual tax
- $1,865 · $155/mo
- Projected year-2 tax
- $1,865 · $155/mo
- Expected delta
- $0/yr ($0/mo · 0.0%)
ⓘ Screening estimate from a state-policy table — verify with the county assessor before closing.
Climate risk First Street
- Flood 4/10 Moderate FEMA zone X (shaded) · 22% chance over 30 yrs
- Wildfire 1/10 Low
- Heat 9/10 Extreme 7 d/yr ≥110°F today · 24 d/yr by 30 yrs out
- Wind 9/10 Extreme 99% chance of damaging wind over 30 yrs
- Air quality 3/10 Moderate 2 unhealthy d/yr today · 3 by 30 yrs out
Nearby sold comps map
Loading sold comps map…
Walkable amenities ~0.75 mi
Loading nearby amenities…
Taxation est. · year 1
- Rental income
- $13,528
- − Mortgage interest
- −$3,747
- − Property taxes
- −$1,865
- − Insurance
- −$334
- − Repairs & maintenance
- −$1,082
- − Management
- −$1,082
- − HOA
- −$600
- − Depreciation
- −$1,946
- Taxable income
- $2,871
- Est. tax owed @ 24.0%
- −$689
- After-tax cash flow
- $2,989/yr
For passive investors: Depreciation is non-cash, so a rental often shows a tax loss while cash-flowing — sheltering income. Rental losses are passive: they offset passive income freely, and up to $25,000/yr can offset ordinary (W-2) income if you actively participate and your MAGI is under $100k (phasing out to $0 by $150k); unused losses carry forward. On sale, claimed depreciation is recaptured at up to 25%, and gains may owe capital-gains tax (a 1031 exchange can defer both). Figures are a year-1 estimate at your 24.0% rate — not tax advice; consult a CPA.
Schools (NCES district)
- District
- Houston ISD
- NCES district ID
- 4823640
- Math proficiency
- 27% ▼ -18.00%
- Reading proficiency
- 35% ▼ -6.00%
- Median HH income
- $46,054
- Composite
- 26.63/100
- National rank
- #7173
- State rank
- #593 of 826 in TX
Livability — Houston
- Score
- 74/100
- State rank
- #184
- US rank
- #4771
Category grades
Schools grade is shown separately in the Schools card above.
Census & demographics
- Census place
- Houston, TX
- County
- Harris County · 4,702,590 people
- City population
- 3,226,434
- Metro
- Houston-The Woodlands-Sugar Land, TX
- Population (ZIP)
- 36,019
- Household income
- $58,686
- Rent vs Own
- Severe rent burden
- 2844.0
Population outlook (Harris County) Hauer SSP2
- Today (2025)
- 5,571,493 people
- By 2030
- 6,089,821 · +9.3%
- By 2040
- 7,142,806 · +28.2%
- By 2050
- 8,185,864 · +46.9%
- By 2075
- 10,574,329 · +89.8%
- By 2100
- 12,109,958 · +117.4%
Race, ethnicity, and origin ACS 2023
- Neighborhood character
- Diverse neighborhood (Simpson 0.68)
- Race & ethnicity
- Hispanic / Latino 42% Black 29% White 23% Two or more races 19% Asian 2%
- Hispanic origin (detail)
- Mexican 26%
- Common ancestry
- Lithuanian 2% Italian 1% Serbian 1%
- Foreign-born
- 26% · Canada, China
- Languages at home
- 56% English-only · Spanish 37% French/Haitian/Cajun 1% Other Asian/Pacific 1%
Political lean MEDSL · Harris
- 2024 margin
- Lean D (+5.5) · D 52.0% · R 46.4% · Other 1.6%
- 2008→2024 swing
- +3.9pp toward D · 2008: 1.6pp · 2024: 5.5pp
- All cycles
- 2024: D+5.5 2020: D+13.3 2016: D+12.4 2012: D+0.1 2008: D+1.6
Not yet ingested
- Civics
- —
Market trends
- HPI YoY
- ▼ -145.44%
- Current HPI
- 266.5195
- Rent YoY
- ▬ 0.02%
- Metro
- Houston-The Woodlands-Sugar Land, TX
- State GDP YoY
- ▲ 3.95%
- F500 in state
- 110
Industry mix (Fortune 500 HQ in TX)
| Industry | F500 HQs | Revenue |
|---|---|---|
| Energy | 16 | $1,198B |
|
||
| Technology | 5 | $198B |
|
||
| Engineering / Construction | 4 | $72B |
|
||
| Energy Services | 3 | $60B |
|
||
| Utilities | 3 | $41B |
|
||
| Healthcare | 2 | $330B |
|
||
Price history
+102.7% since first listed42 events — show timeline
- 2026-05-30 Coming Soon $66,900 HARMLS
- 2026-02-09 Sold (Public Records) — Public Records
- 2025-11-14 Pending — HARMLS
- 2025-11-10 Pending — HARMLS
- 2025-11-09 Listing Removed — HARMLS
- 2025-09-06 Price Changed $68,997 HARMLS
- 2025-04-28 Price Changed $69,000 HARMLS
- 2024-12-07 Price Changed $85,000 HARMLS
- 2024-12-07 Relisted — HARMLS
- 2024-09-24 Listing Removed — HARMLS
- 2024-08-28 Listed $79,000 HARMLS
- 2021-03-25 Listing Removed — HARMLS
- 2021-03-23 Listed $64,500 HARMLS
- 2014-03-06 Sold (Public Records) — Public Records
- 2014-03-01 Listing Removed — HARMLS
- 2014-02-28 Sold (MLS) — HARMLS
- 2014-02-27 Pending — HARMLS
- 2014-02-14 Pending — HARMLS
- 2014-02-06 Pending — HARMLS
- 2014-02-04 Pending — HARMLS
- 2014-01-23 Pending — HARMLS
- 2014-01-16 Relisted — HARMLS
- 2014-01-13 Listing Removed — HARMLS
- 2013-09-07 Relisted — HARMLS
- 2013-08-30 Pending — HARMLS
- 2013-08-10 Listed $26,500 HARMLS
- 2013-04-06 Listing Removed — HARMLS
- 2012-12-28 Relisted — HARMLS
- 2012-12-18 Listing Removed — HARMLS
- 2012-12-06 Listed $26,500 HARMLS
- 2012-09-21 Listing Removed — HARMLS
- 2012-03-21 Listed $26,900 HARMLS
- 2008-04-16 Sold (Public Records) — Public Records
- 2008-01-01 Listing Removed — HARMLS
- 2007-10-04 Listed $27,900 HARMLS
- 2007-10-03 Listing Removed — HARMLS
- 2006-11-01 Listed $27,500 HARMLS
- 2006-07-18 Sold (Public Records) — Public Records
- 2005-08-28 Listing Removed — HARMLS
- 2005-02-28 Listed $33,000 HARMLS
- 2001-04-09 Sold (Public Records) — Public Records
- 2001-04-02 Sold (Public Records) — Public Records
Property tax history
+4.6%/yrLatest (2025): $1,865 · +1.5% YoY. Source: county tax records.
Cash-flow waterfall
monthlySold comps — $/sqft
last 12 mo · ≤1 miLoading sold comps…