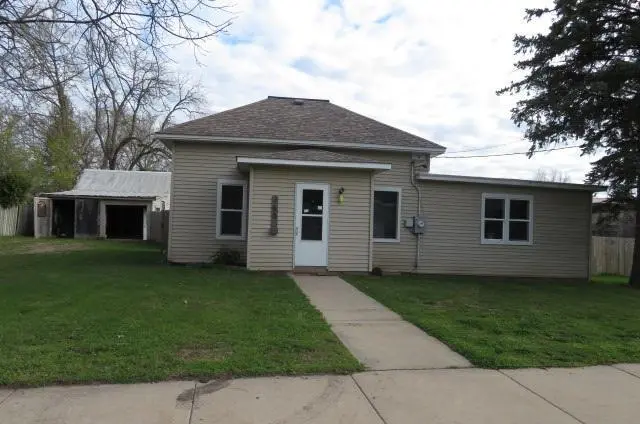
150 Harrison St W · Annandale, MN
Flood risk 1/10 · Minimal
- FEMA flood zone
- —
- Chance of flooding over 30 yrs
- 0.0%
- Est. flood insurance / yr
- —
Fire risk 1/10 · Minimal
- Est. fire insurance / yr
- $888 – $1,650
Heat risk 2/10 · Minimal
- Hot days now (above 98°F)
- 7 days/yr
- Hot days in 30 yrs
- 14 days/yr
Wind risk 2/10 · Minimal
- Chance of severe wind over 30 yrs
- —
Air-quality risk 2/10 · Minimal
- Unhealthy air days now
- 2 days/yr
- Unhealthy air days in 30 yrs
- 2 days/yr
Risk factors via First Street. Map © Google.
Why this score? — see what drove the C grade
The composite is a weighted blend of 9 inputs, each scored 0–100. Each bar is that input's sub-score; the figure is the points it added to the 100-point composite (weight × sub-score).
- Cash flow +22.7/30.0
- ARV discount +7.5/15.0
- DSCR +7.3/10.0
- 1% rule +5.5/10.0
- Schools +5.2/10.0
- Livability +3.7/5.0
- Rent growth +2.5/5.0
- Condition / age +2.5/5.0
- Appreciation +0.0/10.0
$159,900
🖨 Deal sheet 📄 Offer letter ✓ Due diligence
Listing remarks MLS
Rambler on a corner lot with three bedrooms on the main floor and a two-car detached garage. The home includes a fenced backyard and offers a simple, functional layout.
Key facts
- Functional layout
- Fenced backyard
- Corner lot
Tags
Neighborhood map
What this means for you Summary
Snapshot
- This is a 3-bed/1.0-bath single-family listed at $160k.
Deal economics
- At list price, monthly cash flow is $275 ($3k/yr) — positive.
- The deal already cash-flows at list — no discount required.
- Meets the 1% rule at list price ($2k rent vs $160k).
- Recommended offer: $146k (9.0% below list) — sets the bar for market timing.
- Cap rate 8.4% vs local median 2.6% in Annandale — top-decile yield for the area; either an underpriced asset or a hidden risk that comps aren't pricing in. Stress-test before assuming the spread holds.
Location & tenants
- Location reads 74/100 on livability (#211 in MN, #4,399 nationally) — a middle-class / working-renter tenant base. Strengths: crime A+, cost of living A+, housing A+; Watch: amenities F, commute F.
- Annandale Public School District (town): math 57% / reading 64% proficiency, ranked #38 of 301 in MN (top 13%) — acceptable for families but not a draw, mixed tenant base, ~2y average lease; only 17% free/reduced lunch — higher-income household profile.
- Market conditions: 102 active listings in the ZIP; 2 comparable units currently listed for rent nearby; 1,260 units permitted in Wright County in 2024 (180 in 5+ unit buildings).
Forward outlook
- Local home prices are declining (-3.0%/yr); year-one equity from $1k of loan paydown is wiped out by about $5k of value loss. Plan a longer hold.
- Wright County population projected at +9% by 2050 — modest demand growth; plan on rents tracking national, not racing it.
Negotiation context
- It's been on market 104 days — a 9% lower offer ($146k) is reasonable based on typical stale-listing flexibility.
- 10 sale attempts since 29y ago; this cycle's ask has dropped $40k (20%) from the opening price — seller is motivated, your offer sets the floor, not the list.
Risks & watch-outs
- Watch-outs: built in 1898 — expect roof / HVAC / electrical / plumbing capex.
Questions for the listing agent
- It's been on market 104 days. Have you received any prior offers? Is the seller open to a 9% concession, seller financing, or rate buy-down credit?
- Built in 1898 — when were the roof, HVAC, electrical panel, plumbing, and water heater last replaced?
- Why hasn't it sold? Are there any deal-killer items the seller is aware of (foundation, flood, title, zoning, code violations)?
- Is there a deadline driving the sale (1031 exchange, divorce, estate, relocation)? That informs how much negotiation room exists.
- What's the average days-on-market for RENTAL listings here right now (not sales)? A rising rental-DOM trend means longer vacancies and softer asking-rent achievability than the comps imply.
- What's the recent tenant-quality profile in this submarket — average credit score on applications, eviction rate, late-payment / NSF rate, and stable-employment percentage? A property-management company in the area should have these aggregated.
- How much new for-sale + rental construction is in the pipeline within 1–3 miles? Heavy new supply typically softens prices + rents 12–24 months out; constrained supply supports both.
Investment metrics
- 1% rule
- 1.05% ✓
- Cap rate
- 8.36%
- Cash-on-cash
- 7.38%
- DSCR
- 1.33
- GRM
- 8.0
CMA / ARV
No comps found within radius.
Projected returns pro-forma
-3.0% appreciation · 3.0% rent growth · sell at horizon
- IRR
- -5.0%
- Equity multiple
- 0.81×
- Total profit
- $-8,376
- Equity at exit
- $23,842
- IRR
- 4.6%
- Equity multiple
- 1.34×
- Total profit
- $15,255
- Equity at exit
- $13,825
Cash invested: $44,772 (down + closing). Projections, not guarantees.
Landlord ↔ Tenant lean methodology
- Overall (STATE)
- 46 Balanced
- State Minnesota
- 46 Balanced · D+2
- County
- — inherits STATE
- City
- — inherits STATE
ZIP-level market 55302
- Home prices YoY
- -20.4%
- Active inventory
- 102
- Price-to-rent
- 8.0×
Monthly cashflow live
- Estimated rent
- $1,674 medium interval (Pro) →
- Mortgage (P&I)
- −$839
- Tax from tax record
- −$142 /mo · $1,700/yr
- Insurance
- −$67
- HOA
- −$0
- Vacancy / Maint / Mgmt
- −$351
- Net cashflow
- $275
Break-even live
UW: 25.0% down · 7.5% · 30yr · 1.5% tax · 5.0% vac · 8.0% maint · 8.0% mgmt
Financing live
Cash to close
- Down payment
- $39,975
- Closing costs
- $4,797
- Reserves months
- —
- Total cash needed
- —
Loan-product check · same deal, 3 products live
Conventional
25% down · 7.5% · 30yr
- Down + closing
- —
- Monthly P&I
- —
- Monthly cashflow
- —
- DSCR
- —
- Eligible?
- —
Personal DTI + credit; lowest rate.
DSCR
20% down · 8.5% · 30yr
- Down + closing
- —
- Monthly P&I
- —
- Monthly cashflow
- —
- DSCR
- —
- Eligible?
- —
No personal income docs; deal must DSCR.
Hard money
10% down · 12.0% · 12mo
- Down + closing
- —
- Monthly P&I
- —
- Monthly cashflow
- —
- DSCR
- —
- Eligible?
- —
Short-term bridge; refi at stabilization.
Rent comps 2 comps
| Address | Beds | Baths | Sqft | Rent | $/sqft | DOM | Units | Dist |
|---|---|---|---|---|---|---|---|---|
| 160 Ash St E Annandale, MN | 1.0–2.0 | 1.0–2.0 | 854 | $1,635 | $1.91 | 1d | 6 | 0.30mi |
| 140 Park St E Annandale, MN | 4.0 | 1.5 | 1152 | $1,724 | $1.50 | 14d | 1 | 0.39mi |
Listing history 33 events
-
2026-05-19status Pending 168-char remark
Show marketing remark (168 chars)
Rambler on a corner lot with three bedrooms on the main floor and a two-car detached garage. The home includes a fenced backyard and offers a simple, functional layout.
-
2026-05-07historical Contingent - Inspection 168-char remark
Show marketing remark (168 chars)
Rambler on a corner lot with three bedrooms on the main floor and a two-car detached garage. The home includes a fenced backyard and offers a simple, functional layout.
-
2026-04-23price $159,900 168-char remark
Show marketing remark (168 chars)
Rambler on a corner lot with three bedrooms on the main floor and a two-car detached garage. The home includes a fenced backyard and offers a simple, functional layout.
-
2026-03-25price $175,000 168-char remark
Show marketing remark (168 chars)
Rambler on a corner lot with three bedrooms on the main floor and a two-car detached garage. The home includes a fenced backyard and offers a simple, functional layout.
-
2026-03-18price $184,900 168-char remark
Show marketing remark (168 chars)
Rambler on a corner lot with three bedrooms on the main floor and a two-car detached garage. The home includes a fenced backyard and offers a simple, functional layout.
-
2026-03-16status Active 168-char remark
Show marketing remark (168 chars)
Rambler on a corner lot with three bedrooms on the main floor and a two-car detached garage. The home includes a fenced backyard and offers a simple, functional layout.
-
2026-02-24status Pending 168-char remark
Show marketing remark (168 chars)
Rambler on a corner lot with three bedrooms on the main floor and a two-car detached garage. The home includes a fenced backyard and offers a simple, functional layout.
-
2026-02-13historical Contingent - Inspection 168-char remark
Show marketing remark (168 chars)
Rambler on a corner lot with three bedrooms on the main floor and a two-car detached garage. The home includes a fenced backyard and offers a simple, functional layout.
-
2026-01-14$200,000 Active 168-char remark
Show marketing remark (168 chars)
Rambler on a corner lot with three bedrooms on the main floor and a two-car detached garage. The home includes a fenced backyard and offers a simple, functional layout.
-
2025-03-03status Active
-
2025-03-01historical Contingent - Inspection
-
2025-02-19$214,900 Active
-
2025-02-19historical
-
2024-12-17price $219,900
-
2024-10-04$225,000 Active
-
2022-10-31soldstatus $210,000
-
2022-10-28soldstatus $210,000 Sold
-
2022-09-19status Pending
-
2022-09-15historical Contingent - Inspection
-
2022-08-26$199,950 Active
-
2022-08-23historical $199,950
-
2017-08-31historical
-
2017-08-16price $109,900
-
2017-06-22$119,000 Active
-
2003-05-28soldstatus $35,189
-
2002-05-14historical
-
2001-11-14$119,900
-
1998-11-13historical
-
1998-05-13$77,500
-
1997-06-12soldstatus $41,000
-
1997-06-10historical
-
1997-03-10$46,900
-
1995-01-03soldstatus $36,000
ⓘ Source: listings_history table (triggers on properties + properties_extension) + one-shot
backfill from property_details.listing_events for pre-trigger history.
Tax reassessment forecast MN · Partial reset (capped growth)
- Current annual tax
- $1,700 · $142/mo
- Projected year-2 tax
- $1,745 · $145/mo
- Expected delta
- +$45/yr (+$4/mo · 2.7%)
ⓘ Screening estimate from a state-policy table — verify with the county assessor before closing.
Climate risk First Street
- Flood 1/10 Low 0% chance over 30 yrs
- Wildfire 1/10 Low
- Heat 2/10 Low 7 d/yr ≥98°F today · 14 d/yr by 30 yrs out
- Wind 2/10 Low
- Air quality 2/10 Low 2 unhealthy d/yr today · 2 by 30 yrs out
Nearby sold comps map
Loading sold comps map…
Walkable amenities ~0.75 mi
Loading nearby amenities…
Taxation est. · year 1
- Rental income
- $20,085
- − Mortgage interest
- −$8,957
- − Property taxes
- −$1,700
- − Insurance
- −$800
- − Repairs & maintenance
- −$1,607
- − Management
- −$1,607
- − Depreciation
- −$4,652
- Taxable income
- $764
- Est. tax owed @ 24.0%
- −$183
- After-tax cash flow
- $3,122/yr
For passive investors: Depreciation is non-cash, so a rental often shows a tax loss while cash-flowing — sheltering income. Rental losses are passive: they offset passive income freely, and up to $25,000/yr can offset ordinary (W-2) income if you actively participate and your MAGI is under $100k (phasing out to $0 by $150k); unused losses carry forward. On sale, claimed depreciation is recaptured at up to 25%, and gains may owe capital-gains tax (a 1031 exchange can defer both). Figures are a year-1 estimate at your 24.0% rate — not tax advice; consult a CPA.
Schools (NCES district)
- District
- Annandale Public School District
- NCES district ID
- 2703150
- Math proficiency
- 57% ▼ -8.00%
- Reading proficiency
- 64% ▼ -3.00%
- Median HH income
- $59,330
- Composite
- 52.36/100
- National rank
- #1586
- State rank
- #38 of 301 in MN
Livability — Annandale
- Score
- 74/100
- State rank
- #211
- US rank
- #4399
Category grades
Schools grade is shown separately in the Schools card above.
Census & demographics
- Census place
- Annandale, MN
- Population (ZIP)
- 7,348
Population outlook (Wright County) Hauer SSP2
- Today (2025)
- 142,526 people
- By 2030
- 146,915 · +3.1%
- By 2040
- 153,625 · +7.8%
- By 2050
- 155,416 · +9.0%
- By 2075
- 150,352 · +5.5%
- By 2100
- 130,631 · -8.3%
Race, ethnicity, and origin ACS 2023
- Neighborhood character
- Predominantly White (94%)
- Race & ethnicity
- White 94% Two or more races 5%
- Common ancestry
- Portuguese 14% Lithuanian 5% Romanian 4%
- Foreign-born
- 1%
- Languages at home
- 98% English-only · Spanish 2%
Political lean MEDSL · Wright
- 2024 margin
- Strong R (+29.4) · D 34.4% · R 63.8% · Other 1.8%
- 2008→2024 swing
- -11.9pp toward R · 2008: -17.4pp · 2024: -29.4pp
- All cycles
- 2024: R+29.4 2020: R+28.6 2016: R+33.2 2012: R+21.4 2008: R+17.4
Not yet ingested
- Civics
- —
Market trends
- HPI YoY
- ▼ -74.45%
- Current HPI
- 289.7359
- Rent YoY
- —
- Metro
- —
- State GDP YoY
- ▲ 2.41%
- F500 in state
- 34
Industry mix (Fortune 500 HQ in MN)
| Industry | F500 HQs | Revenue |
|---|---|---|
| Healthcare | 2 | $407B |
|
||
| Retail | 2 | $150B |
|
||
| Consumer Goods | 2 | $32B |
|
||
| Industrial Machinery | 2 | $6B |
|
||
| Agriculture | 1 | $40B |
|
||
| Healthcare / Medical Devices | 1 | $32B |
|
||
Price history
+344.2% since first listed33 events — show timeline
- 2026-05-19 Pending — NORTHSTARMLS as Distributed by MLS Grid
- 2026-05-07 Contingent — NORTHSTARMLS as Distributed by MLS Grid
- 2026-04-23 Price Changed $159,900 NORTHSTARMLS as Distributed by MLS Grid
- 2026-03-25 Price Changed $175,000 NORTHSTARMLS as Distributed by MLS Grid
- 2026-03-18 Price Changed $184,900 NORTHSTARMLS as Distributed by MLS Grid
- 2026-03-16 Relisted — NORTHSTARMLS as Distributed by MLS Grid
- 2026-02-24 Pending — NORTHSTARMLS as Distributed by MLS Grid
- 2026-02-13 Contingent — NORTHSTARMLS as Distributed by MLS Grid
- 2026-01-14 Listed $200,000 NORTHSTARMLS as Distributed by MLS Grid
- 2025-03-03 Relisted — NORTHSTARMLS as Distributed by MLS Grid
- 2025-03-01 Contingent — NORTHSTARMLS as Distributed by MLS Grid
- 2025-02-19 Listing Removed — NORTHSTARMLS as Distributed by MLS Grid
- 2025-02-19 Listed $214,900 NORTHSTARMLS as Distributed by MLS Grid
- 2024-12-17 Price Changed $219,900 NORTHSTARMLS as Distributed by MLS Grid
- 2024-10-04 Listed $225,000 NORTHSTARMLS as Distributed by MLS Grid
- 2022-10-31 Sold (Public Records) $210,000 Public Records
- 2022-10-28 Sold (MLS) $210,000 NORTHSTARMLS as Distributed by MLS Grid
- 2022-09-19 Pending — NORTHSTARMLS as Distributed by MLS Grid
- 2022-09-15 Contingent — NORTHSTARMLS as Distributed by MLS Grid
- 2022-08-26 Listed $199,950 NORTHSTARMLS as Distributed by MLS Grid
- 2022-08-23 Coming Soon $199,950 NORTHSTARMLS as Distributed by MLS Grid
- 2017-08-31 Listing Removed — NORTHSTARMLS as Distributed by MLS Grid
- 2017-08-16 Price Changed $109,900 NORTHSTARMLS as Distributed by MLS Grid
- 2017-06-22 Listed $119,000 NORTHSTARMLS as Distributed by MLS Grid
- 2003-05-28 Sold (Public Records) $35,189 Public Records
- 2002-05-14 Listing Removed — NORTHSTARMLS as Distributed by MLS Grid
- 2001-11-14 Listed $119,900 NORTHSTARMLS as Distributed by MLS Grid
- 1998-11-13 Listing Removed — NORTHSTARMLS as Distributed by MLS Grid
- 1998-05-13 Listed $77,500 NORTHSTARMLS as Distributed by MLS Grid
- 1997-06-12 Sold (MLS) $41,000 NORTHSTARMLS as Distributed by MLS Grid
- 1997-06-10 Listing Removed — NORTHSTARMLS as Distributed by MLS Grid
- 1997-03-10 Listed $46,900 NORTHSTARMLS as Distributed by MLS Grid
- 1995-01-03 Sold (Public Records) $36,000 Public Records
Property tax history
+3.5%/yrLatest (2025): $1,700 · +0.6% YoY. Source: county tax records.
Cash-flow waterfall
monthlySold comps — $/sqft
last 12 mo · ≤1 miLoading sold comps…