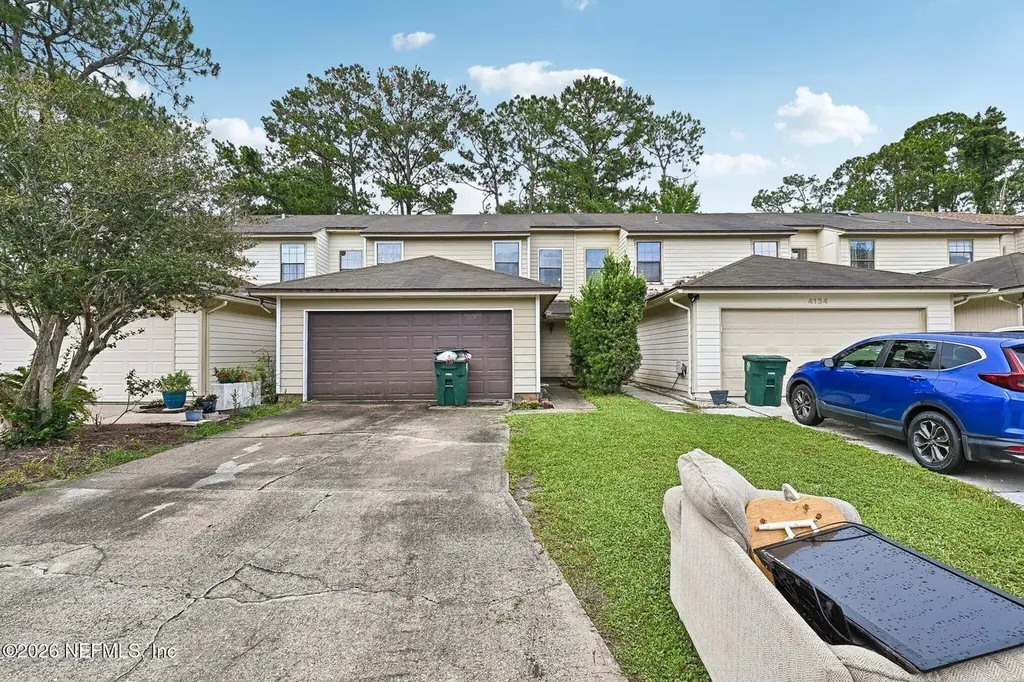
4136 Hidden Branch Dr N · Jacksonville, FL
Flood risk 1/10 · Minimal
- FEMA flood zone
- X (unshaded)
- Chance of flooding over 30 yrs
- 0.0%
- Est. flood insurance / yr
- $507 – $1,088
Fire risk 1/10 · Minimal
- Est. fire insurance / yr
- $947 – $1,759
Heat risk 9/10 · Severe
- Hot days now (above 107°F)
- 7 days/yr
- Hot days in 30 yrs
- 20 days/yr
Wind risk 10/10 · Severe
- Chance of severe wind over 30 yrs
- 99.0%
Air-quality risk 4/10 · Minor
- Unhealthy air days now
- 4 days/yr
- Unhealthy air days in 30 yrs
- 6 days/yr
Risk factors via First Street. Map © Google.
Why this score? — see what drove the C- grade
The composite is a weighted blend of 9 inputs, each scored 0–100. Each bar is that input's sub-score; the figure is the points it added to the 100-point composite (weight × sub-score).
- Cash flow +20.5/30.0
- ARV discount +7.5/15.0
- 1% rule +6.7/10.0
- DSCR +6.5/10.0
- Livability +4.2/5.0
- Schools +3.9/10.0
- Rent growth +2.5/5.0
- Condition / age +2.5/5.0
- Appreciation +0.0/10.0
$150,000
🖨 Deal sheet 📄 Offer letter ✓ Due diligence
Listing remarks
Fixer-Upper Opportunity in Prime Jacksonville Location | No HOA Calling all investors and DIY dreamers! This townhome sits in a prime Jacksonville location with no HOA, giving you total freedom to renovate, rent, or make it your own. Bring your vision and your tool belt. Properties with this much upside and zero HOA restrictions in this location do not come around often. Priced to move!
Key facts
- No hoa
- 2 garage spots
- Built 1986
Tags
Property features AI
Finance
- HOA & community: Not a senior community; Unfurnished
Exterior
- Parking: Attached garage; 2-car garage
- Utilities: Public sewer; Cable available; Electricity connected; Sewer connected; Water connected
- Home design: Townhouse; Two levels; Entry level on 1; Faces south; Property is attached; Used as residential single family
- Construction: Shingle roof
- Exterior features: Rear porch; Back yard fencing; Other fencing; Cleared lot; City street frontage; Asphalt road surface
Interior
- Kitchen: Electric cooktop; Electric range; Refrigerator
- Bedrooms: 2 bedrooms
- Bathrooms: 2 full bathrooms; 1 half bathroom
- Interior features: Primary bathroom with tub and shower; Walk-in closet(s); Wood-burning fireplace (1)
- Laundry & utility: Washer hookup; Electric dryer hookup
Neighborhood map
What this means for you Summary
Snapshot
- This is a 2-bed/3.0-bath townhouse listed at $150k.
Deal economics
- At list price, monthly cash flow is $198 ($2k/yr) — positive.
- The deal already cash-flows at list — no discount required.
- Meets the 1% rule at list price ($2k rent vs $150k).
- Cap rate 7.9% vs local median 4.0% in Jacksonville — top-decile yield for the area; either an underpriced asset or a hidden risk that comps aren't pricing in. Stress-test before assuming the spread holds.
Location & tenants
- Location reads 83/100 on livability (#50 in FL, #911 nationally) — a professional / high-income tenant draw. Strengths: amenities A+, commute A+, housing A+.
- Duval (urban): math 46% / reading 45% proficiency, ranked #48 of 73 in FL (top 66%) — families likely to look elsewhere, expect single-tenant / working-renter base with shorter leases.
- Market conditions: Rents soft (-0.0%/yr); 161 active listings in the ZIP; 35 comparable units currently listed for rent nearby; rentals leasing fast (median 8d on market — plan ~1-2 weeks tenant-placement turnaround); solid renter incomes; 6,503 units permitted in Duval County in 2024 (1,131 in 5+ unit buildings).
Forward outlook
- Local home prices are declining (-3.0%/yr); year-one equity from $1k of loan paydown is wiped out by about $4k of value loss. Plan a longer hold.
- Duval County population projected at +19% by 2050 — long-run rental-demand tailwind backs the buy-and-hold thesis.
Negotiation context
- Only 3 days on market — expect competitive offers; lowballing is unlikely to land.
- Current owner paid $72k; list at $150k implies a 108% gain — meaningful room to come down on a strong offer.
Risks & watch-outs
- Watch-outs: property tax is 2.7% of price.
- Climate carrying-cost: severe wind risk, 99% chance of damaging wind over 30y; extreme-heat days projected 7→20/yr by 2055 (HVAC capex compounding) — expect insurance premiums to compound above CPI over the hold.
Questions for the listing agent
- Property tax is high relative to price — has the assessment been appealed recently, and will the sale trigger a re-assessment?
- Is there a deadline driving the sale (1031 exchange, divorce, estate, relocation)? That informs how much negotiation room exists.
- Schools are B-rated — typically a magnet for longer-tenancy family renters. What's the average tenant stay here, and is there a school-zone premium baked into asking?
- What's the average days-on-market for RENTAL listings here right now (not sales)? A rising rental-DOM trend means longer vacancies and softer asking-rent achievability than the comps imply.
- What's the recent tenant-quality profile in this submarket — average credit score on applications, eviction rate, late-payment / NSF rate, and stable-employment percentage? A property-management company in the area should have these aggregated.
- How much new for-sale + rental construction is in the pipeline within 1–3 miles? Heavy new supply typically softens prices + rents 12–24 months out; constrained supply supports both.
Investment metrics
- 1% rule
- 1.17% ✓
- Cap rate
- 7.88%
- Cash-on-cash
- 5.65%
- DSCR
- 1.25
- GRM
- 7.1
CMA / ARV
- ARV (on-the-fly)
- $314,820
- Comps found
- 12
Show comp detail 12 sales within ~0.75 mi
| Address | Dist | Beds/Ba | Sqft | Sold | Price | $/sf | Match |
|---|---|---|---|---|---|---|---|
| 4364 Sun Garden Dr | 0.25mi | 2/2.0 | 1,665 (+5%) | 3mo | $327,990 | $197 | 74 |
| 4392 Sun Garden Dr | 0.26mi | 2/2.0 | 1,665 (+5%) | 4mo | $329,990 | $198 | 73 |
| 4404 Sun Garden Dr | 0.27mi | 2/2.0 | 1,665 (+5%) | 4mo | $329,990 | $198 | 72 |
| 4396 Sun Garden Dr | 0.27mi | 2/2.0 | 1,665 (+5%) | 4mo | $329,990 | $198 | 72 |
| 4420 Sun Garden Dr | 0.29mi | 2/2.0 | 1,665 (+5%) | 3mo | $329,990 | $198 | 72 |
| 4416 Sun Garden Dr | 0.29mi | 2/2.0 | 1,665 (+5%) | 4mo | $324,990 | $195 | 72 |
| 4424 Sun Garden Dr | 0.29mi | 2/2.0 | 1,665 (+5%) | 4mo | $329,990 | $198 | 71 |
| 4391 Sun Lily Ct | 0.49mi | 2/2.0 | 1,669 (+5%) | 4mo | $368,000 | $220 | 61 |
| 4387 Sun Lily Ct | 0.50mi | 2/2.0 | 1,669 (+5%) | 4mo | $350,000 | $210 | 61 |
| 10499 Autumn Trace Rd | 0.56mi | 3/2.5 (+1) | 1,707 (+7%) | 0mo | $252,000 | $148 | 54 |
| 4052 Laurelwood Dr | 0.66mi | 3/2.5 (+1) | 1,668 (+5%) | 3mo | $279,900 | $168 | 51 |
| 3801 Crown Point Rd #2212 | 0.68mi | 3/2.0 (+1) | 1,440 (-9%) | 3mo | $142,000 | $99 | 41 |
Match score weights: distance 35% · size 25% · config 20% · recency 20%. Top-matched comps best support the ARV.
Projected returns pro-forma
-3.0% appreciation · 0.0% rent growth · sell at horizon
- IRR
- -11.3%
- Equity multiple
- 0.60×
- Total profit
- $-16,725
- Equity at exit
- $22,365
- IRR
- -7.9%
- Equity multiple
- 0.58×
- Total profit
- $-17,722
- Equity at exit
- $12,969
Cash invested: $42,000 (down + closing). Projections, not guarantees.
Landlord ↔ Tenant lean methodology
- Overall (STATE)
- 87 Strongly Landlord-Friendly
- State Florida
- 87 Strongly Landlord-Friendly · R+3
- County
- — inherits STATE
- City
- — inherits STATE
ZIP-level market 32257
- Rents YoY
- -0.0%
- Active inventory
- 161
- Price-to-rent
- 7.1×
Monthly cashflow live
- Estimated rent
- $1,755 high interval (Pro) →
- Mortgage (P&I)
- −$787
- Tax from tax record
- −$339 /mo · $4,072/yr
- Insurance
- −$62
- HOA
- −$0
- Vacancy / Maint / Mgmt
- −$369
- Net cashflow
- $198
Break-even live
UW: 25.0% down · 7.5% · 30yr · 1.5% tax · 5.0% vac · 8.0% maint · 8.0% mgmt
Financing live
Cash to close
- Down payment
- $37,500
- Closing costs
- $4,500
- Reserves months
- —
- Total cash needed
- —
Loan-product check · same deal, 3 products live
Conventional
25% down · 7.5% · 30yr
- Down + closing
- —
- Monthly P&I
- —
- Monthly cashflow
- —
- DSCR
- —
- Eligible?
- —
Personal DTI + credit; lowest rate.
DSCR
20% down · 8.5% · 30yr
- Down + closing
- —
- Monthly P&I
- —
- Monthly cashflow
- —
- DSCR
- —
- Eligible?
- —
No personal income docs; deal must DSCR.
Hard money
10% down · 12.0% · 12mo
- Down + closing
- —
- Monthly P&I
- —
- Monthly cashflow
- —
- DSCR
- —
- Eligible?
- —
Short-term bridge; refi at stabilization.
Rent comps 35 comps
| Address | Beds | Baths | Sqft | Rent | $/sqft | DOM | Units | Dist |
|---|---|---|---|---|---|---|---|---|
| 4137 Rollingwood Ct Jacksonville, FL | 2.0 | 2.0 | 1281 | $1,915 | $1.49 | 4d | 1 | 0.07mi |
| 4108 Hanging Moss Ct Jacksonville, FL | 2.0 | 2.0 | 1095 | $1,800 | $1.64 | 17d | 1 | 0.17mi |
| 4112 Hanging Moss Ct Jacksonville, FL | 2.0 | 2.0 | 1127 | $1,725 | $1.53 | 3d | 1 | 0.17mi |
| 10275 Old Saint Augustine Rd Jacksonville, FL | 1.0–3.0 | 1.0–2.0 | 1025 | $1,543 | $1.51 | 1d | 25 | 0.20mi |
| 10263 Whispering Forest Dr Jacksonville, FL | 1.0–2.0 | 1.0–2.0 | 875 | $2,104 | $2.40 | 21d | 10 | 0.21mi |
| 10263 Whispering Forest Dr Jacksonville, FL | 1.0–3.0 | 1.0–2.0 | 925 | $2,088 | $2.26 | 1d | 1 | 0.21mi |
| 10109 Old Saint Augustine Rd Jacksonville, FL | 2.0 | 2.0 | 1135 | $1,382 | $1.22 | 7d | 3 | 0.34mi |
| 4150 Deer Trace Ln Jacksonville, FL | 3.0 | 2.5 | 1694 | $2,056 | $1.21 | 4d | 1 | 0.49mi |
| 10101 Arrowhead Dr Jacksonville, FL | 1.0–3.0 | 1.0–2.0 | 1031 | $1,829 | $1.77 | 2d | 12 | 0.52mi |
| 3824 Tree Lake Dr Jacksonville, FL | 3.0 | 2.0 | 1244 | $2,165 | $1.74 | 7d | 1 | 0.55mi |
| 3801 Crown Point Rd Jacksonville, FL | 2.0 | 2.0–2.5 | 1026 | $1,450 | $1.41 | 23d | 2 | 0.71mi |
| 3801 Crown Point Rd #1032 Jacksonville, FL | 2.0 | 3.0 | 1050 | $1,350 | $1.29 | 19d | 1 | 0.72mi |
| 10515 Anchorage Cove Ln Jacksonville, FL | 3.0 | 2.0 | 1759 | $2,275 | $1.29 | 23d | 1 | 0.72mi |
| 4324 Queensway Dr Jacksonville, FL | 3.0 | 2.0 | 1202 | $1,989 | $1.65 | 3d | 1 | 0.74mi |
| 3695 Deer Crossing Pl Jacksonville, FL | 3.0 | 2.0 | 1318 | $2,230 | $1.69 | 3d | 1 | 0.74mi |
| 4215 Windergate Dr Jacksonville, FL | 2.0 | 2.5 | 1280 | $1,550 | $1.21 | 23d | 1 | 0.77mi |
| 9626 Belda Way #16 Jacksonville, FL | 3.0 | 2.0 | 1157 | $1,450 | $1.25 | 7d | 1 | 0.78mi |
| 3918 Via Di Olivia Ct #33 Jacksonville, FL | 3.0 | 2.0 | 1269 | $1,800 | $1.42 | 23d | 1 | 0.78mi |
| 4403 Windergate Dr Jacksonville, FL | 2.0 | 2.5 | 1360 | $1,395 | $1.03 | 20d | 1 | 0.81mi |
| 4320 Sunbeam Rd Jacksonville, FL | 1.0–4.0 | 1.0–2.0 | 1012 | $1,185 | $1.17 | 4d | 1 | 0.82mi |
| 4114 Bald Eagle Ln Jacksonville, FL | 3.0 | 2.0 | 1597 | $2,295 | $1.44 | 14d | 1 | 0.84mi |
| 9740 Summer Grove Way W Jacksonville, FL | 2.0 | 2.0 | 1080 | $1,650 | $1.53 | 17d | 1 | 0.87mi |
| 9744 Summer Grove Way W #116 Jacksonville, FL | 3.0 | 2.5 | 1772 | $1,850 | $1.04 | 3d | 1 | 0.87mi |
| 9505 Armelle Way #15 Jacksonville, FL | 3.0 | 2.0 | 1157 | $1,425 | $1.23 | 23d | 1 | 0.96mi |
| 11035 Crumpet Ct Jacksonville, FL | 3.0 | 2.0 | 1290 | $2,270 | $1.76 | 16d | 1 | 0.99mi |
| 11001 Old Saint Augustine Rd Jacksonville, FL | 3.0 | 1.0–2.0 | 925 | $1,658 | $1.79 | 1d | 64 | 1.10mi |
| 4240 Migration Dr Unit 9-7 Jacksonville, FL | 2.0 | 2.0 | 1079 | $1,650 | $1.53 | 23d | 1 | 1.10mi |
| 4083 Sunbeam Rd Jacksonville, FL | 1.0–3.0 | 1.0–2.0 | 995 | $1,344 | $1.35 | 2d | 28 | 1.15mi |
| 10812 Carrington Ct Jacksonville, FL | 3.0 | 2.0 | 1620 | $1,926 | $1.19 | 14d | 1 | 1.21mi |
| 10961 Peppermill Ln Jacksonville, FL | 3.0 | 3.0 | 1962 | $2,600 | $1.33 | 23d | 1 | 1.24mi |
| 10950 Rock Island Rd Jacksonville, FL | 3.0 | 2.0 | 1810 | $2,250 | $1.24 | 4d | 1 | 1.30mi |
| 4263 Losco Rd Jacksonville, FL | 1.0–2.0 | 1.0–2.0 | 875 | $1,460 | $1.67 | 3d | 10 | 1.30mi |
| 3200 Hartley Rd Jacksonville, FL | 1.0–3.0 | 1.0–2.0 | 945 | $1,314 | $1.39 | 23d | 5 | 1.34mi |
| 4930 Tiger Lily Ln Jacksonville, FL | 3.0 | 2.0 | 1901 | $2,300 | $1.21 | 14d | 1 | 1.39mi |
| 11256 Windtree Dr E Jacksonville, FL | 2.0 | 2.0 | 1098 | $1,800 | $1.64 | 4d | 1 | 1.47mi |
Listing history 4 events
-
2026-06-16status $150,000 Pending 3 DOM
-
2026-06-15days on market $150,000 Active 3 DOM
-
2026-06-13remarks 390-char remark
-
2026-06-13$150,000 Active 1 DOM
ⓘ Source: listings_history table (triggers on properties + properties_extension) + one-shot
backfill from property_details.listing_events for pre-trigger history.
Tax reassessment forecast FL · Resets to sale price
- Current annual tax
- $4,072 · $339/mo
- Projected year-2 tax
- $4,072 · $339/mo
- Expected delta
- $0/yr ($0/mo · 0.0%)
ⓘ Screening estimate from a state-policy table — verify with the county assessor before closing.
Climate risk First Street
- Flood 1/10 Low FEMA zone X (unshaded) · 0% chance over 30 yrs
- Wildfire 1/10 Low
- Heat 9/10 Extreme 7 d/yr ≥107°F today · 20 d/yr by 30 yrs out
- Wind 10/10 Extreme 99% chance of damaging wind over 30 yrs
- Air quality 4/10 Moderate 4 unhealthy d/yr today · 6 by 30 yrs out
Nearby sold comps map
Loading sold comps map…
Walkable amenities ~0.75 mi
Loading nearby amenities…
Taxation est. · year 1
- Rental income
- $21,059
- − Mortgage interest
- −$8,402
- − Property taxes
- −$4,072
- − Insurance
- −$750
- − Repairs & maintenance
- −$1,685
- − Management
- −$1,685
- − Depreciation
- −$4,364
- Taxable income
- $101
- Est. tax owed @ 24.0%
- −$24
- After-tax cash flow
- $2,351/yr
For passive investors: Depreciation is non-cash, so a rental often shows a tax loss while cash-flowing — sheltering income. Rental losses are passive: they offset passive income freely, and up to $25,000/yr can offset ordinary (W-2) income if you actively participate and your MAGI is under $100k (phasing out to $0 by $150k); unused losses carry forward. On sale, claimed depreciation is recaptured at up to 25%, and gains may owe capital-gains tax (a 1031 exchange can defer both). Figures are a year-1 estimate at your 24.0% rate — not tax advice; consult a CPA.
Schools (NCES district)
- District
- Duval
- NCES district ID
- 1200480
- Math proficiency
- 46% ▼ -11.00%
- Reading proficiency
- 45% ▼ -4.00%
- Median HH income
- $48,987
- Composite
- 38.97/100
- National rank
- #4076
- State rank
- #48 of 73 in FL
Livability — Jacksonville
- Score
- 83/100
- State rank
- #50
- US rank
- #911
Category grades
Schools grade is shown separately in the Schools card above.
Census & demographics
- Census place
- Jacksonville, FL
- County
- Duval County · 1,015,274 people
- City population
- 979,034
- Metro
- Jacksonville, FL
- Population (ZIP)
- 42,904
- Household income
- $75,780
- Rent vs Own
- Severe rent burden
- 2293.0
Population outlook (Duval County) Hauer SSP2
- Today (2025)
- 1,013,010 people
- By 2030
- 1,059,228 · +4.6%
- By 2040
- 1,141,439 · +12.7%
- By 2050
- 1,205,258 · +19.0%
- By 2075
- 1,324,282 · +30.7%
- By 2100
- 1,319,620 · +30.3%
Race, ethnicity, and origin ACS 2023
- Neighborhood character
- Diverse neighborhood (Simpson 0.59)
- Race & ethnicity
- White 61% Hispanic / Latino 16% Two or more races 11% Black 9% Asian 5%
- Hispanic origin (detail)
- Mexican 2% Puerto Rican 4%
- Common ancestry
- Italian 4% Romanian 2% Slovak 2%
- Foreign-born
- 17% · Canada, Jamaica
- Languages at home
- 76% English-only · Spanish 11% Other Indo-European 6% Russian/Polish/Slavic 2%
Political lean MEDSL · Duval
- 2024 margin
- Toss-up / Even · D 48.7% · R 50.1% · Other 1.2%
- 2008→2024 swing
- +0.4pp no change · 2008: -1.9pp · 2024: -1.5pp
- All cycles
- 2024: R+1.5 2020: D+3.8 2016: R+1.5 2012: R+3.6 2008: R+1.9
Not yet ingested
- Civics
- —
Market trends
- HPI YoY
- ▼ -205.97%
- Current HPI
- 310.465
- Rent YoY
- ▬ -0.02%
- Metro
- Jacksonville, FL
- State GDP YoY
- ▲ 3.28%
- F500 in state
- 36
Industry mix (Fortune 500 HQ in FL)
| Industry | F500 HQs | Revenue |
|---|---|---|
| Industrial Technology | 2 | $29B |
|
||
| Insurance | 2 | $17B |
|
||
| Retail | 1 | $60B |
|
||
| Technology Distribution | 1 | $58B |
|
||
| Homebuilding | 1 | $35B |
|
||
| Technology Manufacturing | 1 | $35B |
|
||
Price history
+134.4% since first listed4 events — show timeline
- 2026-06-08 Listed $150,000 realMLS
- 1996-04-10 Sold (Public Records) $72,000 Public Records
- 1990-04-01 Sold (Public Records) $66,000 Public Records
- 1988-11-01 Sold (Public Records) $64,000 Public Records
Property tax history
+6.5%/yrLatest (2025): $4,072 · +11.5% YoY. Source: county tax records.
Cash-flow waterfall
monthlySold comps — $/sqft
last 12 mo · ≤1 miLoading sold comps…