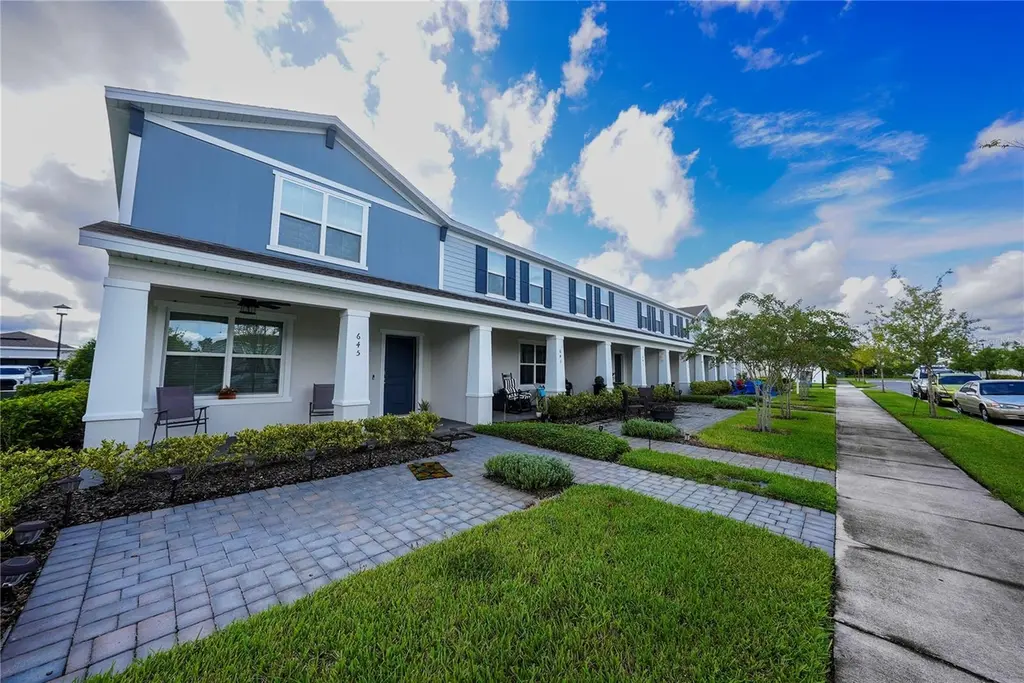
643 Belgrove St · DeBary, FL
Flood risk 1/10 · Minimal
- FEMA flood zone
- X (unshaded)
- Chance of flooding over 30 yrs
- 0.0%
- Est. flood insurance / yr
- $507 – $1,088
Fire risk 4/10 · Minor
- Est. fire insurance / yr
- $947 – $1,759
Heat risk 8/10 · Major
- Hot days now (above 108°F)
- 7 days/yr
- Hot days in 30 yrs
- 21 days/yr
Wind risk 9/10 · Severe
- Chance of severe wind over 30 yrs
- 99.0%
Air-quality risk 2/10 · Minimal
- Unhealthy air days now
- 1 days/yr
- Unhealthy air days in 30 yrs
- 1 days/yr
Risk factors via First Street. Map © Google.
Why this score? — see what drove the D- grade
The composite is a weighted blend of 9 inputs, each scored 0–100. Each bar is that input's sub-score; the figure is the points it added to the 100-point composite (weight × sub-score).
- ARV discount +12.3/15.0
- Cash flow +7.8/30.0
- Schools +3.9/10.0
- Livability +3.7/5.0
- 1% rule +3.1/10.0
- Rent growth +3.0/5.0
- Condition / age +2.5/5.0
- DSCR +1.9/10.0
- Appreciation +0.0/10.0
$324,000
🖨 Deal sheet 📄 Offer letter ✓ Due diligence
Listing remarks MLS
? Beautiful and Move-In Ready Home in DeBary! ? Built in 2022, this well-maintained residence offers modern living with stunning granite countertops, an open and inviting layout. The home has been meticulously cared for, giving it a like-new feel. Conveniently located near shops, dining, and major roadways, this property combines comfort, style, and practicality—perfect for your next home!
Key facts
- $114 HOA
- Garage
- Community pool
Neighborhood map
What this means for you Summary
Snapshot
- This is a 3-bed/2.5-bath single-family listed at $324k.
Deal economics
- At list price, monthly cash flow is $-356 ($-4k/yr) — negative.
- To cash-flow at today's rent, offer at most $261k (19.4% below list).
- To meet the 1% rule (rent ≥ 1% of price), the offer needs to be $261k (19.3% below list).
- Recommended offer: $261k (19.4% below list) — sets the bar for cash-flow.
- Cap rate 5.0% vs local median 3.8% in DeBary — top-decile yield for the area; either an underpriced asset or a hidden risk that comps aren't pricing in. Stress-test before assuming the spread holds.
Location & tenants
- Location reads 73/100 on livability (#312 in FL) — a middle-class / working-renter tenant base. Strengths: employment A+, housing A+, crime A-; Watch: amenities F, commute F, health & safety D-.
- Volusia (suburban): math 44% / reading 49% proficiency, ranked #47 of 73 in FL (top 64%) — families likely to look elsewhere, expect single-tenant / working-renter base with shorter leases.
- Market conditions: Rents rising (+1.9%/yr); 273 active listings in the ZIP; 4 comparable units currently listed for rent nearby; rentals at typical pace (median 23d on market — plan ~3-4 weeks tenant-placement turnaround); solid renter incomes; 3,402 units permitted in Volusia County in 2024 (681 in 5+ unit buildings).
- This rent runs 35% of the median local income ($88k/yr) — at the standard rent-burdened threshold; future hikes will face affordability resistance.
Forward outlook
- Local home prices are declining (-3.0%/yr); year-one equity from $2k of loan paydown is wiped out by about $10k of value loss. Plan a longer hold.
- Volusia County population projected at +19% by 2050 — long-run rental-demand tailwind backs the buy-and-hold thesis.
Negotiation context
- It's been on market 282 days — a 12% lower offer ($285k) is reasonable based on typical stale-listing flexibility.
- 2 sale attempts with the ask held roughly flat each time — persistent listings suggest the price (not the market) is what's stuck; bring a comps-based counter.
Risks & watch-outs
- Climate carrying-cost: severe wind risk, 99% chance of damaging wind over 30y; extreme-heat days projected 7→21/yr by 2055 (HVAC capex compounding) — expect insurance premiums to compound above CPI over the hold.
Questions for the listing agent
- What do current leases actually rent for vs. the listed asking? Can we see a recent rent roll and the last 12 months of T-12 income?
- It's been on market 282 days. Have you received any prior offers? Is the seller open to a 19% concession, seller financing, or rate buy-down credit?
- What does the HOA fee cover, when was the last increase, and are there any pending special assessments or reserve-fund shortfalls?
- Why hasn't it sold? Are there any deal-killer items the seller is aware of (foundation, flood, title, zoning, code violations)?
- Is there a deadline driving the sale (1031 exchange, divorce, estate, relocation)? That informs how much negotiation room exists.
- Schools are B-rated — typically a magnet for longer-tenancy family renters. What's the average tenant stay here, and is there a school-zone premium baked into asking?
- The area grade is low — what's the realistic commute time and amenity access for the typical tenant pool here? Any planned neighborhood developments (good or bad) we should know about?
- What's the average days-on-market for RENTAL listings here right now (not sales)? A rising rental-DOM trend means longer vacancies and softer asking-rent achievability than the comps imply.
- What's the recent tenant-quality profile in this submarket — average credit score on applications, eviction rate, late-payment / NSF rate, and stable-employment percentage? A property-management company in the area should have these aggregated.
- How much new for-sale + rental construction is in the pipeline within 1–3 miles? Heavy new supply typically softens prices + rents 12–24 months out; constrained supply supports both.
Investment metrics
- 1% rule
- 0.81% ✗
- Cap rate
- 4.97%
- Cash-on-cash
- -4.71%
- DSCR
- 0.79
- GRM
- 10.3
CMA / ARV
- ARV (median comp)
- $362,456
- List price
- $324,000
- Delta
- -10.61%
- Verdict
- UNDERPRICED
- Comps
- 17 within 2.0 mi
Projected returns pro-forma
-3.0% appreciation · 1.89% rent growth · sell at horizon
- IRR
- -25.6%
- Equity multiple
- 0.14×
- Total profit
- $-77,915
- Equity at exit
- $48,309
- IRR
- -26.0%
- Equity multiple
- -0.19×
- Total profit
- $-108,017
- Equity at exit
- $28,014
Cash invested: $90,720 (down + closing). Projections, not guarantees.
Landlord ↔ Tenant lean methodology
- Overall (STATE)
- 87 Strongly Landlord-Friendly
- State Florida
- 87 Strongly Landlord-Friendly · R+3
- County
- — inherits STATE
- City
- — inherits STATE
ZIP-level market 32713
- Rents YoY
- 1.9%
- Active inventory
- 273
- Price-to-rent
- 10.3×
Monthly cashflow live
- Estimated rent
- $2,613 medium interval (Pro) →
- Mortgage (P&I)
- −$1,699
- Tax from tax record
- −$472 /mo · $5,668/yr
- Insurance
- −$135
- HOA
- −$114
- Vacancy / Maint / Mgmt
- −$549
- Net cashflow
- $-356
Break-even live
UW: 25.0% down · 7.5% · 30yr · 1.5% tax · 5.0% vac · 8.0% maint · 8.0% mgmt
Financing live
Cash to close
- Down payment
- $81,000
- Closing costs
- $9,720
- Reserves months
- —
- Total cash needed
- —
Loan-product check · same deal, 3 products live
Conventional
25% down · 7.5% · 30yr
- Down + closing
- —
- Monthly P&I
- —
- Monthly cashflow
- —
- DSCR
- —
- Eligible?
- —
Personal DTI + credit; lowest rate.
DSCR
20% down · 8.5% · 30yr
- Down + closing
- —
- Monthly P&I
- —
- Monthly cashflow
- —
- DSCR
- —
- Eligible?
- —
No personal income docs; deal must DSCR.
Hard money
10% down · 12.0% · 12mo
- Down + closing
- —
- Monthly P&I
- —
- Monthly cashflow
- —
- DSCR
- —
- Eligible?
- —
Short-term bridge; refi at stabilization.
Rent comps 4 comps
| Address | Beds | Baths | Sqft | Rent | $/sqft | DOM | Units | Dist |
|---|---|---|---|---|---|---|---|---|
| 700 Costa Ln Debary, FL | 4.0 | 2.5 | 2200 | $2,900 | $1.32 | 23d | 1 | 0.14mi |
| 730 Rivington Ave Debary, FL | 3.0 | 2.5 | 1998 | $2,600 | $1.30 | 23d | 1 | 0.16mi |
| 658 Reader Ln Debary, FL | 3.0 | 2.5 | 1687 | $2,295 | $1.36 | 23d | 1 | 0.41mi |
| 550 Orient Ave Debary, FL | 3.0 | 2.0 | 1639 | $2,395 | $1.46 | 23d | 1 | 1.41mi |
HOA detail
- Monthly dues
- $114 · $1,368/yr
Listing history 20 events
-
2026-06-18days on market $324,000 Active 282 DOM
-
2026-06-17days on market $324,000 Active 281 DOM
-
2026-06-16days on market $324,000 Active 280 DOM
-
2026-06-15days on market $324,000 Active 279 DOM
-
2026-06-14days on market $324,000 Active 277 DOM
-
2026-06-10days on market $324,000 Active 274 DOM
-
2026-06-09days on market $324,000 Active 273 DOM
-
2026-06-08days on market $324,000 Active 272 DOM
-
2026-06-07days on market $324,000 Active 271 DOM
-
2026-06-05days on market $324,000 Active 268 DOM
-
2026-06-03days on market $324,000 Active 267 DOM
-
2026-06-03days on market $324,000 Active 266 DOM
-
2026-06-01days on market $324,000 Active 265 DOM
-
2026-05-31days on market $324,000 Active 264 DOM
-
2026-05-31days on market $324,000 Active 263 DOM
-
2026-02-15status Active 399-char remark
Show marketing remark (399 chars)
? Beautiful and Move-In Ready Home in DeBary! ? Built in 2022, this well-maintained residence offers modern living with stunning granite countertops, an open and inviting layout. The home has been meticulously cared for, giving it a like-new feel. Conveniently located near shops, dining, and major roadways, this property combines comfort, style, and practicality—perfect for your next home!
-
2026-01-31historical 399-char remark
Show marketing remark (399 chars)
? Beautiful and Move-In Ready Home in DeBary! ? Built in 2022, this well-maintained residence offers modern living with stunning granite countertops, an open and inviting layout. The home has been meticulously cared for, giving it a like-new feel. Conveniently located near shops, dining, and major roadways, this property combines comfort, style, and practicality—perfect for your next home!
-
2025-12-15price $324,000 399-char remark
Show marketing remark (399 chars)
? Beautiful and Move-In Ready Home in DeBary! ? Built in 2022, this well-maintained residence offers modern living with stunning granite countertops, an open and inviting layout. The home has been meticulously cared for, giving it a like-new feel. Conveniently located near shops, dining, and major roadways, this property combines comfort, style, and practicality—perfect for your next home!
-
2025-10-13price $334,900 399-char remark
Show marketing remark (399 chars)
? Beautiful and Move-In Ready Home in DeBary! ? Built in 2022, this well-maintained residence offers modern living with stunning granite countertops, an open and inviting layout. The home has been meticulously cared for, giving it a like-new feel. Conveniently located near shops, dining, and major roadways, this property combines comfort, style, and practicality—perfect for your next home!
-
2025-08-25$337,000 Active 399-char remark
Show marketing remark (399 chars)
? Beautiful and Move-In Ready Home in DeBary! ? Built in 2022, this well-maintained residence offers modern living with stunning granite countertops, an open and inviting layout. The home has been meticulously cared for, giving it a like-new feel. Conveniently located near shops, dining, and major roadways, this property combines comfort, style, and practicality—perfect for your next home!
ⓘ Source: listings_history table (triggers on properties + properties_extension) + one-shot
backfill from property_details.listing_events for pre-trigger history.
Tax reassessment forecast FL · Resets to sale price
- Current annual tax
- $5,668 · $472/mo
- Projected year-2 tax
- $5,668 · $472/mo
- Expected delta
- $0/yr ($0/mo · 0.0%)
ⓘ Screening estimate from a state-policy table — verify with the county assessor before closing.
Climate risk First Street
- Flood 1/10 Low FEMA zone X (unshaded) · 0% chance over 30 yrs
- Wildfire 4/10 Moderate
- Heat 8/10 Severe 7 d/yr ≥108°F today · 21 d/yr by 30 yrs out
- Wind 9/10 Extreme 99% chance of damaging wind over 30 yrs
- Air quality 2/10 Low 1 unhealthy d/yr today · 1 by 30 yrs out
Nearby sold comps map
Loading sold comps map…
Walkable amenities ~0.75 mi
Loading nearby amenities…
Taxation est. · year 1
- Rental income
- $31,357
- − Mortgage interest
- −$18,149
- − Property taxes
- −$5,668
- − Insurance
- −$1,620
- − Repairs & maintenance
- −$2,509
- − Management
- −$2,509
- − HOA
- −$1,368
- − Depreciation
- −$9,425
- Taxable loss
- −$9,890
- Est. tax savings @ 24.0%
- +$2,374
- After-tax cash flow
- $-1,899/yr
For passive investors: Depreciation is non-cash, so a rental often shows a tax loss while cash-flowing — sheltering income. Rental losses are passive: they offset passive income freely, and up to $25,000/yr can offset ordinary (W-2) income if you actively participate and your MAGI is under $100k (phasing out to $0 by $150k); unused losses carry forward. On sale, claimed depreciation is recaptured at up to 25%, and gains may owe capital-gains tax (a 1031 exchange can defer both). Figures are a year-1 estimate at your 24.0% rate — not tax advice; consult a CPA.
Schools (NCES district)
- District
- Volusia
- NCES district ID
- 1201920
- Math proficiency
- 44% ▼ -9.00%
- Reading proficiency
- 49% ▼ -3.00%
- Median HH income
- $42,946
- Composite
- 39.2/100
- National rank
- #4019
- State rank
- #47 of 73 in FL
Livability — DeBary
- Score
- 73/100
- State rank
- #312
- US rank
- #5314
Category grades
Schools grade is shown separately in the Schools card above.
Census & demographics
- Census place
- DeBary, FL
- County
- Volusia County · 556,871 people
- City population
- 22,884
- Metro
- Deltona-Daytona Beach-Ormond Beach, FL
- Population (ZIP)
- 22,884
- Household income
- $88,500
- Rent vs Own
- Severe rent burden
- 265.0
Population outlook (Volusia County) Hauer SSP2
- Today (2025)
- 572,749 people
- By 2030
- 598,695 · +4.5%
- By 2040
- 644,880 · +12.6%
- By 2050
- 681,451 · +19.0%
- By 2075
- 759,957 · +32.7%
- By 2100
- 778,902 · +36.0%
Race, ethnicity, and origin ACS 2023
- Neighborhood character
- Predominantly White (73%)
- Race & ethnicity
- White 73% Hispanic / Latino 17% Two or more races 6% Black 5% Asian 3%
- Hispanic origin (detail)
- Mexican 1% Puerto Rican 10% Cuban 1%
- Common ancestry
- Lithuanian 2% Romanian 2% Serbian 2%
- Foreign-born
- 8% · Canada, Vietnam, South Korea
- Languages at home
- 87% English-only · Spanish 10% Vietnamese 2% Other Indo-European 1%
Political lean MEDSL · Volusia
- 2024 margin
- Strong R (+21.8) · D 38.7% · R 60.5%
- 2008→2024 swing
- -27.4pp toward R · 2008: 5.7pp · 2024: -21.8pp
- All cycles
- 2024: R+21.8 2020: R+14.1 2016: R+13.1 2012: R+1.2 2008: D+5.7
Not yet ingested
- Civics
- —
Market trends
- HPI YoY
- ▼ -247.35%
- Current HPI
- 294.803
- Rent YoY
- ▲ 1.89%
- Metro
- Deltona-Daytona Beach-Ormond Beach, FL
- State GDP YoY
- ▲ 3.28%
- F500 in state
- 36
Industry mix (Fortune 500 HQ in FL)
| Industry | F500 HQs | Revenue |
|---|---|---|
| Industrial Technology | 2 | $29B |
|
||
| Insurance | 2 | $17B |
|
||
| Retail | 1 | $60B |
|
||
| Technology Distribution | 1 | $58B |
|
||
| Homebuilding | 1 | $35B |
|
||
| Technology Manufacturing | 1 | $35B |
|
||
Price history
-3.9% since first listed5 events — show timeline
- 2026-02-15 Relisted — Stellar MLS as Distributed by MLS Grid
- 2026-01-31 Listing Removed — Stellar MLS as Distributed by MLS Grid
- 2025-12-15 Price Changed $324,000 Stellar MLS as Distributed by MLS Grid
- 2025-10-13 Price Changed $334,900 Stellar MLS as Distributed by MLS Grid
- 2025-08-25 Listed $337,000 Stellar MLS as Distributed by MLS Grid
Property tax history
+32.3%/yrLatest (2025): $5,668 · +5.4% YoY. Source: county tax records.
Cash-flow waterfall
monthlySold comps — $/sqft
last 12 mo · ≤1 miLoading sold comps…