1015 Bishop Creek Dr · Wylie, TX
Flood risk No data
- FEMA flood zone
- —
- Chance of flooding over 30 yrs
- —
- Est. flood insurance / yr
- —
Fire risk No data
- Est. fire insurance / yr
- —
Heat risk No data
- Hot days now (above threshold)
- —
- Hot days in 30 yrs
- —
Wind risk No data
- Chance of severe wind over 30 yrs
- —
Air-quality risk No data
- Unhealthy air days now
- —
- Unhealthy air days in 30 yrs
- —
Risk factors via First Street. Map © Google.
Why this score? — see what drove the C+ grade
The composite is a weighted blend of 9 inputs, each scored 0–100. Each bar is that input's sub-score; the figure is the points it added to the 100-point composite (weight × sub-score).
- Cash flow +19.4/30.0
- ARV discount +15.0/15.0
- DSCR +6.1/10.0
- 1% rule +5.6/10.0
- Condition / age +4.8/5.0
- Schools +4.2/10.0
- Livability +3.5/5.0
- Rent growth +2.2/5.0
- Appreciation +0.0/10.0
$129,174
🖨 Deal sheet 📄 Offer letter ✓ Due diligence
Listing remarks
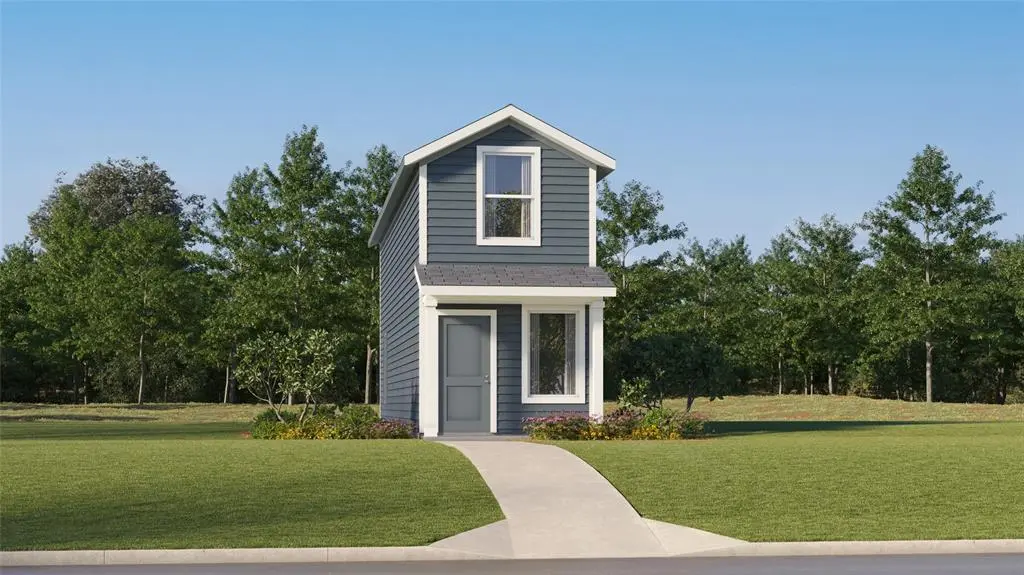
LENNAR - The Alcove at Tillage Farms - The Dream Collection brings new single-family homes to the Tillage Farms masterplan in Princeton, TX. The community features fantastic onsite amenities, including a relaxing swimming pool, basketball court and more, and residents receive a Battery Backup included with Base Power REP election upon selection. This charming Dallas suburb boasts proximity to major roadways and thoroughfares, helping to simplify everyday travel and commutes. Homeowners will enjoy convenient access to the best of local shopping and dining in either downtown McKinney or at the Allen Outlets. Prices and features may vary and are subject to change. Photos are for illustrative p
Key facts
- Swimming pool
- Basketball court
- Battery backup
Tags
Neighborhood map
What this means for you Summary
Snapshot
- This is a 1-bed/2.0-bath single-family listed at $129k. Condition is rated excellent.
Deal economics
- At list price, monthly cash flow is $145 ($2k/yr) — positive.
- The deal already cash-flows at list — no discount required.
- Meets the 1% rule at list price ($1k rent vs $129k).
- Cap rate 7.6% vs local median 4.0% in Wylie — top-decile yield for the area; either an underpriced asset or a hidden risk that comps aren't pricing in. Stress-test before assuming the spread holds.
Location & tenants
- Location reads 69/100 on livability (#419 in TX) — a middle-class / working-renter tenant base. Strengths: crime A+, employment A+, housing A+; Watch: amenities F, commute F, health & safety F.
- Princeton ISD (suburban): math 51% / reading 47% proficiency, ranked #188 of 826 in TX (top 23%) — families likely to look elsewhere, expect single-tenant / working-renter base with shorter leases.
- Zoned schools: Mayfield El (609 students, 73% FRL) — zoned schools average 73% FRL vs 56% district-wide (17 pts higher); higher-poverty schools than district average — tighter screening recommended.
- Market conditions: Rents soft (-1.0%/yr); 1404 active listings in the ZIP; 1 comparable units currently listed for rent nearby; solid renter incomes; 19,194 units permitted in Collin County in 2024 (3,988 in 5+ unit buildings).
- This rent is only 16% of the median local income ($100k/yr) — well below the 30% rent-burden line; pricing power to push rent on renewal without tenant pushback.
Forward outlook
- Local home prices are declining (-3.0%/yr); year-one equity from $894 of loan paydown is wiped out by about $4k of value loss. Plan a longer hold.
- Collin County population projected at +60% by 2050 — long-run rental-demand tailwind backs the buy-and-hold thesis.
Negotiation context
- Only 3 days on market — expect competitive offers; lowballing is unlikely to land.
- 2 sale attempts with the ask held roughly flat each time — persistent listings suggest the price (not the market) is what's stuck; bring a comps-based counter.
Questions for the listing agent
- What does the HOA fee cover, when was the last increase, and are there any pending special assessments or reserve-fund shortfalls?
- Is there a deadline driving the sale (1031 exchange, divorce, estate, relocation)? That informs how much negotiation room exists.
- Schools are B-rated — typically a magnet for longer-tenancy family renters. What's the average tenant stay here, and is there a school-zone premium baked into asking?
- What's the average days-on-market for RENTAL listings here right now (not sales)? A rising rental-DOM trend means longer vacancies and softer asking-rent achievability than the comps imply.
- What's the recent tenant-quality profile in this submarket — average credit score on applications, eviction rate, late-payment / NSF rate, and stable-employment percentage? A property-management company in the area should have these aggregated.
- How much new for-sale + rental construction is in the pipeline within 1–3 miles? Heavy new supply typically softens prices + rents 12–24 months out; constrained supply supports both.
Investment metrics
- 1% rule
- 1.06% ✓
- Cap rate
- 7.64%
- Cash-on-cash
- 4.80%
- DSCR
- 1.21
- GRM
- 7.9
CMA / ARV
- ARV (on-the-fly)
- $157,979
- Comps found
- 12
Show comp detail 12 sales within ~0.75 mi
| Address | Dist | Beds/Ba | Sqft | Sold | Price | $/sf | Match |
|---|---|---|---|---|---|---|---|
| 1023 Bishop Creek Dr | 0.00mi | 1/2.0 | 661 (0%) | 2mo | $139,500 | $211 | 98 |
| 1002 Robin Hill Ln | 0.04mi | 1/2.0 | 661 (0%) | 2mo | $174,264 | $264 | 96 |
| 1019 Bishop Creek Dr | 0.00mi | 1/2.0 | 661 (0%) | 6mo | $155,674 | $236 | 95 |
| 1017 Bishop Creek Dr | 0.00mi | 1/2.0 | 661 (0%) | 6mo | $157,674 | $239 | 95 |
| 1008 Robin Hill Ln | 0.03mi | 1/2.0 | 661 (0%) | 4mo | $151,674 | $229 | 95 |
| 1011 Bishop Creek Dr | 0.02mi | 1/2.0 | 661 (0%) | 6mo | $149,124 | $226 | 94 |
| 1013 Bishop Creek Dr | 0.00mi | 1/2.0 | 661 (0%) | 8mo | $157,884 | $239 | 94 |
| 1009 Bishop Creek Dr | 0.02mi | 1/2.0 | 661 (0%) | 7mo | $156,674 | $237 | 93 |
| 1007 Bishop Creek Dr | 0.03mi | 1/2.0 | 661 (0%) | 7mo | $163,499 | $247 | 93 |
| 1010 Robin Hill Ln | 0.03mi | 1/2.0 | 661 (0%) | 8mo | $149,149 | $226 | 92 |
| 1005 Bishop Creek Dr | 0.03mi | 1/2.0 | 661 (0%) | 8mo | $168,674 | $255 | 92 |
| 1004 Robin Hill Ln | 0.04mi | 1/2.0 | 661 (0%) | 9mo | $170,999 | $259 | 90 |
Match score weights: distance 35% · size 25% · config 20% · recency 20%. Top-matched comps best support the ARV.
Projected returns pro-forma
-3.0% appreciation · 0.0% rent growth · sell at horizon
- IRR
- -12.4%
- Equity multiple
- 0.57×
- Total profit
- $-15,669
- Equity at exit
- $19,260
- IRR
- -8.8%
- Equity multiple
- 0.53×
- Total profit
- $-17,050
- Equity at exit
- $11,169
Cash invested: $36,169 (down + closing). Projections, not guarantees.
Landlord ↔ Tenant lean methodology
- Overall (STATE)
- 87 Strongly Landlord-Friendly
- State Texas
- 87 Strongly Landlord-Friendly · R+5
- County
- — inherits STATE
- City
- — inherits STATE
ZIP-level market 75407
- Home prices YoY
- -30.3%
- Rents YoY
- -1.0%
- Active inventory
- 1404
- Price-to-rent
- 7.9×
Monthly cashflow live
- Estimated rent
- $1,365 medium interval (Pro) →
- Mortgage (P&I)
- −$677
- Tax est. 1.5%
- −$161 /mo · $1,938/yr
- Insurance
- −$54
- HOA
- −$41
- Vacancy / Maint / Mgmt
- −$287
- Net cashflow
- $145
Break-even live
UW: 25.0% down · 7.5% · 30yr · 1.5% tax · 5.0% vac · 8.0% maint · 8.0% mgmt
Financing live
Cash to close
- Down payment
- $32,294
- Closing costs
- $3,875
- Reserves months
- —
- Total cash needed
- —
Loan-product check · same deal, 3 products live
Conventional
25% down · 7.5% · 30yr
- Down + closing
- —
- Monthly P&I
- —
- Monthly cashflow
- —
- DSCR
- —
- Eligible?
- —
Personal DTI + credit; lowest rate.
DSCR
20% down · 8.5% · 30yr
- Down + closing
- —
- Monthly P&I
- —
- Monthly cashflow
- —
- DSCR
- —
- Eligible?
- —
No personal income docs; deal must DSCR.
Hard money
10% down · 12.0% · 12mo
- Down + closing
- —
- Monthly P&I
- —
- Monthly cashflow
- —
- DSCR
- —
- Eligible?
- —
Short-term bridge; refi at stabilization.
Rent comps 1 comps
| Address | Beds | Baths | Sqft | Rent | $/sqft | DOM | Units | Dist |
|---|---|---|---|---|---|---|---|---|
| 1002 Robin Hill LN Princeton, TX | 1.0 | 2.0 | 661 | $1,300 | $1.97 | 43d | 1 | 0.06mi |
HOA detail
- Monthly dues
- $41 · $492/yr
- Likely covers
- pool
Listing history 5 events
-
2026-04-26status Pending
-
2026-04-23$129,174 Active
-
2026-03-31historical
-
2026-02-06price $149,674
-
2026-01-07$157,674 Active
ⓘ Source: listings_history table (triggers on properties + properties_extension) + one-shot
backfill from property_details.listing_events for pre-trigger history.
Nearby sold comps map
Loading sold comps map…
Walkable amenities ~0.75 mi
Loading nearby amenities…
Taxation est. · year 1
- Rental income
- $16,381
- − Mortgage interest
- −$7,236
- − Property taxes
- −$1,938
- − Insurance
- −$646
- − Repairs & maintenance
- −$1,310
- − Management
- −$1,310
- − HOA
- −$492
- − Depreciation
- −$3,758
- Taxable loss
- −$309
- Est. tax savings @ 24.0%
- +$74
- After-tax cash flow
- $1,811/yr
For passive investors: Depreciation is non-cash, so a rental often shows a tax loss while cash-flowing — sheltering income. Rental losses are passive: they offset passive income freely, and up to $25,000/yr can offset ordinary (W-2) income if you actively participate and your MAGI is under $100k (phasing out to $0 by $150k); unused losses carry forward. On sale, claimed depreciation is recaptured at up to 25%, and gains may owe capital-gains tax (a 1031 exchange can defer both). Figures are a year-1 estimate at your 24.0% rate — not tax advice; consult a CPA.
Condition & rehab AI · 1 photo
This single-family home is in excellent condition with no visible repairs or maintenance needed. It offers a good return on investment with potential for both resale and rental value through minor updates and improvements.
Value-add opportunities
- Both Painting the exterior and interior — Fresh paint enhances curb appeal and interior aesthetics.
- Both Landscaping improvements — Enhanced landscaping can increase both resale and rental value.
- Resale Upgrading the kitchen appliances — Modern appliances can attract more buyers and renters.
- Both Upgrading the HVAC system — A new HVAC system can improve comfort and energy efficiency, benefiting both resale and rental value.
- Both Adding smart home features — Smart home features can increase the home's appeal and marketability, benefiting both resale and rental value.
Renovation cost estimate screening
Value-add ROI direction
- Both Painting the exterior and interior — Fresh paint enhances curb appeal and interior aesthetics. ↑
- Both Landscaping improvements — Enhanced landscaping can increase both resale and rental value. ↑
- Resale Upgrading the kitchen appliances — Modern appliances can attract more buyers and renters. ↑
- Both Upgrading the HVAC system — A new HVAC system can improve comfort and energy efficiency, benefiting both resale and rental value. ↑
- Both Adding smart home features — Smart home features can increase the home's appeal and marketability, benefiting both resale and rental value. ↑
ⓘ Cost ranges are severity-bucket heuristics (US national rule-of-thumb). Get contractor quotes + a written scope before underwriting a rehab budget.
Schools (NCES district)
- District
- Princeton ISD
- NCES district ID
- 4835850
- Math proficiency
- 51% ▼ -8.00%
- Reading proficiency
- 47% ▬ 0.00%
- Median HH income
- $54,827
- Composite
- 42.44/100
- National rank
- #3226
- State rank
- #188 of 826 in TX
Livability — Wylie
- Score
- 69/100
- State rank
- #419
- US rank
- #8623
Category grades
Schools grade is shown separately in the Schools card above.
Census & demographics
- County
- Collin County · 1,159,394 people
- City population
- 69,325
- Metro
- Dallas-Fort Worth-Arlington, TX
- Population (ZIP)
- 34,171
- Household income
- $100,037
- Rent vs Own
- Severe rent burden
- 368.0
Population outlook (Collin County) Hauer SSP2
- Today (2025)
- 1,210,074 people
- By 2030
- 1,358,201 · +12.2%
- By 2040
- 1,654,061 · +36.7%
- By 2050
- 1,937,359 · +60.1%
- By 2075
- 2,567,039 · +112.1%
- By 2100
- 2,952,048 · +144.0%
Race, ethnicity, and origin ACS 2023
- Neighborhood character
- Diverse neighborhood (Simpson 0.66)
- Race & ethnicity
- White 47% Hispanic / Latino 30% Black 17% Two or more races 10% Asian 4% Native American 1%
- Hispanic origin (detail)
- Mexican 26%
- Common ancestry
- Lithuanian 2% Romanian 1% Russian 1%
- Foreign-born
- 15% · Canada, China, Mexico
- Languages at home
- 70% English-only · Spanish 22% Other Indo-European 2% Other Asian/Pacific 1%
Political lean MEDSL · Collin
- 2024 margin
- R (+11.1) · D 43.1% · R 54.3% · Other 2.6%
- 2008→2024 swing
- +14.4pp toward D · 2008: -25.6pp · 2024: -11.1pp
- All cycles
- 2024: R+11.1 2020: R+4.3 2016: R+17.0 2012: R+31.6 2008: R+25.6
Not yet ingested
- Civics
- —
Market trends
- HPI YoY
- ▼ -103.99%
- Current HPI
- 238.9373
- Rent YoY
- ▼ -1.02%
- Metro
- Dallas-Fort Worth-Arlington, TX
- State GDP YoY
- ▲ 3.95%
- F500 in state
- 110
Industry mix (Fortune 500 HQ in TX)
| Industry | F500 HQs | Revenue |
|---|---|---|
| Energy | 16 | $1,198B |
|
||
| Technology | 5 | $198B |
|
||
| Engineering / Construction | 4 | $72B |
|
||
| Energy Services | 3 | $60B |
|
||
| Utilities | 3 | $41B |
|
||
| Healthcare | 2 | $330B |
|
||
Price history
-18.1% since first listed5 events — show timeline
- 2026-04-26 Pending — NTREIS
- 2026-04-23 Listed $129,174 NTREIS
- 2026-03-31 Listing Removed — NTREIS
- 2026-02-06 Price Changed $149,674 NTREIS
- 2026-01-07 Listed $157,674 NTREIS
Cash-flow waterfall
monthlySold comps — $/sqft
last 12 mo · ≤1 miLoading sold comps…