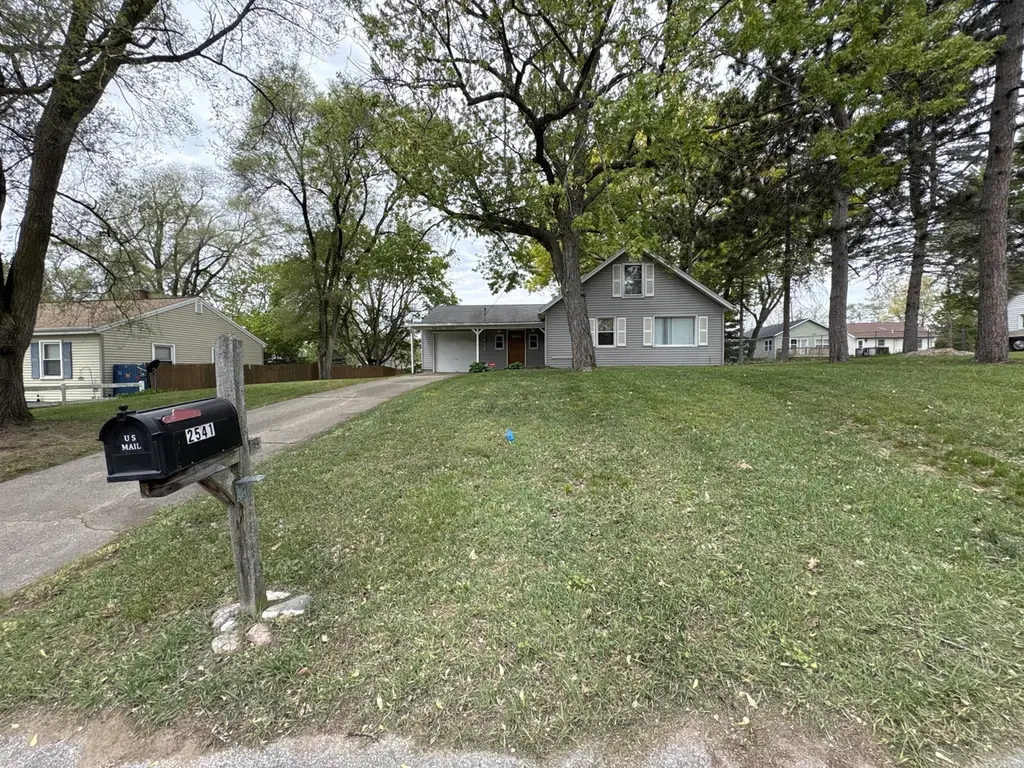
2541 Day Ave NW · Walker, MI
Flood risk 1/10 · Minimal
- FEMA flood zone
- X (unshaded)
- Chance of flooding over 30 yrs
- 0.0%
- Est. flood insurance / yr
- $507 – $1,088
Fire risk 1/10 · Minimal
- Est. fire insurance / yr
- $784 – $1,456
Heat risk 2/10 · Minimal
- Hot days now (above 96°F)
- 7 days/yr
- Hot days in 30 yrs
- 16 days/yr
Wind risk 2/10 · Minimal
- Chance of severe wind over 30 yrs
- —
Air-quality risk 3/10 · Minor
- Unhealthy air days now
- 2 days/yr
- Unhealthy air days in 30 yrs
- 3 days/yr
Risk factors via First Street. Map © Google.
Why this score? — see what drove the D grade
The composite is a weighted blend of 9 inputs, each scored 0–100. Each bar is that input's sub-score; the figure is the points it added to the 100-point composite (weight × sub-score).
- ARV discount +15.0/15.0
- Cash flow +9.6/30.0
- Livability +3.7/5.0
- Schools +3.4/10.0
- DSCR +2.7/10.0
- Rent growth +2.5/5.0
- Condition / age +2.5/5.0
- 1% rule +1.9/10.0
- Appreciation +0.0/10.0
$229,000
🖨 Deal sheet (PDF) 📄 Offer letter ✓ Due diligence
Listing remarks MLS
Welcome to 2541 Day Ave NW, a thoughtfully laid-out 2-bedroom, 1-bath home offering comfortable main-floor living with added flexibility upstairs. The main level features approximately 1,284 square feet, including a generous living area and a well-sized kitchen with abundant storage and workspace. The upper level expands the home's functionality with a loft-style area and second bedroom, creating additional finished space ideal for guests, a home office, or a private retreat. Situated in a lovely neighborhood in Grand Rapids atop a slab foundation, this home offers convenient single-level living with everything located on the main floor, plus bonus space above. Storage is plentiful, including excellent attic storage options. Recent improvements include a new wood deck in the backyard, which is mostly enclosed by neighboring fencing. An attached one-stall garage adds everyday convenience. Whether you're looking for an efficient primary residence or aninvestment opportunity in a desirable location, this home offers solid space, practical features, and room to make it your own with cosmetic updates.
Key facts
- 0.23 acre lot
- Garage
- Built 1940
Property features AI
Exterior
- Parking: Attached garage (1 car)
- Utilities: Natural gas connected; Natural gas water heater
- Home design: Single family residence; Residential property
- Construction: Built in 1940; Vinyl siding; Composition/shingle roof; Slab foundation
- Exterior features: Paved road access; Public water
Interior
- Kitchen: Dishwasher; Disposal; Microwave; Range; Refrigerator
- Bedrooms: Primary bedroom; Second bedroom
- Bathrooms: One full bathroom
- Heating & cooling: Forced air heating; Has heating
- Interior features: Eight total rooms; Mudroom; Loft
- Laundry & utility: Washer; Dryer; Laundry room
Neighborhood map
What this means for you Summary
Snapshot
- This is a 2-bed/1.0-bath single-family listed at $229k.
Deal economics
- At list price, monthly cash flow is $-154 ($-2k/yr) — negative.
- To cash-flow at today's rent, offer at most $202k (11.8% below list).
- To meet the 1% rule (rent ≥ 1% of price), the offer needs to be $158k (30.8% below list).
- Recommended offer: $158k (30.8% below list) — sets the bar for 1% rule.
- Cap rate 5.5% vs local median 3.8% in Walker — top-decile yield for the area; either an underpriced asset or a hidden risk that comps aren't pricing in. Stress-test before assuming the spread holds.
Location & tenants
- Location reads 74/100 on livability (#188 in MI, #4,765 nationally) — a middle-class / working-renter tenant base. Strengths: cost of living A+, housing A+, employment B+; Watch: amenities F, health & safety F.
- Kenowa Hills Public Schools (suburban): math 33% / reading 46% proficiency, ranked #205 of 540 in MI (top 38%) — families likely to look elsewhere, expect single-tenant / working-renter base with shorter leases.
- Market conditions: 25 active listings in the ZIP; 6 comparable units currently listed for rent nearby; rentals lingering (median 45d on market — plan ~5-8 weeks vacancy on turnover, expect pricing pressure); 67% of comp listings sitting > 30 days — soft ceiling on asking rent; 2,253 units permitted in Kent County in 2024 (969 in 5+ unit buildings).
Forward outlook
- Local home prices are declining (-3.0%/yr); year-one equity from $2k of loan paydown is wiped out by about $7k of value loss. Plan a longer hold.
- Kent County population projected at +22% by 2050 — long-run rental-demand tailwind backs the buy-and-hold thesis.
Negotiation context
- Only 1 days on market — expect competitive offers; lowballing is unlikely to land.
- 7 sale attempts since 21y ago with the ask held roughly flat each time — persistent listings suggest the price (not the market) is what's stuck; bring a comps-based counter.
- Current owner paid $32k; list at $229k implies a 609% gain — meaningful room to come down on a strong offer.
Risks & watch-outs
- Watch-outs: built in 1940 — expect roof / HVAC / electrical / plumbing capex.
Questions for the listing agent
- What do current leases actually rent for vs. the listed asking? Can we see a recent rent roll and the last 12 months of T-12 income?
- Built in 1940 — when were the roof, HVAC, electrical panel, plumbing, and water heater last replaced?
- Is there a deadline driving the sale (1031 exchange, divorce, estate, relocation)? That informs how much negotiation room exists.
- The area grade is low — what's the realistic commute time and amenity access for the typical tenant pool here? Any planned neighborhood developments (good or bad) we should know about?
- What's the average days-on-market for RENTAL listings here right now (not sales)? A rising rental-DOM trend means longer vacancies and softer asking-rent achievability than the comps imply.
- What's the recent tenant-quality profile in this submarket — average credit score on applications, eviction rate, late-payment / NSF rate, and stable-employment percentage? A property-management company in the area should have these aggregated.
- How much new for-sale + rental construction is in the pipeline within 1–3 miles? Heavy new supply typically softens prices + rents 12–24 months out; constrained supply supports both.
Investment metrics
- 1% rule
- 0.69% ✗
- Cap rate
- 5.49%
- Cash-on-cash
- -2.87%
- DSCR
- 0.87
- GRM
- 12.1
CMA / ARV
- ARV (median comp)
- $276,705
- List price
- $229,000
- Delta
- -17.24%
- Verdict
- UNDERPRICED
- Comps
- 20 within 1.0 mi
Show comp detail 12 sales within ~0.75 mi
| Address | Dist | Beds/Ba | Sqft | Sold | Price | $/sf | Match |
|---|---|---|---|---|---|---|---|
| 2536 Day Ave NW | 0.03mi | 2/1.0 | 1,316 (+2%) | 2mo | $275,000 | $209 | 93 |
| 2425 Miller Ave NW | 0.05mi | 2/2.0 | 1,203 (-6%) | 12mo | $345,000 | $287 | 73 |
| 2446 Hufford Ave NW | 0.08mi | 3/2.0 (+1) | 1,344 (+5%) | 20mo | $270,000 | $201 | 63 |
| 947 Roger St NW | 0.56mi | 2/1.0 | 1,340 (+4%) | 5mo | $210,000 | $157 | 62 |
| 2210 Gaynor Ave NW | 0.52mi | 2/1.0 | 1,288 (+0%) | 17mo | $237,500 | $184 | 61 |
| 963 Harding St NW | 0.44mi | 2/1.0 | 1,340 (+4%) | 21mo | $258,100 | $193 | 55 |
| 2728 Cornelia Ave NW | 0.36mi | 2/1.0 | 1,150 (-10%) | 15mo | $230,000 | $200 | 53 |
| 2723 Emerson Ave NW | 0.71mi | 3/1.5 (+1) | 1,294 (+1%) | 7mo | $325,000 | $251 | 53 |
| 920 Jones St NW | 0.45mi | 3/2.0 (+1) | 1,383 (+8%) | 17mo | $290,000 | $210 | 43 |
| 907 Roger St NW | 0.51mi | 3/1.5 (+1) | 1,424 (+11%) | 10mo | $282,500 | $198 | 43 |
| 852 Harding St NW | 0.37mi | 3/1.0 (+1) | 1,154 (-10%) | 22mo | $262,500 | $227 | 42 |
| 1026 Cogswell St NW | 0.60mi | 2/2.0 | 1,412 (+10%) | 21mo | $279,500 | $198 | 34 |
Match score weights: distance 35% · size 25% · config 20% · recency 20%. Top-matched comps best support the ARV.
Projected returns pro-forma
-3.0% appreciation · 3.0% rent growth · sell at horizon
- IRR
- -21.1%
- Equity multiple
- 0.27×
- Total profit
- $-46,975
- Equity at exit
- $34,145
- IRR
- -14.7%
- Equity multiple
- 0.16×
- Total profit
- $-53,848
- Equity at exit
- $19,800
Cash invested: $64,120 (down + closing). Projections, not guarantees.
Landlord ↔ Tenant lean methodology
- Overall (STATE)
- 62 Landlord-Friendly
- State Michigan
- 62 Landlord-Friendly · EVEN
- County
- — inherits STATE
- City
- — inherits STATE
ZIP-level market 49544
- Home prices YoY
- -28.8%
- Active inventory
- 25
- Price-to-rent
- 12.1×
Monthly cashflow live
- Estimated rent
- $1,584 high interval (Pro) →
- Mortgage (P&I)
- −$1,201
- Tax from tax record
- −$108 /mo · $1,300/yr
- Insurance
- −$95
- HOA
- −$0
- Vacancy / Maint / Mgmt
- −$333
- Net cashflow
- $-154
Break-even live
Sensitivity live
| Price | -10% $-24 | -5% $-89 | +0% $-154 | +5% $-218 | +10% $-283 |
|---|---|---|---|---|---|
| Rent | -10% $-279 | -5% $-216 | +0% $-154 | +5% $-91 | +10% $-28 |
| Rate | -1.0pp $-38 | -0.5pp $-95 | base $-154 | +0.5pp $-213 | +1.0pp $-273 |
UW: 25.0% down · 7.5% · 30yr · 1.5% tax · 5.0% vac · 8.0% maint · 8.0% mgmt
Financing live
Cash to close
- Down payment
- $57,250
- Closing costs
- $6,870
- Reserves months
- —
- Total cash needed
- —
Loan-product check · same deal, 3 products live
Conventional
25% down · 7.5% · 30yr
- Down + closing
- —
- Monthly P&I
- —
- Monthly cashflow
- —
- DSCR
- —
- Eligible?
- —
Personal DTI + credit; lowest rate.
DSCR
20% down · 8.5% · 30yr
- Down + closing
- —
- Monthly P&I
- —
- Monthly cashflow
- —
- DSCR
- —
- Eligible?
- —
No personal income docs; deal must DSCR.
Hard money
10% down · 12.0% · 12mo
- Down + closing
- —
- Monthly P&I
- —
- Monthly cashflow
- —
- DSCR
- —
- Eligible?
- —
Short-term bridge; refi at stabilization.
Rent comps 6 comps
| Address | Beds | Baths | Sqft | Rent | $/sqft | DOM | Units | Dist |
|---|---|---|---|---|---|---|---|---|
| 2449 Hillside Dr NW Grand Rapids, MI | 2.0 | 1.0 | 900 | $1,495 | $1.66 | 15d | 1 | 0.09mi |
| 873 McCarty St NW Grand Rapids, MI | 3.0 | 2.0 | 1492 | $2,100 | $1.41 | 3d | 1 | 0.22mi |
| 1756 Tamarack Ave NW Grand Rapids, MI | 3.0 | 2.0 | 1700 | $2,195 | $1.29 | 44d | 1 | 0.95mi |
| 2317 Coit Ave NE Grand Rapids, MI | 2.0 | 1.0 | 1087 | $1,700 | $1.56 | 44d | 1 | 1.15mi |
| 1844 Monroe Ave NW Grand Rapids, MI | 2.0 | 1.0 | 1000 | $2,050 | $2.05 | 44d | 1 | 1.20mi |
| 1429 Quarry Ave NW Unit 1 Grand Rapids, MI | 3.0 | 1.5 | 1200 | $1,800 | $1.50 | 44d | 1 | 1.40mi |
Listing history 12 events
-
2026-05-15historical $229,000 996-char remark
Show marketing remark (964 chars)
Welcome to 2541 Day Ave NW, a thoughtfully laid-out 2-bedroom, 1-bath home offering comfortable main-floor living with added flexibility upstairs. The main level features approximately 1,284 square feet, including a generous living area and a well-sized kitchen with abundant storage and workspace. The upper level expands the home's functionality with a loft-style area and second bedroom, creating additional finished space ideal for guests, a home office, or a private retreat. Situated in a lovely neighborhood in Grand Rapids atop a slab foundation, this home offers convenient single-level living with everything located on the main floor, plus bonus space above. Storage is plentiful, including excellent attic storage options. Recent improvements include a new wood deck in the backyard, which is mostly enclosed by neighboring fencing. An attached one-stall garage adds everyday convenience. Whether you're looking for an efficient primary residence or an
-
2026-05-15historical $229,000
Show marketing remark (964 chars)
Welcome to 2541 Day Ave NW, a thoughtfully laid-out 2-bedroom, 1-bath home offering comfortable main-floor living with added flexibility upstairs. The main level features approximately 1,284 square feet, including a generous living area and a well-sized kitchen with abundant storage and workspace. The upper level expands the home's functionality with a loft-style area and second bedroom, creating additional finished space ideal for guests, a home office, or a private retreat. Situated in a lovely neighborhood in Grand Rapids atop a slab foundation, this home offers convenient single-level living with everything located on the main floor, plus bonus space above. Storage is plentiful, including excellent attic storage options. Recent improvements include a new wood deck in the backyard, which is mostly enclosed by neighboring fencing. An attached one-stall garage adds everyday convenience. Whether you're looking for an efficient primary residence or an
-
2012-07-27soldstatus $32,300
-
2012-07-27soldstatus $32,300
-
2012-05-14$35,000
-
2012-05-14$35,000
-
2006-05-26soldstatus $86,500
-
2006-05-09soldstatus $86,500
-
2006-05-09soldstatus $86,500
-
2005-10-31$79,900
-
2005-10-31$79,900
-
2005-09-30soldstatus $42,000
ⓘ Source: listings_history table (triggers on properties + properties_extension) + one-shot
backfill from property_details.listing_events for pre-trigger history.
Tax reassessment forecast MI · Partial reset (capped growth)
- Current annual tax
- $1,300 · $108/mo
- Projected year-2 tax
- $2,413 · $201/mo
- Expected delta
- +$1,113/yr (+$93/mo · 85.6%)
ⓘ Screening estimate from a state-policy table — verify with the county assessor before closing.
Climate risk First Street
- Flood 1/10 Low FEMA zone X (unshaded) · 0% chance over 30 yrs
- Wildfire 1/10 Low
- Heat 2/10 Low 7 d/yr ≥96°F today · 16 d/yr by 30 yrs out
- Wind 2/10 Low
- Air quality 3/10 Moderate 2 unhealthy d/yr today · 3 by 30 yrs out
Nearby sold comps map
Loading sold comps map…
Walkable amenities ~0.75 mi
Loading nearby amenities…
Taxation est. · year 1
- Rental income
- $19,004
- − Mortgage interest
- −$12,828
- − Property taxes
- −$1,300
- − Insurance
- −$1,145
- − Repairs & maintenance
- −$1,520
- − Management
- −$1,520
- − Depreciation
- −$6,662
- Taxable loss
- −$5,971
- Est. tax savings @ 24.0%
- +$1,433
- After-tax cash flow
- $-410/yr
For passive investors: Depreciation is non-cash, so a rental often shows a tax loss while cash-flowing — sheltering income. Rental losses are passive: they offset passive income freely, and up to $25,000/yr can offset ordinary (W-2) income if you actively participate and your MAGI is under $100k (phasing out to $0 by $150k); unused losses carry forward. On sale, claimed depreciation is recaptured at up to 25%, and gains may owe capital-gains tax (a 1031 exchange can defer both). Figures are a year-1 estimate at your 24.0% rate — not tax advice; consult a CPA.
Schools (NCES district)
- District
- Kenowa Hills Public Schools
- NCES district ID
- 2620280
- Math proficiency
- 33% ▬ 0.00%
- Reading proficiency
- 46% ▼ -6.00%
- Median HH income
- $53,387
- Composite
- 34.36/100
- National rank
- #5221
- State rank
- #205 of 540 in MI
Livability — Walker
- Score
- 74/100
- State rank
- #188
- US rank
- #4765
Category grades
Schools grade is shown separately in the Schools card above.
Census & demographics
- Census place
- Walker, MI
- County
- Kent County · 533,805 people
- City population
- 33,350
- Metro
- Grand Rapids-Kentwood, MI
- Population (ZIP)
- 9,631
- Household income
- $74,390
- Rent vs Own
- Severe rent burden
- 313.0
Population outlook (Kent County) Hauer SSP2
- Today (2025)
- 712,484 people
- By 2030
- 748,618 · +5.1%
- By 2040
- 814,777 · +14.4%
- By 2050
- 868,556 · +21.9%
- By 2075
- 966,487 · +35.7%
- By 2100
- 967,975 · +35.9%
Race, ethnicity, and origin ACS 2023
- Neighborhood character
- Predominantly White (78%)
- Race & ethnicity
- White 78% Hispanic / Latino 10% Two or more races 10% Asian 3% Black 3%
- Hispanic origin (detail)
- Mexican 8%
- Common ancestry
- Iranian 15% Romanian 10% Lithuanian 2%
- Foreign-born
- 6% · Canada, Vietnam
- Languages at home
- 91% English-only · Spanish 4% Arabic 2% Other Asian/Pacific 1%
Political lean MEDSL · Kent
- 2024 margin
- Lean D (+5.4) · D 51.8% · R 46.5% · Other 1.7%
- 2008→2024 swing
- +4.8pp toward D · 2008: 0.5pp · 2024: 5.4pp
- All cycles
- 2024: D+5.4 2020: D+6.1 2016: R+3.1 2012: R+7.9 2008: D+0.5
Not yet ingested
- Civics
- —
Market trends
- HPI YoY
- ▼ -110.30%
- Current HPI
- 273.0015
- Rent YoY
- —
- Metro
- Grand Rapids-Kentwood, MI
- State GDP YoY
- ▲ 1.37%
- F500 in state
- 28
Industry mix (Fortune 500 HQ in MI)
| Industry | F500 HQs | Revenue |
|---|---|---|
| Automotive Parts | 3 | $48B |
|
||
| Automotive | 2 | $372B |
|
||
| Chemicals | 1 | $45B |
|
||
| Automotive Retail | 1 | $29B |
|
||
| Healthcare / Medical Devices | 1 | $23B |
|
||
| Automotive Technology | 1 | $20B |
|
||
Price history
+445.2% since first listed18 events — show timeline
- 2026-05-22 Pending — REALCOMP
- 2026-05-22 Pending — MiRealSource-MiMLS
- 2026-05-22 Pending — SW Michigan MLS
- 2026-05-20 Listed $229,000 REALCOMP
- 2026-05-20 Listed $229,000 SW Michigan MLS
- 2026-05-20 Listed $229,000 MiRealSource-MiMLS
- 2026-05-15 Coming Soon $229,000 MiRealSource-MiMLS
- 2026-05-15 Coming Soon $229,000 SW Michigan MLS
- 2012-07-27 Sold (MLS) $32,300 REALCOMP
- 2012-07-27 Sold (MLS) $32,300 SW Michigan MLS
- 2012-05-14 Listed $35,000 REALCOMP
- 2012-05-14 Listed $35,000 SW Michigan MLS
- 2006-05-26 Sold (Public Records) $86,500 Public Records
- 2006-05-09 Sold (MLS) $86,500 REALCOMP
- 2006-05-09 Sold (MLS) $86,500 SW Michigan MLS
- 2005-10-31 Listed $79,900 REALCOMP
- 2005-10-31 Listed $79,900 SW Michigan MLS
- 2005-09-30 Sold (Public Records) $42,000 Public Records
Property tax history
+3.2%/yrLatest (2025): $1,300 · +2.6% YoY. Source: county tax records.
Cash-flow waterfall
monthlySold comps — $/sqft
last 12 mo · ≤1 miLoading sold comps…