315 W San Pedro St · Laredo, TX
Flood risk 4/10 · Minor
- FEMA flood zone
- X (unshaded)
- Chance of flooding over 30 yrs
- 0.2%
- Est. flood insurance / yr
- $507 – $1,088
Fire risk 1/10 · Minimal
- Est. fire insurance / yr
- $1,222 – $2,270
Heat risk 8/10 · Major
- Hot days now (above 110°F)
- 7 days/yr
- Hot days in 30 yrs
- 23 days/yr
Wind risk 8/10 · Major
- Chance of severe wind over 30 yrs
- 80.0%
Air-quality risk 1/10 · Minimal
- Unhealthy air days now
- 0 days/yr
- Unhealthy air days in 30 yrs
- 0 days/yr
Risk factors via First Street. Map © Google.
Why this score? — see what drove the C- grade
The composite is a weighted blend of 9 inputs, each scored 0–100. Each bar is that input's sub-score; the figure is the points it added to the 100-point composite (weight × sub-score).
- Cash flow +22.5/30.0
- ARV discount +7.5/15.0
- DSCR +7.2/10.0
- 1% rule +6.1/10.0
- Livability +3.7/5.0
- Rent growth +2.5/5.0
- Condition / age +2.5/5.0
- Schools +2.0/10.0
- Appreciation +0.0/10.0
$90,000
🖨 Deal sheet 📄 Offer letter ✓ Due diligence
Listing remarks MLS
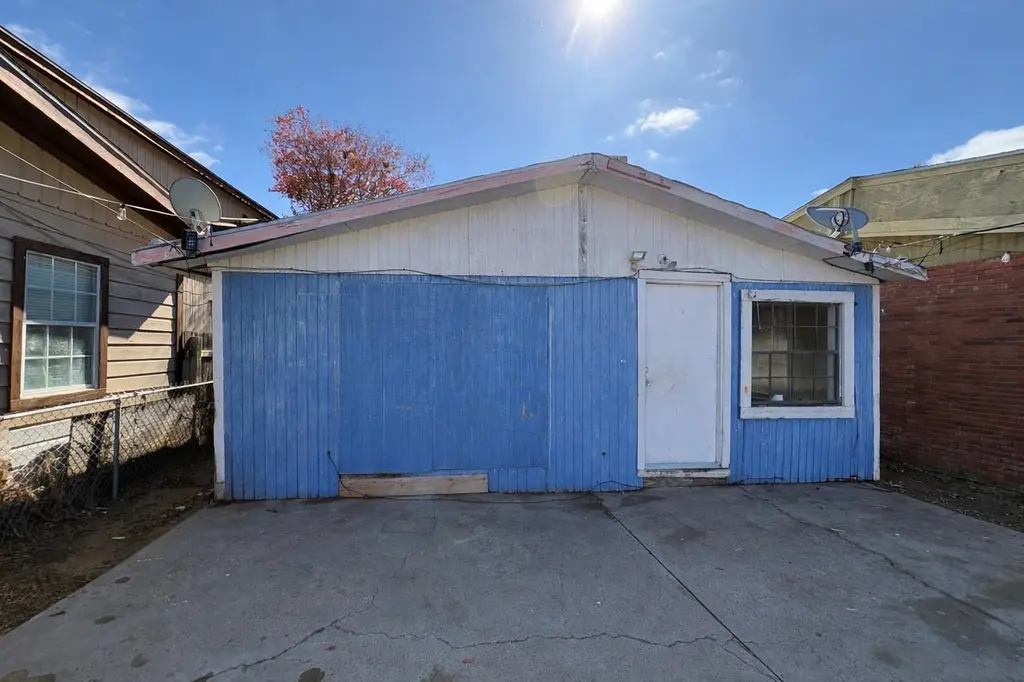
This 2 bed, 2 bath, 750 sq ft home is in need of remodeling and is being sold as-is. Excellent opportunity for investors or buyers ready to renovate. Ideal for a flip, rental, or personal project.
Key facts
- 4,252 sq ft lot
- Built 1972
- Listed 132 days
Neighborhood map
What this means for you Summary
Snapshot
- This is a 2-bed/2.0-bath single-family listed at $90k.
Deal economics
- At list price, monthly cash flow is $152 ($2k/yr) — positive.
- The deal already cash-flows at list — no discount required.
- Meets the 1% rule at list price ($995 rent vs $90k).
- Recommended offer: $79k (12.0% below list) — sets the bar for market timing.
- Cap rate 8.3% vs local median 4.1% in Laredo — top-decile yield for the area; either an underpriced asset or a hidden risk that comps aren't pricing in. Stress-test before assuming the spread holds.
Location & tenants
- Location reads 73/100 on livability (#227 in TX) — a middle-class / working-renter tenant base. Strengths: cost of living A+, housing A+, health & safety A+; Watch: schools C-, crime C-, employment D+.
- Laredo ISD (urban): math 21% / reading 29% proficiency, ranked #739 of 826 in TX (top 90%) — low school quality limits family demand, transient renter base, plan for 1-2y turnover; 82% free/reduced lunch — lower-income household profile, screen leases tightly.
- Market conditions: 124 active listings in the ZIP; 18 comparable units currently listed for rent nearby; rentals lingering (median 44d on market — plan ~5-8 weeks vacancy on turnover, expect pricing pressure); 100% of comp listings sitting > 30 days — soft ceiling on asking rent; 1,448 units permitted in Webb County in 2024 (245 in 5+ unit buildings).
Forward outlook
- Local home prices are declining (-3.0%/yr); year-one equity from $622 of loan paydown is wiped out by about $3k of value loss. Plan a longer hold.
- Webb County population projected at +23% by 2050 — long-run rental-demand tailwind backs the buy-and-hold thesis.
Negotiation context
- It's been on market 132 days — a 12% lower offer ($79k) is reasonable based on typical stale-listing flexibility.
Risks & watch-outs
- Climate carrying-cost: severe wind risk, 80% chance of damaging wind over 30y; extreme-heat days projected 7→23/yr by 2055 (HVAC capex compounding) — expect insurance premiums to compound above CPI over the hold.
Questions for the listing agent
- It's been on market 132 days. Have you received any prior offers? Is the seller open to a 12% concession, seller financing, or rate buy-down credit?
- Built in 1972 — when were the roof, HVAC, electrical panel, plumbing, and water heater last replaced?
- Why hasn't it sold? Are there any deal-killer items the seller is aware of (foundation, flood, title, zoning, code violations)?
- Is there a deadline driving the sale (1031 exchange, divorce, estate, relocation)? That informs how much negotiation room exists.
- What's the average days-on-market for RENTAL listings here right now (not sales)? A rising rental-DOM trend means longer vacancies and softer asking-rent achievability than the comps imply.
- What's the recent tenant-quality profile in this submarket — average credit score on applications, eviction rate, late-payment / NSF rate, and stable-employment percentage? A property-management company in the area should have these aggregated.
- How much new for-sale + rental construction is in the pipeline within 1–3 miles? Heavy new supply typically softens prices + rents 12–24 months out; constrained supply supports both.
Investment metrics
- 1% rule
- 1.11% ✓
- Cap rate
- 8.32%
- Cash-on-cash
- 7.22%
- DSCR
- 1.32
- GRM
- 7.5
CMA / ARV
No comps found within radius.
Projected returns pro-forma
-3.0% appreciation · 3.0% rent growth · sell at horizon
- IRR
- -5.2%
- Equity multiple
- 0.81×
- Total profit
- $-4,898
- Equity at exit
- $13,419
- IRR
- 4.5%
- Equity multiple
- 1.33×
- Total profit
- $8,270
- Equity at exit
- $7,782
Cash invested: $25,200 (down + closing). Projections, not guarantees.
Landlord ↔ Tenant lean methodology
- Overall (STATE)
- 87 Strongly Landlord-Friendly
- State Texas
- 87 Strongly Landlord-Friendly · R+5
- County
- — inherits STATE
- City
- — inherits STATE
ZIP-level market 78041
- Active inventory
- 124
- Price-to-rent
- 7.5×
Monthly cashflow live
- Estimated rent
- $995 high interval (Pro) →
- Mortgage (P&I)
- −$472
- Tax from tax record
- −$125 /mo · $1,497/yr
- Insurance
- −$38
- HOA
- −$0
- Vacancy / Maint / Mgmt
- −$209
- Net cashflow
- $152
Break-even live
UW: 25.0% down · 7.5% · 30yr · 1.5% tax · 5.0% vac · 8.0% maint · 8.0% mgmt
Financing live
Cash to close
- Down payment
- $22,500
- Closing costs
- $2,700
- Reserves months
- —
- Total cash needed
- —
Loan-product check · same deal, 3 products live
Conventional
25% down · 7.5% · 30yr
- Down + closing
- —
- Monthly P&I
- —
- Monthly cashflow
- —
- DSCR
- —
- Eligible?
- —
Personal DTI + credit; lowest rate.
DSCR
20% down · 8.5% · 30yr
- Down + closing
- —
- Monthly P&I
- —
- Monthly cashflow
- —
- DSCR
- —
- Eligible?
- —
No personal income docs; deal must DSCR.
Hard money
10% down · 12.0% · 12mo
- Down + closing
- —
- Monthly P&I
- —
- Monthly cashflow
- —
- DSCR
- —
- Eligible?
- —
Short-term bridge; refi at stabilization.
Rent comps 18 comps
| Address | Beds | Baths | Sqft | Rent | $/sqft | DOM | Units | Dist |
|---|---|---|---|---|---|---|---|---|
| 419 W Eistetter St Unit 7 Laredo, TX | 2.0 | 1.0 | 756 | $980 | $1.30 | 43d | 1 | 0.22mi |
| 4505 Springfield Ave Laredo, TX | 1.0–3.0 | 1.0–2.0 | 740 | $875 | $1.18 | 43d | 3 | 0.47mi |
| 705 Bustamante St Unit 6 Laredo, TX | 2.0 | 1.0 | 585 | $850 | $1.45 | 43d | 1 | 0.54mi |
| 3801 Salinas Ave Unit 12 Laredo, TX | 2.0 | 1.0 | 654 | $925 | $1.41 | 43d | 1 | 0.62mi |
| 1303 Philadelphia St Unit 3 Laredo, TX | 1.0 | 1.0 | 554 | $850 | $1.53 | 43d | 1 | 0.67mi |
| 2605 Springfield Ave Unit 4 Laredo, TX | 2.0 | 1.0 | 728 | $850 | $1.17 | 43d | 1 | 0.90mi |
| 5402 Marcella Ave Unit 103A Laredo, TX | 1.0 | 1.0 | 754 | $925 | $1.23 | 43d | 1 | 0.92mi |
| 5402 Marcella Ave Unit 102A Laredo, TX | 2.0 | 1.5 | 783 | $1,200 | $1.53 | 43d | 1 | 0.92mi |
| 5402 Marcella Ave Unit 209B Laredo, TX | 2.0 | 1.5 | 754 | $1,150 | $1.53 | 43d | 1 | 0.92mi |
| 5402 Marcella Ave Unit 201A Laredo, TX | 3.0 | 2.0 | 807 | $1,300 | $1.61 | 43d | 1 | 0.93mi |
| 5402 Marcella Ave Unit 302 A Laredo, TX | 2.0 | 1.5 | 754 | $1,040 | $1.38 | 43d | 1 | 0.94mi |
| 5410 Marcella Ave Unit 13 Laredo, TX | 2.0 | 2.0 | 945 | $1,200 | $1.27 | 43d | 1 | 0.96mi |
| 5410 Marcella Ave #9 Laredo, TX | 2.0 | 2.0 | 945 | $1,300 | $1.38 | 43d | 1 | 0.96mi |
| 1502 E San Pedro St Laredo, TX | 2.0 | 1.0 | 793 | $900 | $1.13 | 43d | 1 | 1.05mi |
| 1502 E San Pedro St Unit 11 Laredo, TX | 2.0 | 1.0 | 793 | $900 | $1.13 | 43d | 1 | 1.05mi |
| 1315 E Hillside Rd Laredo, TX | 2.0 | 1.5 | 920 | $1,000 | $1.09 | 43d | 1 | 1.36mi |
| 1204 E Hillside Rd Laredo, TX | 1.0–2.0 | 1.0 | 755 | $950 | $1.26 | 43d | 1 | 1.37mi |
| 615 E Lane St Unit 1 Laredo, TX | 2.0 | 1.0 | 650 | $1,100 | $1.69 | 43d | 1 | 1.41mi |
Listing history 13 events
-
2026-06-10days on market $90,000 Active 132 DOM
-
2026-06-08days on market $90,000 Active 131 DOM
-
2026-06-08days on market $90,000 Active 130 DOM
-
2026-06-07days on market $90,000 Active 129 DOM
-
2026-06-03days on market $90,000 Active 126 DOM
-
2026-06-02days on market $90,000 Active 125 DOM
-
2026-06-01days on market $90,000 Active 124 DOM
-
2026-05-31days on market $90,000 Active 123 DOM
-
2026-04-23price $90,000 196-char remark
Show marketing remark (196 chars)
This 2 bed, 2 bath, 750 sq ft home is in need of remodeling and is being sold as-is. Excellent opportunity for investors or buyers ready to renovate. Ideal for a flip, rental, or personal project.
-
2026-04-16price $95,000 196-char remark
Show marketing remark (196 chars)
This 2 bed, 2 bath, 750 sq ft home is in need of remodeling and is being sold as-is. Excellent opportunity for investors or buyers ready to renovate. Ideal for a flip, rental, or personal project.
-
2026-01-28$115,000 Active 196-char remark
Show marketing remark (196 chars)
This 2 bed, 2 bath, 750 sq ft home is in need of remodeling and is being sold as-is. Excellent opportunity for investors or buyers ready to renovate. Ideal for a flip, rental, or personal project.
-
2010-09-15soldstatus
-
1992-01-16soldstatus
ⓘ Source: listings_history table (triggers on properties + properties_extension) + one-shot
backfill from property_details.listing_events for pre-trigger history.
Tax reassessment forecast TX · Resets to sale price
- Current annual tax
- $1,497 · $125/mo
- Projected year-2 tax
- $1,647 · $137/mo
- Expected delta
- +$150/yr (+$13/mo · 10.0%)
ⓘ Screening estimate from a state-policy table — verify with the county assessor before closing.
Climate risk First Street
- Flood 4/10 Moderate FEMA zone X (unshaded) · 20% chance over 30 yrs
- Wildfire 1/10 Low
- Heat 8/10 Severe 7 d/yr ≥110°F today · 23 d/yr by 30 yrs out
- Wind 8/10 Severe 80% chance of damaging wind over 30 yrs
- Air quality 1/10 Low 0 unhealthy d/yr today · 0 by 30 yrs out
Nearby sold comps map
Loading sold comps map…
Walkable amenities ~0.75 mi
Loading nearby amenities…
Taxation est. · year 1
- Rental income
- $11,938
- − Mortgage interest
- −$5,041
- − Property taxes
- −$1,497
- − Insurance
- −$450
- − Repairs & maintenance
- −$955
- − Management
- −$955
- − Depreciation
- −$2,618
- Taxable income
- $422
- Est. tax owed @ 24.0%
- −$101
- After-tax cash flow
- $1,719/yr
For passive investors: Depreciation is non-cash, so a rental often shows a tax loss while cash-flowing — sheltering income. Rental losses are passive: they offset passive income freely, and up to $25,000/yr can offset ordinary (W-2) income if you actively participate and your MAGI is under $100k (phasing out to $0 by $150k); unused losses carry forward. On sale, claimed depreciation is recaptured at up to 25%, and gains may owe capital-gains tax (a 1031 exchange can defer both). Figures are a year-1 estimate at your 24.0% rate — not tax advice; consult a CPA.
Schools (NCES district)
- District
- Laredo ISD
- NCES district ID
- 4826790
- Math proficiency
- 21% ▼ -34.00%
- Reading proficiency
- 29% ▼ -13.00%
- Median HH income
- $25,655
- Composite
- 19.7/100
- National rank
- #8724
- State rank
- #739 of 826 in TX
Livability — Laredo
- Score
- 73/100
- State rank
- #227
- US rank
- #5399
Category grades
Schools grade is shown separately in the Schools card above.
Census & demographics
- Census place
- Laredo, TX
- City population
- 67,333
- Population (ZIP)
- 47,089
Population outlook (Webb County) Hauer SSP2
- Today (2025)
- 301,387 people
- By 2030
- 316,307 · +5.0%
- By 2040
- 345,636 · +14.7%
- By 2050
- 370,647 · +23.0%
- By 2075
- 413,907 · +37.3%
- By 2100
- 416,458 · +38.2%
Race, ethnicity, and origin ACS 2023
- Neighborhood character
- Predominantly Hispanic (93%)
- Race & ethnicity
- Hispanic / Latino 93% Two or more races 52% White 5% Asian 1%
- Hispanic origin (detail)
- Mexican 87%
- Foreign-born
- 24% · Canada, South Korea
- Languages at home
- 14% English-only · Spanish 85%
Political lean MEDSL · Webb
- 2024 margin
- Toss-up / Even · D 48.5% · R 50.7%
- 2008→2024 swing
- -45.6pp toward R · 2008: 43.4pp · 2024: -2.2pp
- All cycles
- 2024: R+2.2 2020: D+23.3 2016: D+51.6 2012: D+54.0 2008: D+43.4
Not yet ingested
- Civics
- —
Market trends
- HPI YoY
- ▼ -188.15%
- Current HPI
- 162.152
- Rent YoY
- —
- Metro
- —
- State GDP YoY
- ▲ 3.95%
- F500 in state
- 110
Industry mix (Fortune 500 HQ in TX)
| Industry | F500 HQs | Revenue |
|---|---|---|
| Energy | 16 | $1,198B |
|
||
| Technology | 5 | $198B |
|
||
| Engineering / Construction | 4 | $72B |
|
||
| Energy Services | 3 | $60B |
|
||
| Utilities | 3 | $41B |
|
||
| Healthcare | 2 | $330B |
|
||
Price history
-21.7% since first listed5 events — show timeline
- 2026-04-23 Price Changed $90,000 LAOR
- 2026-04-16 Price Changed $95,000 LAOR
- 2026-01-28 Listed $115,000 LAOR
- 2010-09-15 Sold (Public Records) — Public Records
- 1992-01-16 Sold (Public Records) — Public Records
Property tax history
+3.3%/yrLatest (2025): $1,497 · -4.0% YoY. Source: county tax records.
Cash-flow waterfall
monthlySold comps — $/sqft
last 12 mo · ≤1 miLoading sold comps…