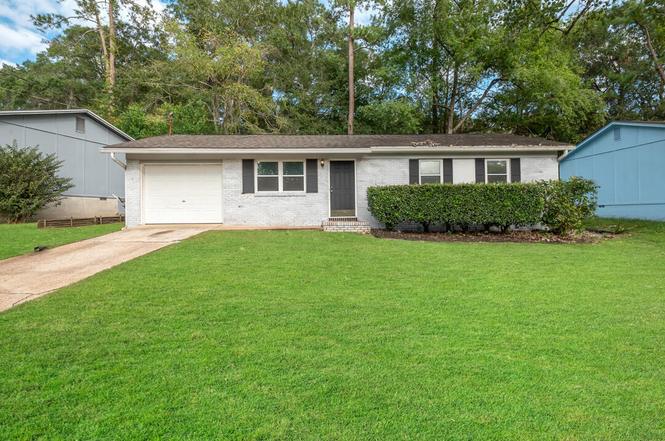
4117 Wiggington Rd · Tallahassee, FL
Flood risk 6/10 · Moderate
- FEMA flood zone
- X (unshaded)
- Chance of flooding over 30 yrs
- 0.65%
- Est. flood insurance / yr
- $507 – $1,088
Fire risk 3/10 · Minor
- Est. fire insurance / yr
- $947 – $1,759
Heat risk 8/10 · Major
- Hot days now (above 108°F)
- 7 days/yr
- Hot days in 30 yrs
- 20 days/yr
Wind risk 9/10 · Severe
- Chance of severe wind over 30 yrs
- 99.0%
Air-quality risk 5/10 · Moderate
- Unhealthy air days now
- 7 days/yr
- Unhealthy air days in 30 yrs
- 7 days/yr
Risk factors via First Street. Map © Google.
Why this score? — see what drove the C+ grade
The composite is a weighted blend of 9 inputs, each scored 0–100. Each bar is that input's sub-score; the figure is the points it added to the 100-point composite (weight × sub-score).
- Cash flow +20.8/30.0
- ARV discount +15.0/15.0
- DSCR +6.6/10.0
- 1% rule +5.5/10.0
- Schools +4.3/10.0
- Livability +4.3/5.0
- Rent growth +3.3/5.0
- Condition / age +2.5/5.0
- Appreciation +0.0/10.0
$187,000
🖨 Deal sheet 📄 Offer letter ✓ Due diligence
Listing remarks
TENANT OCCUPIED! Ranch-style 3BR/1BA home featuring newer windows, tile bathroom, and French doors leading to the backyard. Roof replaced in 2015. HVAC 2009. Conveniently located near shopping and dining. Property is tenant-occupied; ideal for investors or first-time home buyers.
Key facts
- Hvac
- French doors
- Backyard
Tags
Property features AI
Finance
- Financial info: For sale
- HOA & community: Curbs; Gutter(s); Street lights
Exterior
- Parking: Driveway; Garage
- Utilities: Public sewer; Public maintained paved road
- Home design: Single-story; Brick and wood siding construction
- Construction: Crawlspace foundation
- Exterior features: Fully fenced yard; Deck; Patio; Fenced
Interior
- Kitchen: Dishwasher; Icemaker; Microwave; Oven; Range; Refrigerator; Pantry
- Bedrooms: Bedroom 2 (12x11); Bedroom 3 (10x9)
- Flooring: Laminate; Tile
- Bathrooms: 1 full bathroom
- Heating & cooling: Central heating; Electric heating; Heat pump; Central air; Ceiling fan(s); Wall/window unit(s); Electric cooling
- Interior features: Stall shower; Window treatments; Pantry; Walk-in closet(s)
- Laundry & utility: Utility room
Neighborhood map
What this means for you Summary
Snapshot
- This is a 3-bed/1.0-bath single-family listed at $187k.
Deal economics
- At list price, monthly cash flow is $257 ($3k/yr) — positive.
- The deal already cash-flows at list — no discount required.
- Meets the 1% rule at list price ($2k rent vs $187k).
- Recommended offer: $165k (12.0% below list) — sets the bar for market timing.
- Cap rate 7.9% vs local median 4.2% in Tallahassee — top-decile yield for the area; either an underpriced asset or a hidden risk that comps aren't pricing in. Stress-test before assuming the spread holds.
Location & tenants
- Location reads 86/100 on livability (#19 in FL, #429 nationally) — a professional / high-income tenant draw. Strengths: amenities A+, commute A+, health & safety A+; Watch: employment D.
- Leon (urban): math 48% / reading 53% proficiency, ranked #33 of 73 in FL (top 45%) — acceptable for families but not a draw, mixed tenant base, ~2y average lease.
- Market conditions: Rents rising (+3.1%/yr); 238 active listings in the ZIP; 4 comparable units currently listed for rent nearby; rentals at typical pace (median 21d on market — plan ~3-4 weeks tenant-placement turnaround); 1,765 units permitted in Leon County in 2024 (975 in 5+ unit buildings).
- This rent runs 38% of the median local income ($62k/yr) — at the standard rent-burdened threshold; future hikes will face affordability resistance.
Forward outlook
- Local home prices are declining (-3.0%/yr); year-one equity from $1k of loan paydown is wiped out by about $6k of value loss. Plan a longer hold.
- Leon County population projected at +23% by 2050 — long-run rental-demand tailwind backs the buy-and-hold thesis.
Negotiation context
- It's been on market 205 days — a 12% lower offer ($165k) is reasonable based on typical stale-listing flexibility.
- 9 sale attempts since 20y ago; this cycle's ask has dropped $13k (6%) from the opening price — seller is motivated, your offer sets the floor, not the list.
Risks & watch-outs
- Climate carrying-cost: major flood risk; severe wind risk, 99% chance of damaging wind over 30y; extreme-heat days projected 7→20/yr by 2055 (HVAC capex compounding) — expect insurance premiums to compound above CPI over the hold.
Questions for the listing agent
- It's been on market 205 days. Have you received any prior offers? Is the seller open to a 12% concession, seller financing, or rate buy-down credit?
- Built in 1972 — when were the roof, HVAC, electrical panel, plumbing, and water heater last replaced?
- Why hasn't it sold? Are there any deal-killer items the seller is aware of (foundation, flood, title, zoning, code violations)?
- Is there a deadline driving the sale (1031 exchange, divorce, estate, relocation)? That informs how much negotiation room exists.
- Schools are B-rated — typically a magnet for longer-tenancy family renters. What's the average tenant stay here, and is there a school-zone premium baked into asking?
- What's the average days-on-market for RENTAL listings here right now (not sales)? A rising rental-DOM trend means longer vacancies and softer asking-rent achievability than the comps imply.
- What's the recent tenant-quality profile in this submarket — average credit score on applications, eviction rate, late-payment / NSF rate, and stable-employment percentage? A property-management company in the area should have these aggregated.
- How much new for-sale + rental construction is in the pipeline within 1–3 miles? Heavy new supply typically softens prices + rents 12–24 months out; constrained supply supports both.
Investment metrics
- 1% rule
- 1.05% ✓
- Cap rate
- 7.94%
- Cash-on-cash
- 5.89%
- DSCR
- 1.26
- GRM
- 7.9
CMA / ARV
- ARV (on-the-fly)
- $232,700
- Comps found
- 12
Show comp detail 12 sales within ~0.75 mi
| Address | Dist | Beds/Ba | Sqft | Sold | Price | $/sf | Match |
|---|---|---|---|---|---|---|---|
| 2815 Nepal Dr | 0.07mi | 3/1.0 | 1,300 (0%) | 8mo | $200,000 | $154 | 90 |
| 2812 Nepal Dr | 0.09mi | 3/1.0 | 1,356 (+4%) | 2mo | $154,000 | $114 | 87 |
| 4008 Cornish Dr | 0.13mi | 3/2.0 | 1,238 (-5%) | 6mo | $239,000 | $193 | 77 |
| 3839 Wiggington Rd | 0.32mi | 3/1.5 | 1,244 (-4%) | 9mo | $184,000 | $148 | 69 |
| 2032 Harriet Dr | 0.56mi | 3/2.0 | 1,288 (-1%) | 7mo | $236,000 | $183 | 62 |
| 2105 Harriet Dr | 0.62mi | 3/2.0 | 1,371 (+6%) | 6mo | $230,000 | $168 | 53 |
| 2610 Hastings Dr | 0.69mi | 3/2.0 | 1,372 (+6%) | 3mo | $245,000 | $179 | 52 |
| 2034 Harriet Dr | 0.57mi | 3/2.0 | 1,192 (-8%) | 7mo | $215,000 | $180 | 50 |
| 1905 Faulk Dr | 0.73mi | 3/2.0 | 1,356 (+4%) | 9mo | $256,000 | $189 | 48 |
| 1844 Copper Axe | 0.64mi | 3/2.0 | 1,492 (+15%) | 1mo | $245,000 | $164 | 40 |
| 1914 Longview Dr | 0.67mi | 3/2.0 | 1,486 (+14%) | 3mo | $283,000 | $190 | 38 |
| 1933 Faulk Dr | 0.66mi | 2/1.5 (-1) | 1,109 (-15%) | 11mo | $181,500 | $164 | 29 |
Match score weights: distance 35% · size 25% · config 20% · recency 20%. Top-matched comps best support the ARV.
Projected returns pro-forma
-3.0% appreciation · 3.12% rent growth · sell at horizon
- IRR
- -7.1%
- Equity multiple
- 0.74×
- Total profit
- $-13,670
- Equity at exit
- $27,882
- IRR
- 2.7%
- Equity multiple
- 1.20×
- Total profit
- $10,279
- Equity at exit
- $16,168
Cash invested: $52,360 (down + closing). Projections, not guarantees.
Landlord ↔ Tenant lean methodology
- Overall (STATE)
- 87 Strongly Landlord-Friendly
- State Florida
- 87 Strongly Landlord-Friendly · R+3
- County
- — inherits STATE
- City
- — inherits STATE
ZIP-level market 32303
- Rents YoY
- 3.1%
- Active inventory
- 238
- Price-to-rent
- 7.9×
Monthly cashflow live
- Estimated rent
- $1,969 medium interval (Pro) →
- Mortgage (P&I)
- −$981
- Tax from tax record
- −$240 /mo · $2,879/yr
- Insurance
- −$78
- HOA
- −$0
- Vacancy / Maint / Mgmt
- −$413
- Net cashflow
- $257
Break-even live
UW: 25.0% down · 7.5% · 30yr · 1.5% tax · 5.0% vac · 8.0% maint · 8.0% mgmt
Financing live
Cash to close
- Down payment
- $46,750
- Closing costs
- $5,610
- Reserves months
- —
- Total cash needed
- —
Loan-product check · same deal, 3 products live
Conventional
25% down · 7.5% · 30yr
- Down + closing
- —
- Monthly P&I
- —
- Monthly cashflow
- —
- DSCR
- —
- Eligible?
- —
Personal DTI + credit; lowest rate.
DSCR
20% down · 8.5% · 30yr
- Down + closing
- —
- Monthly P&I
- —
- Monthly cashflow
- —
- DSCR
- —
- Eligible?
- —
No personal income docs; deal must DSCR.
Hard money
10% down · 12.0% · 12mo
- Down + closing
- —
- Monthly P&I
- —
- Monthly cashflow
- —
- DSCR
- —
- Eligible?
- —
Short-term bridge; refi at stabilization.
Rent comps 4 comps
| Address | Beds | Baths | Sqft | Rent | $/sqft | DOM | Units | Dist |
|---|---|---|---|---|---|---|---|---|
| 3380 Fred George Rd Tallahassee, FL | 1.0–3.0 | 1.0–2.0 | 895 | $1,700 | $1.90 | 13d | 9 | 0.83mi |
| 3400 Old Bainbridge Rd #203 Tallahassee, FL | 3.0 | 3.0 | 1368 | $1,650 | $1.21 | 21d | 1 | 1.02mi |
| 1729 Ray Rd Tallahassee, FL | 3.0 | 1.0 | 1611 | $3,400 | $2.11 | 21d | 1 | 1.38mi |
| 4234 Augustus Oak Ct Unit 4234 Tallahassee, FL | 3.0 | 3.5 | 1504 | $1,600 | $1.06 | 21d | 1 | 1.44mi |
Listing history 28 events
-
2026-05-31days on market $187,000 Active 205 DOM
-
2026-05-30days on market $187,000 Active 204 DOM
-
2026-04-28price $187,000
-
2026-04-17price $190,000
-
2026-02-26price $194,999
-
2025-11-07$199,999 Active
-
2025-10-31historical
-
2025-09-03historical $2,000
-
2025-08-31$2,000
-
2025-08-25price $199,999
-
2025-08-21price $204,000
-
2025-08-16$214,987 Active
-
2025-08-15historical
-
2025-08-09historical $2,000
-
2025-08-01$214,987
-
2025-07-30historical
-
2025-07-27price $2,000
-
2025-07-25$224,987 Active
-
2025-07-08$2,200
-
2022-10-12soldstatus $171,428
-
2015-04-14soldstatus $103,500
-
2015-04-10soldstatus $103,500
-
2014-10-08$99,000
-
2008-09-07historical
-
2008-06-07$124,900
-
2007-02-06soldstatus $122,000
-
2007-02-01soldstatus $122,000
-
2006-12-04$125,900
ⓘ Source: listings_history table (triggers on properties + properties_extension) + one-shot
backfill from property_details.listing_events for pre-trigger history.
Tax reassessment forecast FL · Resets to sale price
- Current annual tax
- $2,879 · $240/mo
- Projected year-2 tax
- $2,879 · $240/mo
- Expected delta
- $0/yr ($0/mo · 0.0%)
ⓘ Screening estimate from a state-policy table — verify with the county assessor before closing.
Climate risk First Street
- Flood 6/10 Major FEMA zone X (unshaded) · 65% chance over 30 yrs
- Wildfire 3/10 Moderate
- Heat 8/10 Severe 7 d/yr ≥108°F today · 20 d/yr by 30 yrs out
- Wind 9/10 Extreme 99% chance of damaging wind over 30 yrs
- Air quality 5/10 Major 7 unhealthy d/yr today · 7 by 30 yrs out
Nearby sold comps map
Loading sold comps map…
Walkable amenities ~0.75 mi
Loading nearby amenities…
Taxation est. · year 1
- Rental income
- $23,626
- − Mortgage interest
- −$10,475
- − Property taxes
- −$2,879
- − Insurance
- −$935
- − Repairs & maintenance
- −$1,890
- − Management
- −$1,890
- − Depreciation
- −$5,440
- Taxable income
- $117
- Est. tax owed @ 24.0%
- −$28
- After-tax cash flow
- $3,055/yr
For passive investors: Depreciation is non-cash, so a rental often shows a tax loss while cash-flowing — sheltering income. Rental losses are passive: they offset passive income freely, and up to $25,000/yr can offset ordinary (W-2) income if you actively participate and your MAGI is under $100k (phasing out to $0 by $150k); unused losses carry forward. On sale, claimed depreciation is recaptured at up to 25%, and gains may owe capital-gains tax (a 1031 exchange can defer both). Figures are a year-1 estimate at your 24.0% rate — not tax advice; consult a CPA.
Schools (NCES district)
- District
- Leon
- NCES district ID
- 1201110
- Math proficiency
- 48% ▼ -13.00%
- Reading proficiency
- 53% ▼ -5.00%
- Median HH income
- $46,339
- Composite
- 42.84/100
- National rank
- #3131
- State rank
- #33 of 73 in FL
Livability — Tallahassee
- Score
- 86/100
- State rank
- #19
- US rank
- #429
Category grades
Schools grade is shown separately in the Schools card above.
Census & demographics
- County
- Leon County · 294,472 people
- City population
- 294,472
- Metro
- Tallahassee, FL
- Population (ZIP)
- 49,785
- Household income
- $62,275
- Rent vs Own
- Severe rent burden
- 2919.0
Population outlook (Leon County) Hauer SSP2
- Today (2025)
- 315,507 people
- By 2030
- 330,677 · +4.8%
- By 2040
- 358,465 · +13.6%
- By 2050
- 386,804 · +22.6%
- By 2075
- 465,480 · +47.5%
- By 2100
- 519,959 · +64.8%
Race, ethnicity, and origin ACS 2023
- Neighborhood character
- Diverse neighborhood (Simpson 0.63)
- Race & ethnicity
- White 50% Black 34% Hispanic / Latino 8% Two or more races 8% Asian 3%
- Hispanic origin (detail)
- Mexican 2% Puerto Rican 1% Cuban 2%
- Common ancestry
- Slovak 2% Italian 1% Lithuanian 1%
- Foreign-born
- 8% · Canada, Vietnam, China
- Languages at home
- 89% English-only · Spanish 5% Arabic 1% French/Haitian/Cajun 1%
Political lean MEDSL · Leon
- 2024 margin
- Strong D (+21.8) · D 60.3% · R 38.5% · Other 1.2%
- 2008→2024 swing
- -2.5pp toward R · 2008: 24.3pp · 2024: 21.8pp
- All cycles
- 2024: D+21.8 2020: D+28.3 2016: D+25.1 2012: D+23.6 2008: D+24.3
Not yet ingested
- Civics
- —
Market trends
- HPI YoY
- ▼ -255.24%
- Current HPI
- 241.3131
- Rent YoY
- ▲ 3.12%
- Metro
- Tallahassee, FL
- State GDP YoY
- ▲ 3.28%
- F500 in state
- 36
Industry mix (Fortune 500 HQ in FL)
| Industry | F500 HQs | Revenue |
|---|---|---|
| Industrial Technology | 2 | $29B |
|
||
| Insurance | 2 | $17B |
|
||
| Retail | 1 | $60B |
|
||
| Technology Distribution | 1 | $58B |
|
||
| Homebuilding | 1 | $35B |
|
||
| Technology Manufacturing | 1 | $35B |
|
||
Price history
+48.5% since first listed26 events — show timeline
- 2026-04-28 Price Changed $187,000 CATRS
- 2026-04-17 Price Changed $190,000 CATRS
- 2026-02-26 Price Changed $194,999 CATRS
- 2025-11-07 Listed $199,999 CATRS
- 2025-10-31 Listing Removed — CATRS
- 2025-09-03 Rental Removed $2,000 Avail
- 2025-08-31 Listed for Rent $2,000 Avail
- 2025-08-25 Price Changed $199,999 CATRS
- 2025-08-21 Price Changed $204,000 CATRS
- 2025-08-16 Listed $214,987 CATRS
- 2025-08-15 Listing Removed — CATRS
- 2025-08-09 Rental Removed $2,000 Avail
- 2025-08-01 Listed $214,987 CATRS
- 2025-07-30 Listing Removed — realMLS
- 2025-07-27 Price Changed $2,000 Avail
- 2025-07-25 Listed $224,987 realMLS
- 2025-07-08 Listed for Rent $2,200 Avail
- 2022-10-12 Sold (Public Records) $171,428 Public Records
- 2015-04-14 Sold (Public Records) $103,500 Public Records
- 2015-04-10 Sold (MLS) $103,500 CATRS
- 2014-10-08 Listed $99,000 CATRS
- 2008-09-07 Listing Removed — CATRS
- 2008-06-07 Listed $124,900 CATRS
- 2007-02-06 Sold (Public Records) $122,000 Public Records
- 2007-02-01 Sold (MLS) $122,000 CATRS
- 2006-12-04 Listed $125,900 CATRS
Property tax history
+15.1%/yrLatest (2025): $2,879 · +12.1% YoY. Source: county tax records.
Cash-flow waterfall
monthlySold comps — $/sqft
last 12 mo · ≤1 miLoading sold comps…