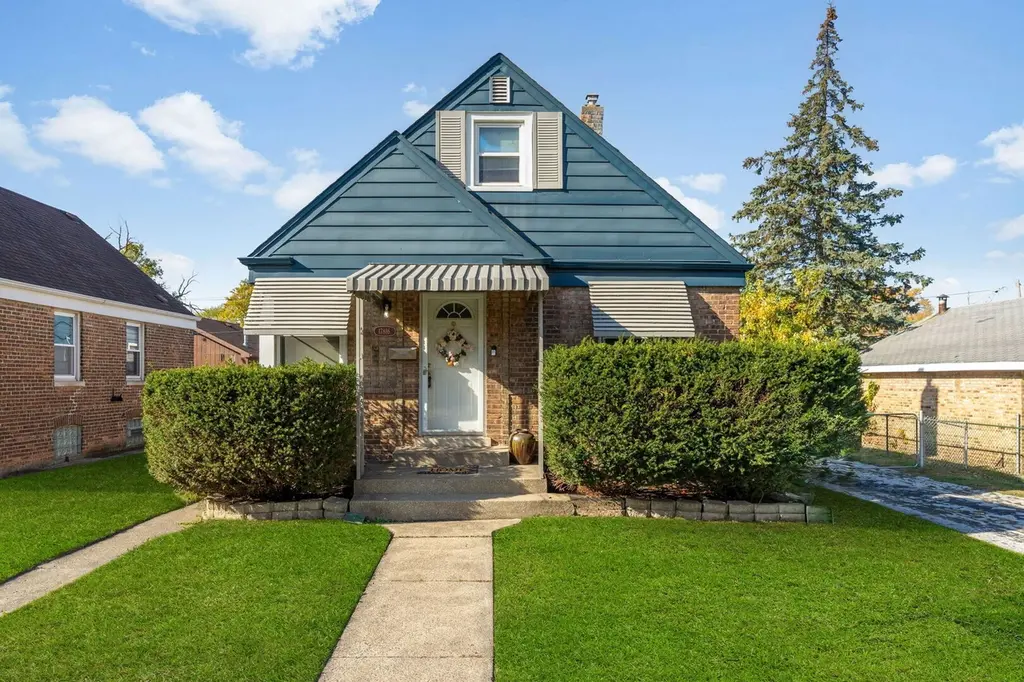
17816 Commercial Ave · Lansing, IL
Flood risk No data
- FEMA flood zone
- —
- Chance of flooding over 30 yrs
- —
- Est. flood insurance / yr
- —
Fire risk No data
- Est. fire insurance / yr
- —
Heat risk No data
- Hot days now (above threshold)
- —
- Hot days in 30 yrs
- —
Wind risk No data
- Chance of severe wind over 30 yrs
- —
Air-quality risk No data
- Unhealthy air days now
- —
- Unhealthy air days in 30 yrs
- —
Risk factors via First Street. Map © Google.
Why this score? — see what drove the C+ grade
The composite is a weighted blend of 9 inputs, each scored 0–100. Each bar is that input's sub-score; the figure is the points it added to the 100-point composite (weight × sub-score).
- Cash flow +25.3/30.0
- ARV discount +15.0/15.0
- DSCR +8.3/10.0
- 1% rule +6.6/10.0
- Livability +3.7/5.0
- Rent growth +2.5/5.0
- Condition / age +2.5/5.0
- Schools +1.0/10.0
- Appreciation +0.0/10.0
$155,000
🖨 Deal sheet (PDF) 📄 Offer letter ✓ Due diligence
Listing remarks
Great opportunity for investors looking for a project in a great neighborhood! Features new carpeting on the main level. Offers 3 bedrooms, a family room, and a full unfinished basement with plenty of potential. Property requires repairs and is priced accordingly. Ideal for investors or buyers using renovation financing. Convenient location near schools, parks, shopping, and expressways. Sold as-is. Short sale - subject to lender approval.
Key facts
- New carpeting
- 7,000 sq ft lot
- 2 garage spots
Tags
Property features AI
Finance
- Other: Living area information from plans; Approx. total finished area 1,268 (plans); total finished/unfinshed area 1,921; main level approx. 957; upper level approx. 311; unfinished basement approx. 653
- HOA & community: No master association fee required
Exterior
- Parking: Detached garage; Side driveway; Total 2 parking spaces (2 garage spaces)
- Utilities: Lake Michigan water source; Public sewer
- Home design: Detached single-family home; 1.5-story design; Fee simple ownership
- Construction: Brick construction; Built 81–90 years ago; Property built before 1978
- Exterior features: Lot approximately 56 x 125; Less than 0.25 acre; Park nearby; Curbs, sidewalks and street lights; Paved streets; Interstate access
Interior
- Kitchen: Eating area / table space; Range; Dishwasher; Refrigerator
- Bedrooms: 3 bedrooms total; Master bedroom on main level; Two additional bedrooms on second level
- Flooring: Carpet in living areas and bedrooms; Vinyl in kitchen and dining room
- Bathrooms: 1 full bathroom; Accessible shower; Soaking tub
- Heating & cooling: Natural gas forced-air heating; Central air conditioning
- Interior features: 7 total rooms; Separate dining room; Unfinished full basement; Basement laundry (in unit)
- Laundry & utility: Washer and dryer included; Laundry room in basement (9 x 9)
Neighborhood map
What this means for you Summary
Snapshot
- This is a 3-bed/1.5-bath single-family listed at $155k.
Deal economics
- At list price, monthly cash flow is $352 ($4k/yr) — positive.
- The deal already cash-flows at list — no discount required.
- Meets the 1% rule at list price ($2k rent vs $155k).
- Cap rate 9.0% vs local median 5.8% in Lansing — top-decile yield for the area; either an underpriced asset or a hidden risk that comps aren't pricing in. Stress-test before assuming the spread holds.
Location & tenants
- Location reads 73/100 on livability (#296 in IL) — a middle-class / working-renter tenant base. Strengths: commute A+, cost of living A+, housing A+; Watch: crime D+, health & safety D+, amenities F.
- Thornton Fractional Twp Hsd 215 (suburban): math 9% / reading 13% proficiency, ranked #563 of 620 in IL (top 91%) — low school quality limits family demand, transient renter base, plan for 1-2y turnover.
- Zoned schools: Thornton Fractnl So High School (math 11% / reading 14%, grade F, #504 of 693 statewide, top 73%, 1,927 students, 0% FRL).
- Market conditions: 132 active listings in the ZIP; 15 comparable units currently listed for rent nearby; rentals leasing fast (median 11d on market — plan ~1-2 weeks tenant-placement turnaround); solid renter incomes; 6,272 units permitted in Cook County in 2024 (4,658 in 5+ unit buildings).
Forward outlook
- Local home prices are declining (-3.0%/yr); year-one equity from $1k of loan paydown is wiped out by about $5k of value loss. Plan a longer hold.
Negotiation context
- Only 1 days on market — expect competitive offers; lowballing is unlikely to land.
Risks & watch-outs
- Watch-outs: built in 1942 — expect roof / HVAC / electrical / plumbing capex.
Questions for the listing agent
- Built in 1942 — when were the roof, HVAC, electrical panel, plumbing, and water heater last replaced?
- Is there a deadline driving the sale (1031 exchange, divorce, estate, relocation)? That informs how much negotiation room exists.
- Schools are D-rated, which usually means shorter tenancies and higher turnover. Who's the typical renter profile here, and what's been the actual vacancy rate?
- Crime grade is D in this area — have there been break-ins, vandalism, or insurance claims at this property in the last 3 years? What carrier currently insures it and at what premium?
- What's the average days-on-market for RENTAL listings here right now (not sales)? A rising rental-DOM trend means longer vacancies and softer asking-rent achievability than the comps imply.
- What's the recent tenant-quality profile in this submarket — average credit score on applications, eviction rate, late-payment / NSF rate, and stable-employment percentage? A property-management company in the area should have these aggregated.
- How much new for-sale + rental construction is in the pipeline within 1–3 miles? Heavy new supply typically softens prices + rents 12–24 months out; constrained supply supports both.
Investment metrics
- 1% rule
- 1.16% ✓
- Cap rate
- 9.02%
- Cash-on-cash
- 9.73%
- DSCR
- 1.43
- GRM
- 7.2
CMA / ARV
- ARV (on-the-fly)
- $208,510
- Comps found
- 12
Show comp detail 12 sales within ~0.75 mi
| Address | Dist | Beds/Ba | Sqft | Sold | Price | $/sf | Match |
|---|---|---|---|---|---|---|---|
| 2643 Ridge Rd | 0.48mi | 3/2.0 | 1,502 (+4%) | 2mo | $234,000 | $156 | 66 |
| 17913 Oakwood Ave | 0.25mi | 3/1.0 | 1,257 (-13%) | 2mo | $182,000 | $145 | 64 |
| 18240 Wildwood Ave | 0.56mi | 3/2.0 | 1,400 (-3%) | 6mo | $264,000 | $189 | 63 |
| 18028 Burnham Ave | 0.63mi | 3/1.5 | 1,463 (+2%) | 6mo | $239,999 | $164 | 62 |
| 18032 Wildwood Ave | 0.30mi | 3/1.5 | 1,224 (-15%) | 1mo | $170,000 | $139 | 60 |
| 18062 Exchange Ave | 0.33mi | 4/2.0 (+1) | 1,573 (+9%) | 2mo | $197,000 | $125 | 60 |
| 17908 Lorenz Ave | 0.45mi | 3/2.0 | 1,294 (-10%) | 1mo | $225,000 | $174 | 60 |
| 17714 Burnham Ave | 0.58mi | 3/1.5 | 1,303 (-9%) | 1mo | $164,494 | $126 | 57 |
| 2621 Ridge Rd | 0.50mi | 4/2.0 (+1) | 1,323 (-8%) | 2mo | $216,000 | $163 | 55 |
| 3238 178th St | 0.67mi | 3/1.5 | 1,550 (+8%) | 2mo | $200,000 | $129 | 54 |
| 18034 Lorenz Ave | 0.52mi | 4/2.0 (+1) | 1,580 (+10%) | 7mo | $224,000 | $142 | 47 |
| 17925 Walter St | 0.67mi | 3/2.0 | 1,600 (+11%) | 3mo | $181,000 | $113 | 46 |
Match score weights: distance 35% · size 25% · config 20% · recency 20%. Top-matched comps best support the ARV.
Projected returns pro-forma
-3.0% appreciation · 3.0% rent growth · sell at horizon
- IRR
- -1.6%
- Equity multiple
- 0.94×
- Total profit
- $-2,685
- Equity at exit
- $23,111
- IRR
- 8.1%
- Equity multiple
- 1.61×
- Total profit
- $26,622
- Equity at exit
- $13,402
Cash invested: $43,400 (down + closing). Projections, not guarantees.
Landlord ↔ Tenant lean methodology
- Overall (STATE)
- 43 Moderately Tenant-Leaning
- State Illinois
- 43 Moderately Tenant-Leaning · D+7
- County
- — inherits STATE
- City
- — inherits STATE
ZIP-level market 60438
- Active inventory
- 132
- Price-to-rent
- 7.2×
Monthly cashflow live
- Estimated rent
- $1,801 high interval (Pro) →
- Mortgage (P&I)
- −$813
- Tax est. 1.5%
- −$194 /mo · $2,325/yr
- Insurance
- −$65
- HOA
- −$0
- Vacancy / Maint / Mgmt
- −$378
- Net cashflow
- $352
Break-even live
Sensitivity live
| Price | -10% $459 | -5% $405 | +0% $352 | +5% $298 | +10% $245 |
|---|---|---|---|---|---|
| Rent | -10% $209 | -5% $281 | +0% $352 | +5% $423 | +10% $494 |
| Rate | -1.0pp $430 | -0.5pp $391 | base $352 | +0.5pp $312 | +1.0pp $271 |
UW: 25.0% down · 7.5% · 30yr · 1.5% tax · 5.0% vac · 8.0% maint · 8.0% mgmt
Financing live
Cash to close
- Down payment
- $38,750
- Closing costs
- $4,650
- Reserves months
- —
- Total cash needed
- —
Loan-product check · same deal, 3 products live
Conventional
25% down · 7.5% · 30yr
- Down + closing
- —
- Monthly P&I
- —
- Monthly cashflow
- —
- DSCR
- —
- Eligible?
- —
Personal DTI + credit; lowest rate.
DSCR
20% down · 8.5% · 30yr
- Down + closing
- —
- Monthly P&I
- —
- Monthly cashflow
- —
- DSCR
- —
- Eligible?
- —
No personal income docs; deal must DSCR.
Hard money
10% down · 12.0% · 12mo
- Down + closing
- —
- Monthly P&I
- —
- Monthly cashflow
- —
- DSCR
- —
- Eligible?
- —
Short-term bridge; refi at stabilization.
Rent comps 15 comps
| Address | Beds | Baths | Sqft | Rent | $/sqft | DOM | Units | Dist |
|---|---|---|---|---|---|---|---|---|
| 17723 Exchange Ave Unit 17723-1N Lansing, IL | 3.0 | 2.0 | 1100 | $1,800 | $1.64 | 2d | 1 | 0.15mi |
| 3020 178th St Apt C7 Lansing, IL | 2.0 | 1.0 | 900 | $1,550 | $1.72 | 25d | 1 | 0.38mi |
| 3020 178th St Unit C1 Lansing, IL | 2.0 | 1.0 | 900 | $1,550 | $1.72 | 2d | 1 | 0.38mi |
| 3023 Bernice Rd Apt 2S Lansing, IL | 3.0 | 1.0 | 1000 | $1,600 | $1.60 | 2d | 1 | 0.68mi |
| 18343 Oakwood Ave Lansing, IL | 4.0 | 2.0 | 1700 | $2,700 | $1.59 | 2d | 1 | 0.69mi |
| 18361 Glen Oak Ave Unit 1E Lansing, IL | 2.0 | 1.0 | 900 | $1,400 | $1.56 | 25d | 1 | 0.71mi |
| 3069 Bernice Rd Apt 2S Lansing, IL | 3.0 | 1.0 | 950 | $1,535 | $1.62 | 3d | 1 | 0.71mi |
| 3069 Bernice Rd Apt 2N Lansing, IL | 3.0 | 1.0 | 950 | $1,535 | $1.62 | 21d | 1 | 0.71mi |
| 18381 Torrence Ave Lansing, IL | 2.0 | 1.0 | 900 | $1,300 | $1.44 | 25d | 1 | 0.77mi |
| 17640 Rosewood Dr Unit 2A Lansing, IL | 2.0 | 1.0 | 950 | $1,475 | $1.55 | 18d | 1 | 0.87mi |
| 2824 186th St Lansing, IL | 3.0 | 2.0 | 1400 | $2,900 | $2.07 | 11d | 1 | 0.93mi |
| 18550 Torrence Ave #25 Lansing, IL | 2.0 | 1.0 | 1000 | $1,300 | $1.30 | 12d | 1 | 0.98mi |
| 18335 Sherman St Unit 3 Lansing, IL | 3.0 | 1.0 | 1000 | $1,700 | $1.70 | 2d | 1 | 1.18mi |
| 3341 S Schultz Dr Lansing, IL | 4.0 | 2.0 | 1452 | $2,250 | $1.55 | 11d | 1 | 1.21mi |
| 3649 173rd Ct Lansing, IL | 2.0 | 2.0 | 972 | $1,357 | $1.40 | 25d | 1 | 1.39mi |
Listing history 11 events
-
2026-06-18remarks 444-char remark
-
2026-06-18pricestatusdays on market $155,000 Active 1 DOM
-
2026-06-17days on market $174,900 Coming Soon 14 DOM
-
2026-06-16days on market $174,900 Coming Soon 13 DOM
-
2026-06-15days on market $174,900 Coming Soon 12 DOM
-
2026-06-13days on market $174,900 Coming Soon 10 DOM
-
2026-06-09days on market $174,900 Coming Soon 6 DOM
-
2026-06-08days on market $174,900 Coming Soon 5 DOM
-
2026-06-07days on market $174,900 Coming Soon 4 DOM
-
2026-06-04remarks 437-char remark
-
2026-06-04$174,900 Coming Soon 1 DOM
ⓘ Source: listings_history table (triggers on properties + properties_extension) + one-shot
backfill from property_details.listing_events for pre-trigger history.
Nearby sold comps map
Loading sold comps map…
Walkable amenities ~0.75 mi
Loading nearby amenities…
Taxation est. · year 1
- Rental income
- $21,614
- − Mortgage interest
- −$8,682
- − Property taxes
- −$2,325
- − Insurance
- −$775
- − Repairs & maintenance
- −$1,729
- − Management
- −$1,729
- − Depreciation
- −$4,509
- Taxable income
- $1,864
- Est. tax owed @ 24.0%
- −$447
- After-tax cash flow
- $3,774/yr
For passive investors: Depreciation is non-cash, so a rental often shows a tax loss while cash-flowing — sheltering income. Rental losses are passive: they offset passive income freely, and up to $25,000/yr can offset ordinary (W-2) income if you actively participate and your MAGI is under $100k (phasing out to $0 by $150k); unused losses carry forward. On sale, claimed depreciation is recaptured at up to 25%, and gains may owe capital-gains tax (a 1031 exchange can defer both). Figures are a year-1 estimate at your 24.0% rate — not tax advice; consult a CPA.
Schools (NCES district)
- District
- Thornton Fractional Twp Hsd 215
- NCES district ID
- 1738940
- Math proficiency
- 9% ▼ -3.00%
- Reading proficiency
- 13% ▼ -3.00%
- Median HH income
- $48,207
- Composite
- 10.27/100
- National rank
- #9793
- State rank
- #563 of 620 in IL
Livability — Lansing
- Score
- 73/100
- State rank
- #296
- US rank
- #5698
Category grades
Schools grade is shown separately in the Schools card above.
Census & demographics
- Census place
- Lansing, IL
- County
- Cook County · 4,486,803 people
- City population
- 28,806
- Metro
- Chicago-Naperville-Elgin, IL-IN-WI
- Population (ZIP)
- 28,806
- Household income
- $75,681
- Rent vs Own
- Severe rent burden
- 830.0
Population outlook (Cook County) Hauer SSP2
- Today (2025)
- 5,347,519 people
- By 2030
- 5,357,703 · +0.2%
- By 2040
- 5,324,924 · -0.4%
- By 2050
- 5,230,762 · -2.2%
- By 2075
- 4,785,735 · -10.5%
- By 2100
- 4,188,836 · -21.7%
Race, ethnicity, and origin ACS 2023
- Neighborhood character
- Diverse neighborhood (Simpson 0.65)
- Race & ethnicity
- Black 51% White 25% Hispanic / Latino 18% Two or more races 7% Asian 2%
- Hispanic origin (detail)
- Mexican 15%
- Common ancestry
- Romanian 5% Iranian 3% Lithuanian 1%
- Foreign-born
- 10% · Canada
- Languages at home
- 83% English-only · Spanish 12% Vietnamese 1% French/Haitian/Cajun 1%
Political lean MEDSL · Cook
- 2024 margin
- Solid D (+42.0) · D 70.4% · R 28.4% · Other 1.2%
- 2008→2024 swing
- -11.4pp toward R · 2008: 53.4pp · 2024: 42.0pp
- All cycles
- 2024: D+42.0 2020: D+50.3 2016: D+53.0 2012: D+49.4 2008: D+53.4
Not yet ingested
- Civics
- —
Market trends
- HPI YoY
- ▼ -151.65%
- Current HPI
- 210.3398
- Rent YoY
- —
- Metro
- Chicago-Naperville-Elgin, IL-IN-WI
- State GDP YoY
- ▲ 1.59%
- F500 in state
- 60
Industry mix (Fortune 500 HQ in IL)
| Industry | F500 HQs | Revenue |
|---|---|---|
| Insurance | 4 | $201B |
|
||
| Consumer Goods | 4 | $87B |
|
||
| Industrial Machinery | 3 | $64B |
|
||
| Healthcare | 2 | $55B |
|
||
| Retail / Pharmacy | 1 | $148B |
|
||
| Agriculture / Food | 1 | $86B |
|
||
Cash-flow waterfall
monthlySold comps — $/sqft
last 12 mo · ≤1 miLoading sold comps…