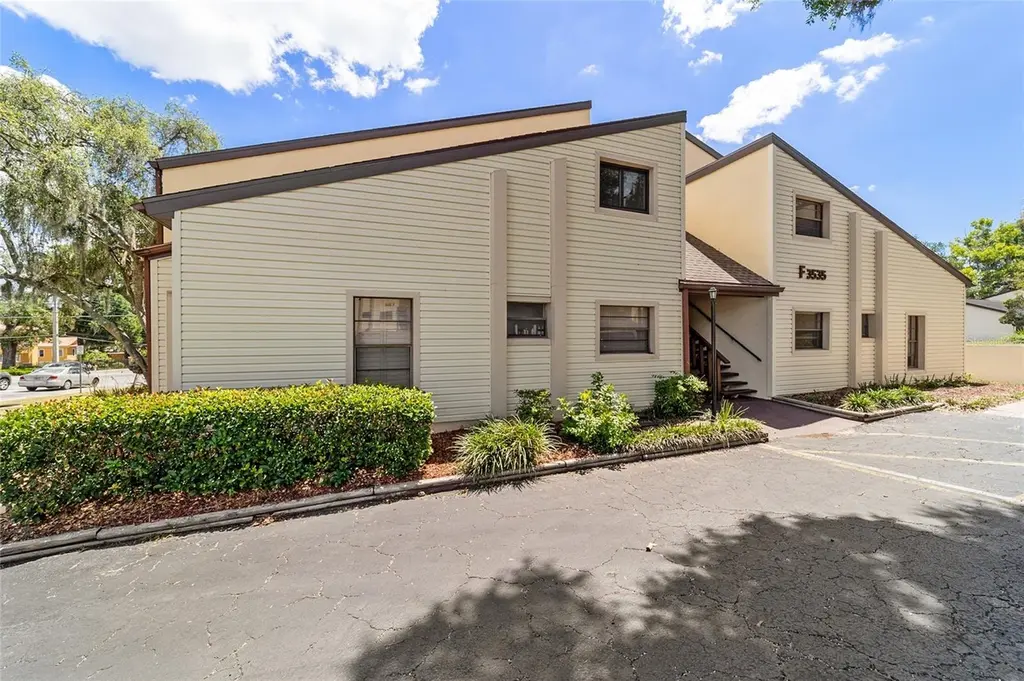
3535 NE Fort King St #261 · Ocala, FL
Flood risk 1/10 · Minimal
- FEMA flood zone
- X (unshaded)
- Chance of flooding over 30 yrs
- 0.0%
- Est. flood insurance / yr
- $507 – $1,088
Fire risk 2/10 · Minimal
- Est. fire insurance / yr
- $947 – $1,759
Heat risk 8/10 · Major
- Hot days now (above 108°F)
- 7 days/yr
- Hot days in 30 yrs
- 21 days/yr
Wind risk 9/10 · Severe
- Chance of severe wind over 30 yrs
- 99.0%
Air-quality risk 4/10 · Minor
- Unhealthy air days now
- 5 days/yr
- Unhealthy air days in 30 yrs
- 5 days/yr
Risk factors via First Street. Map © Google.
Why this score? — see what drove the D grade
The composite is a weighted blend of 9 inputs, each scored 0–100. Each bar is that input's sub-score; the figure is the points it added to the 100-point composite (weight × sub-score).
- Cash flow +14.0/30.0
- ARV discount +7.6/15.0
- 1% rule +4.8/10.0
- DSCR +4.2/10.0
- Schools +3.6/10.0
- Livability +3.5/5.0
- Rent growth +2.5/5.0
- Condition / age +2.5/5.0
- Appreciation +0.0/10.0
$121,000
🖨 Deal sheet (PDF) 📄 Offer letter ✓ Due diligence
Listing remarks
WOW has this condo been updated or what?!? Step in to your new home or income producing property that is ready to go. Beautiful porcelain tile flooring throughout, a completely updated kitchen and bathroom, new doors and trim, 2023 HVAC and updated electrical panel. The enclosed back porch serves as additional space for all seasons with sliders from the living room and bedroom. Tasteful updates in kitchen include quartz countertops, porcelain tile backsplash, custom cabinetry, new appliances, shiplap and beamed ceiling and new window -- SO NICE! The spacious bedroom offers a walk in closet and is convenient to the bath with porcelain tile shower, glass door and new vanity. This unit provide
Key facts
- Custom cabinetry
- Enclosed back porch
- Quartz countertops
Tags
Property features AI
Finance
- Other: No lease restrictions reported; Unfurnished unit
- Financial info: Total annual HOA fees approximately $2,424
- HOA & community: HOA required; monthly fee $202; Association covers pool, structure maintenance, grounds maintenance and trash; Buyer approval required for the association; Community clubhouse and community mailbox; Deed restrictions apply; Pets allowed (max 25 lbs)
Exterior
- Parking: Assigned parking; Guest parking available
- Utilities: Public water; Public sewer; Cable connected; Broadband/high-speed internet available
- Home design: Residential condominium; Corner unit (Building F noted); Faces east; Located on the 2nd floor; Two-story building
- Construction: Block, concrete and stucco construction; Shingle roof; Block foundation; Building identified as 3535/261
- Exterior features: Enclosed rear porch; Porch lighting; Sliding glass doors
Interior
- Kitchen: Dishwasher; Range; Microwave; Refrigerator; Stone counters
- Bedrooms: 1 bedroom
- Flooring: Tile flooring
- Bathrooms: 1 full bathroom
- Heating & cooling: Electric heating; Central air conditioning
- Interior features: Ceiling fans; Living room/dining room combo; Stone counters; Walk-in closet(s); Blinds on windows
- Laundry & utility: Washer and dryer included; Laundry located in an interior laundry closet
Neighborhood map
What this means for you Summary
Snapshot
- This is a 1-bed/1.0-bath condo listed at $121k.
Deal economics
- At list price, monthly cash flow is $15 ($184/yr) — positive.
- The deal already cash-flows at list — no discount required.
- To meet the 1% rule (rent ≥ 1% of price), the offer needs to be $119k (1.6% below list).
- Recommended offer: $117k (3.0% below list) — sets the bar for market timing.
- Cap rate 6.4% vs local median 4.1% in Ocala — top-decile yield for the area; either an underpriced asset or a hidden risk that comps aren't pricing in. Stress-test before assuming the spread holds.
Location & tenants
- Location reads 69/100 on livability (#476 in FL) — a middle-class / working-renter tenant base. Strengths: cost of living A+, housing A+, health & safety A+; Watch: crime F, amenities F, commute F.
- Marion (rural): math 42% / reading 43% proficiency, ranked #61 of 73 in FL (top 84%) — families likely to look elsewhere, expect single-tenant / working-renter base with shorter leases; 61% free/reduced lunch — lower-income household profile, screen leases tightly.
- Zoned schools: Ward-Highlands Elementary School (math 60% / reading 55%, grade C+, #764 of 2,144 statewide, top 36%, 959 students, 59% FRL); Fort King Middle School (math 37% / reading 35%, grade F, #410 of 571 statewide, top 72%, 1,092 students, 71% FRL); Vanguard High School (math 22% / reading 48%, grade F, #379 of 667 statewide, top 58%, 1,661 students, 59% FRL) — zoned schools at 63% FRL track the district average.
- Market conditions: Rents soft (-0.1%/yr); 297 active listings in the ZIP; 13 comparable units currently listed for rent nearby; rentals at typical pace (median 16d on market — plan ~3-4 weeks tenant-placement turnaround); 7,071 units permitted in Marion County in 2024 (534 in 5+ unit buildings).
Forward outlook
- Local home prices are declining (-3.0%/yr); year-one equity from $837 of loan paydown is wiped out by about $4k of value loss. Plan a longer hold.
- Marion County population projected at +13% by 2050 — modest demand growth; plan on rents tracking national, not racing it.
Negotiation context
- It's been on market 44 days — a 3% lower offer ($117k) is reasonable based on typical stale-listing flexibility.
- Current owner paid $82k; 48% above their basis — modest negotiation headroom, anchor on the comps not their cost.
Risks & watch-outs
- Climate carrying-cost: severe wind risk, 99% chance of damaging wind over 30y; extreme-heat days projected 7→21/yr by 2055 (HVAC capex compounding) — expect insurance premiums to compound above CPI over the hold.
Questions for the listing agent
- It's been on market 44 days. Have you received any prior offers? Is the seller open to a 3% concession, seller financing, or rate buy-down credit?
- What does the HOA fee cover, when was the last increase, and are there any pending special assessments or reserve-fund shortfalls?
- Any open or pending special assessments — roof, HVAC, plumbing, elevator, façade? What's the per-unit balance and payoff schedule, and is the seller paying it off at close or rolling it to the buyer?
- Is there a deadline driving the sale (1031 exchange, divorce, estate, relocation)? That informs how much negotiation room exists.
- Crime grade is F in this area — have there been break-ins, vandalism, or insurance claims at this property in the last 3 years? What carrier currently insures it and at what premium?
- The area grade is low — what's the realistic commute time and amenity access for the typical tenant pool here? Any planned neighborhood developments (good or bad) we should know about?
- What's the average days-on-market for RENTAL listings here right now (not sales)? A rising rental-DOM trend means longer vacancies and softer asking-rent achievability than the comps imply.
- What's the recent tenant-quality profile in this submarket — average credit score on applications, eviction rate, late-payment / NSF rate, and stable-employment percentage? A property-management company in the area should have these aggregated.
- How much new apartment / multifamily construction is in the pipeline within 1–3 miles? Heavy new supply (>2% of stock underway) typically softens rents 12–24 months out; light construction supports rent growth.
Investment metrics
- 1% rule
- 0.98% ✗
- Cap rate
- 6.45%
- Cash-on-cash
- 0.54%
- DSCR
- 1.02
- GRM
- 8.5
CMA / ARV
- ARV (median comp)
- $121,170
- List price
- $121,000
- Delta
- -0.14%
- Verdict
- FAIR
- Comps
- 10 within 1.0 mi
Projected returns pro-forma
-3.0% appreciation · 0.0% rent growth · sell at horizon
- IRR
- -19.2%
- Equity multiple
- 0.35×
- Total profit
- $-22,046
- Equity at exit
- $18,041
- IRR
- -20.7%
- Equity multiple
- 0.08×
- Total profit
- $-31,128
- Equity at exit
- $10,462
Cash invested: $33,880 (down + closing). Projections, not guarantees.
Landlord ↔ Tenant lean methodology
- Overall (STATE)
- 87 Strongly Landlord-Friendly
- State Florida
- 87 Strongly Landlord-Friendly · R+3
- County
- — inherits STATE
- City
- — inherits STATE
ZIP-level market 34470
- Home prices YoY
- -27.6%
- Rents YoY
- -0.1%
- Active inventory
- 297
- Price-to-rent
- 8.5×
Monthly cashflow live
- Estimated rent
- $1,191 high interval (Pro) →
- Mortgage (P&I)
- −$635
- Tax from tax record
- −$38 /mo · $459/yr
- Insurance
- −$50
- HOA
- −$202
- Vacancy / Maint / Mgmt
- −$250
- Net cashflow
- $15
Break-even live
Sensitivity live
| Price | -10% $84 | -5% $50 | +0% $15 | +5% $-19 | +10% $-53 |
|---|---|---|---|---|---|
| Rent | -10% $-79 | -5% $-32 | +0% $15 | +5% $62 | +10% $109 |
| Rate | -1.0pp $76 | -0.5pp $46 | base $15 | +0.5pp $-16 | +1.0pp $-48 |
UW: 25.0% down · 7.5% · 30yr · 1.5% tax · 5.0% vac · 8.0% maint · 8.0% mgmt
Financing live
Cash to close
- Down payment
- $30,250
- Closing costs
- $3,630
- Reserves months
- —
- Total cash needed
- —
Loan-product check · same deal, 3 products live
Conventional
25% down · 7.5% · 30yr
- Down + closing
- —
- Monthly P&I
- —
- Monthly cashflow
- —
- DSCR
- —
- Eligible?
- —
Personal DTI + credit; lowest rate.
DSCR
20% down · 8.5% · 30yr
- Down + closing
- —
- Monthly P&I
- —
- Monthly cashflow
- —
- DSCR
- —
- Eligible?
- —
No personal income docs; deal must DSCR.
Hard money
10% down · 12.0% · 12mo
- Down + closing
- —
- Monthly P&I
- —
- Monthly cashflow
- —
- DSCR
- —
- Eligible?
- —
Short-term bridge; refi at stabilization.
Rent comps 13 comps
| Address | Beds | Baths | Sqft | Rent | $/sqft | DOM | Units | Dist |
|---|---|---|---|---|---|---|---|---|
| 720 NE 30th Ave Unit 720-H Ocala, FL | 2.0 | 1.0 | 945 | $1,195 | $1.26 | 23d | 1 | 0.73mi |
| 720 NE 30th Ave Unit 720-U Ocala, FL | 2.0 | 1.0 | 945 | $995 | $1.05 | 23d | 1 | 0.73mi |
| 720 NE 30th Ave Unit 720-P Ocala, FL | 2.0 | 1.0 | 945 | $1,100 | $1.16 | 23d | 1 | 0.73mi |
| 505 NE 28th Ave Unit 505-3 Ocala, FL | 1.0 | 1.0 | 525 | $995 | $1.90 | 23d | 1 | 0.81mi |
| 411 NE 26th Ct Ocala, FL | 2.0 | 1.0 | 1000 | $1,299 | $1.30 | 15d | 1 | 0.89mi |
| 1312 NE 33rd Ave Ocala, FL | 2.0 | 1.0 | 950 | $1,499 | $1.58 | 15d | 1 | 0.93mi |
| 2701 NE 7th St Ocala, FL | 1.0–3.0 | 1.0–2.0 | 998 | $1,299 | $1.30 | 15d | 16 | 0.96mi |
| 1529 NE 39th Ave Ocala, FL | 1.0–2.0 | 1.0 | 720 | $1,060 | $1.47 | 15d | 12 | 1.10mi |
| 2281 NE 2nd St Ocala, FL | 2.0 | 2.0 | 1000 | $1,499 | $1.50 | 23d | 1 | 1.18mi |
| 2321 NE 3rd St Ocala, FL | 1.0–3.0 | 1.0–2.0 | 1010 | $497 | $0.49 | 15d | 1 | 1.18mi |
| 1725 NE 36th Ave Ocala, FL | 2.0–3.0 | 1.0–2.0 | 1186 | $1,350 | $1.14 | 15d | 5 | 1.29mi |
| 2152 NE 3rd St Ocala, FL | 2.0 | 1.0 | 750 | $1,200 | $1.60 | 15d | 1 | 1.30mi |
| 2014 NE 3rd St Ocala, FL | 2.0 | 1.0 | 800 | $1,050 | $1.31 | 15d | 1 | 1.48mi |
HOA detail condo
- Monthly dues
- $202 · $2,424/yr
- Likely covers
- electric
- Assessments
- None detected in remarks — confirm with the listing agent.
Listing history 18 events
-
2026-06-21days on market $121,000 Active 44 DOM
-
2026-06-18days on market $121,000 Active 41 DOM
-
2026-06-17days on market $121,000 Active 40 DOM
-
2026-06-16days on market $121,000 Active 39 DOM
-
2026-06-15days on market $121,000 Active 38 DOM
-
2026-06-14days on market $121,000 Active 36 DOM
-
2026-06-13days on market $121,000 Active 35 DOM
-
2026-06-10days on market $121,000 Active 33 DOM
-
2026-06-09days on market $121,000 Active 32 DOM
-
2026-06-08days on market $121,000 Active 31 DOM
-
2026-06-07days on market $121,000 Active 30 DOM
-
2026-06-03days on market $121,000 Active 26 DOM
-
2026-06-02days on market $121,000 Active 25 DOM
-
2026-06-01pricedays on market $121,000 Active 24 DOM
-
2026-05-31days on market $125,000 Active 23 DOM
-
2026-05-30days on market $125,000 Active 22 DOM
-
2026-05-08$125,000 Active 974-char remark
-
2007-08-02soldstatus $82,000
ⓘ Source: listings_history table (triggers on properties + properties_extension) + one-shot
backfill from property_details.listing_events for pre-trigger history.
Tax reassessment forecast FL · Resets to sale price
- Current annual tax
- $459 · $38/mo
- Projected year-2 tax
- $1,004 · $84/mo
- Expected delta
- +$546/yr (+$45/mo · 118.9%)
ⓘ Screening estimate from a state-policy table — verify with the county assessor before closing.
Climate risk First Street
- Flood 1/10 Low FEMA zone X (unshaded) · 0% chance over 30 yrs
- Wildfire 2/10 Low
- Heat 8/10 Severe 7 d/yr ≥108°F today · 21 d/yr by 30 yrs out
- Wind 9/10 Extreme 99% chance of damaging wind over 30 yrs
- Air quality 4/10 Moderate 5 unhealthy d/yr today · 5 by 30 yrs out
Nearby sold comps map
Loading sold comps map…
Walkable amenities ~0.75 mi
Loading nearby amenities…
Taxation est. · year 1
- Rental income
- $14,286
- − Mortgage interest
- −$6,778
- − Property taxes
- −$459
- − Insurance
- −$605
- − Repairs & maintenance
- −$1,143
- − Management
- −$1,143
- − HOA
- −$2,424
- − Depreciation
- −$3,520
- Taxable loss
- −$1,785
- Est. tax savings @ 24.0%
- +$428
- After-tax cash flow
- $613/yr
For passive investors: Depreciation is non-cash, so a rental often shows a tax loss while cash-flowing — sheltering income. Rental losses are passive: they offset passive income freely, and up to $25,000/yr can offset ordinary (W-2) income if you actively participate and your MAGI is under $100k (phasing out to $0 by $150k); unused losses carry forward. On sale, claimed depreciation is recaptured at up to 25%, and gains may owe capital-gains tax (a 1031 exchange can defer both). Figures are a year-1 estimate at your 24.0% rate — not tax advice; consult a CPA.
Schools (NCES district)
- District
- Marion
- NCES district ID
- 1201260
- Math proficiency
- 42% ▼ -7.00%
- Reading proficiency
- 43% ▼ -4.00%
- Median HH income
- $40,015
- Composite
- 35.61/100
- National rank
- #4890
- State rank
- #61 of 73 in FL
Livability — Ocala
- Score
- 69/100
- State rank
- #476
- US rank
- #8461
Category grades
Schools grade is shown separately in the Schools card above.
Census & demographics
- Census place
- Ocala, FL
- County
- Marion County · 315,796 people
- Metro
- Ocala, FL
- Population (ZIP)
- 22,443
- Household income
- $52,083
- Rent vs Own
- Severe rent burden
- 771.0
Population outlook (Marion County) Hauer SSP2
- Today (2025)
- 365,905 people
- By 2030
- 376,768 · +3.0%
- By 2040
- 396,555 · +8.4%
- By 2050
- 412,723 · +12.8%
- By 2075
- 446,090 · +21.9%
- By 2100
- 436,193 · +19.2%
Race, ethnicity, and origin ACS 2023
- Neighborhood character
- Predominantly White (71%)
- Race & ethnicity
- White 71% Two or more races 12% Hispanic / Latino 12% Black 10% Asian 1%
- Hispanic origin (detail)
- Mexican 2% Puerto Rican 6% Cuban 1%
- Common ancestry
- Lithuanian 3% Romanian 2% Italian 2%
- Foreign-born
- 6% · Canada, Jamaica, Vietnam
- Languages at home
- 89% English-only · Spanish 9%
Political lean MEDSL · Marion
- 2024 margin
- Solid R (+31.6) · D 33.8% · R 65.5%
- 2008→2024 swing
- -20.0pp toward R · 2008: -11.6pp · 2024: -31.6pp
- All cycles
- 2024: R+31.6 2020: R+25.9 2016: R+26.2 2012: R+16.2 2008: R+11.6
Not yet ingested
- Civics
- —
Market trends
- HPI YoY
- ▼ -92.74%
- Current HPI
- 242.686
- Rent YoY
- ▼ -0.07%
- Metro
- Ocala, FL
- State GDP YoY
- ▲ 3.28%
- F500 in state
- 36
Industry mix (Fortune 500 HQ in FL)
| Industry | F500 HQs | Revenue |
|---|---|---|
| Industrial Technology | 2 | $29B |
|
||
| Insurance | 2 | $17B |
|
||
| Retail | 1 | $60B |
|
||
| Technology Distribution | 1 | $58B |
|
||
| Homebuilding | 1 | $35B |
|
||
| Technology Manufacturing | 1 | $35B |
|
||
Price history
+47.6% since first listed3 events — show timeline
- 2026-06-01 Price Changed $121,000 Stellar MLS as Distributed by MLS Grid
- 2026-05-08 Listed $125,000 Stellar MLS as Distributed by MLS Grid
- 2007-08-02 Sold (Public Records) $82,000 Public Records
Property tax history
+16.3%/yrLatest (2025): $459 · +3.4% YoY. Source: county tax records.
Cash-flow waterfall
monthlySold comps — $/sqft
last 12 mo · ≤1 miLoading sold comps…