213 N 1st St · Thornton, IA
Flood risk 7/10 · Major
- FEMA flood zone
- X (unshaded)
- Chance of flooding over 30 yrs
- 0.99%
- Est. flood insurance / yr
- $473 – $860
Fire risk 2/10 · Minimal
- Est. fire insurance / yr
- $902 – $1,676
Heat risk 2/10 · Minimal
- Hot days now (above 99°F)
- 7 days/yr
- Hot days in 30 yrs
- 16 days/yr
Wind risk 2/10 · Minimal
- Chance of severe wind over 30 yrs
- —
Air-quality risk 1/10 · Minimal
- Unhealthy air days now
- 0 days/yr
- Unhealthy air days in 30 yrs
- 0 days/yr
Risk factors via First Street. Map © Google.
Why this score? — see what drove the B grade
The composite is a weighted blend of 9 inputs, each scored 0–100. Each bar is that input's sub-score; the figure is the points it added to the 100-point composite (weight × sub-score).
- Cash flow +28.6/30.0
- DSCR +10.0/10.0
- 1% rule +7.5/10.0
- ARV discount +7.5/15.0
- Appreciation +6.1/10.0
- Schools +5.2/10.0
- Livability +3.4/5.0
- Rent growth +2.5/5.0
- Condition / age +2.5/5.0
$68,500
🖨 Deal sheet (PDF) 📄 Offer letter ✓ Due diligence
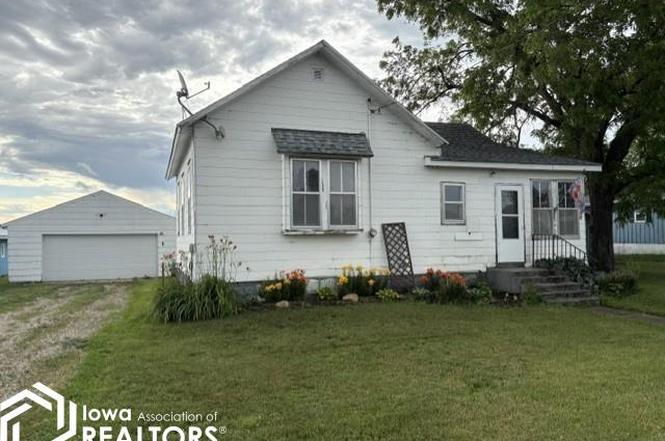
Listing remarks
Very affordable house on the Pleasant Valley Golf Court in Thornton. The view from your back deck looks right out at Hole # 4 tee box. The house has a large living room and a large kitchen. The two stall detached garage gives plenty of space to keep the golf cart in the garage along with one vehicle. The house could use some updating, but you won’t find a more affordable house right off the course.
Key facts
- View from back deck
- Large living room
- Large kitchen
Tags
Property features AI
Exterior
- Parking: Detached 2-car garage
- Utilities: Public water; Public sewer
- Home design: Single-family residence; Residential property
- Exterior features: Lot dimensions approximately 71 x 182
Interior
- Bathrooms: 1 full bathroom
- Heating & cooling: Central air conditioning; Forced air heating
- Interior features: Basement present
Neighborhood map
What this means for you Summary
Snapshot
- This is a 2-bed/1.0-bath single-family listed at $68k.
Deal economics
- At list price, monthly cash flow is $170 ($2k/yr) — positive.
- The deal already cash-flows at list — no discount required.
- Meets the 1% rule at list price ($858 rent vs $68k).
Location & tenants
- Location reads 68/100 on livability (#443 in IA) — a middle-class / working-renter tenant base. Strengths: cost of living A+, housing A+; Watch: employment C-, health & safety C-, amenities F.
- West Fork Community School District (rural): math 54% / reading 69% proficiency, ranked #230 of 289 in IA (top 80%) — acceptable for families but not a draw, mixed tenant base, ~2y average lease.
- Zoned schools: West Fork Elementary At Rockwell (math 62% / reading 67%, grade B, #317 of 616 statewide, top 58%, 415 students, 41% FRL); West Fork Middle School (math 42% / reading 67%, grade B-, #204 of 246 statewide, top 83%, 155 students, 36% FRL); West Fork High School (math 52% / reading 72%, grade B-, #242 of 336 statewide, top 76%, 206 students, 39% FRL).
- Market conditions: 4 active listings in the ZIP; 54 units permitted in Cerro Gordo County in 2024 (6 in 5+ unit buildings).
Forward outlook
- In year one you build about $2k of equity ($474 loan paydown + $2k appreciation (2.2% local appreciation)).
- Cerro Gordo County population projected at -18% by 2050 — secular population decline; favor cash flow + early exit over multi-decade hold.
- At projected returns (2.2% appreciation + 3.0% rent growth), your $19k cash investment doubles in ~5 years — after that, you're playing with house money.
Negotiation context
- Only 4 days on market — expect competitive offers; lowballing is unlikely to land.
- Current owner paid $40k; list at $68k implies a 71% gain — meaningful room to come down on a strong offer.
Risks & watch-outs
- Watch-outs: flood insurance adds $56/mo; built in 1900 — expect roof / HVAC / electrical / plumbing capex.
- Climate carrying-cost: major flood risk — expect insurance premiums to compound above CPI over the hold.
Questions for the listing agent
- Built in 1900 — when were the roof, HVAC, electrical panel, plumbing, and water heater last replaced?
- What's the actual annual flood-insurance premium (NFIP or private), and is the property in a SFHA with mandatory coverage?
- Is there a deadline driving the sale (1031 exchange, divorce, estate, relocation)? That informs how much negotiation room exists.
- Schools are D-rated, which usually means shorter tenancies and higher turnover. Who's the typical renter profile here, and what's been the actual vacancy rate?
- What's the average days-on-market for RENTAL listings here right now (not sales)? A rising rental-DOM trend means longer vacancies and softer asking-rent achievability than the comps imply.
- What's the recent tenant-quality profile in this submarket — average credit score on applications, eviction rate, late-payment / NSF rate, and stable-employment percentage? A property-management company in the area should have these aggregated.
- How much new for-sale + rental construction is in the pipeline within 1–3 miles? Heavy new supply typically softens prices + rents 12–24 months out; constrained supply supports both.
Investment metrics
- 1% rule
- 1.25% ✓
- Cap rate
- 10.25%
- Cash-on-cash
- 14.13%
- DSCR
- 1.63
- GRM
- 6.7
CMA / ARV
No comps found within radius.
Projected returns pro-forma
2.22% appreciation · 3.0% rent growth · sell at horizon
- IRR
- 15.6%
- Equity multiple
- 1.85×
- Total profit
- $16,355
- Equity at exit
- $27,846
- IRR
- 17.9%
- Equity multiple
- 3.43×
- Total profit
- $46,645
- Equity at exit
- $40,745
Cash invested: $19,180 (down + closing). Projections, not guarantees.
Landlord ↔ Tenant lean methodology
- Overall (STATE)
- 83 Strongly Landlord-Friendly
- State Iowa
- 83 Strongly Landlord-Friendly · R+6
- County
- — inherits STATE
- City
- — inherits STATE
ZIP-level market 50479
- Home prices YoY
- 1.3%
- Active inventory
- 4
- Price-to-rent
- 6.7×
Monthly cashflow live
- Estimated rent
- $858 medium interval (Pro) →
- Mortgage (P&I)
- −$359
- Tax from tax record
- −$64 /mo · $774/yr
- Insurance
- −$29
- Flood insurance flood zone
- −$56 /mo · $666/yr
- HOA
- −$0
- Vacancy / Maint / Mgmt
- −$180
- Net cashflow
- $170
Break-even live
Sensitivity live
| Price | -10% $209 | -5% $190 | +0% $170 | +5% $151 | +10% $132 |
|---|---|---|---|---|---|
| Rent | -10% $102 | -5% $136 | +0% $170 | +5% $204 | +10% $238 |
| Rate | -1.0pp $205 | -0.5pp $188 | base $170 | +0.5pp $153 | +1.0pp $134 |
UW: 25.0% down · 7.5% · 30yr · 1.5% tax · 5.0% vac · 8.0% maint · 8.0% mgmt
Financing live
Cash to close
- Down payment
- $17,125
- Closing costs
- $2,055
- Reserves months
- —
- Total cash needed
- —
Loan-product check · same deal, 3 products live
Conventional
25% down · 7.5% · 30yr
- Down + closing
- —
- Monthly P&I
- —
- Monthly cashflow
- —
- DSCR
- —
- Eligible?
- —
Personal DTI + credit; lowest rate.
DSCR
20% down · 8.5% · 30yr
- Down + closing
- —
- Monthly P&I
- —
- Monthly cashflow
- —
- DSCR
- —
- Eligible?
- —
No personal income docs; deal must DSCR.
Hard money
10% down · 12.0% · 12mo
- Down + closing
- —
- Monthly P&I
- —
- Monthly cashflow
- —
- DSCR
- —
- Eligible?
- —
Short-term bridge; refi at stabilization.
Listing history 4 events
-
2026-06-21days on market $68,500 Active 4 DOM
-
2026-06-21days on market $68,500 Active 3 DOM
-
2026-06-17remarks 401-char remark
-
2026-06-17$68,500 Active 1 DOM
ⓘ Source: listings_history table (triggers on properties + properties_extension) + one-shot
backfill from property_details.listing_events for pre-trigger history.
Tax reassessment forecast IA · Partial reset (capped growth)
- Current annual tax
- $774 · $64/mo
- Projected year-2 tax
- $925 · $77/mo
- Expected delta
- +$151/yr (+$13/mo · 19.5%)
ⓘ Screening estimate from a state-policy table — verify with the county assessor before closing.
Climate risk First Street
- Flood 7/10 Severe FEMA zone X (unshaded) · 99% chance over 30 yrs
- Wildfire 2/10 Low
- Heat 2/10 Low 7 d/yr ≥99°F today · 16 d/yr by 30 yrs out
- Wind 2/10 Low
- Air quality 1/10 Low 0 unhealthy d/yr today · 0 by 30 yrs out
Nearby sold comps map
Loading sold comps map…
Walkable amenities ~0.75 mi
Loading nearby amenities…
Taxation est. · year 1
- Rental income
- $10,300
- − Mortgage interest
- −$3,837
- − Property taxes
- −$774
- − Insurance
- −$1,009
- − Repairs & maintenance
- −$824
- − Management
- −$824
- − Depreciation
- −$1,993
- Taxable income
- $1,039
- Est. tax owed @ 24.0%
- −$249
- After-tax cash flow
- $1,794/yr
For passive investors: Depreciation is non-cash, so a rental often shows a tax loss while cash-flowing — sheltering income. Rental losses are passive: they offset passive income freely, and up to $25,000/yr can offset ordinary (W-2) income if you actively participate and your MAGI is under $100k (phasing out to $0 by $150k); unused losses carry forward. On sale, claimed depreciation is recaptured at up to 25%, and gains may owe capital-gains tax (a 1031 exchange can defer both). Figures are a year-1 estimate at your 24.0% rate — not tax advice; consult a CPA.
Schools (NCES district)
- District
- West Fork Community School District
- NCES district ID
- 1925920
- Math proficiency
- 54% ▼ -8.00%
- Reading proficiency
- 69% ▼ -4.00%
- Median HH income
- $50,147
- Composite
- 52.28/100
- National rank
- #1596
- State rank
- #230 of 289 in IA
Livability — Thornton
- Score
- 68/100
- State rank
- #443
- US rank
- #9702
Category grades
Schools grade is shown separately in the Schools card above.
Census & demographics
- Census place
- Thornton, IA
- Population (ZIP)
- 783
Population outlook (Cerro Gordo County) Hauer SSP2
- Today (2025)
- 41,080 people
- By 2030
- 39,746 · -3.2%
- By 2040
- 36,608 · -10.9%
- By 2050
- 33,682 · -18.0%
- By 2075
- 29,702 · -27.7%
- By 2100
- 27,399 · -33.3%
Race, ethnicity, and origin ACS 2023
- Neighborhood character
- Predominantly White (93%)
- Race & ethnicity
- White 93% Hispanic / Latino 5% Two or more races 3%
- Hispanic origin (detail)
- Mexican 3% Puerto Rican 1%
- Common ancestry
- Portuguese 11% Iranian 2% Slovak 1%
- Foreign-born
- 0%
- Languages at home
- 99% English-only · Spanish 1%
Political lean MEDSL · Cerro Gordo
- 2024 margin
- R (+11.7) · D 43.4% · R 55.0% · Other 1.6%
- 2008→2024 swing
- -32.5pp toward R · 2008: 20.8pp · 2024: -11.7pp
- All cycles
- 2024: R+11.7 2020: R+6.3 2016: R+7.7 2012: D+13.2 2008: D+20.8
Not yet ingested
- Civics
- —
Market trends
- HPI YoY
- ▲ 2.22%
- Current HPI
- 170.3808
- Rent YoY
- —
- Metro
- —
- State GDP YoY
- ▲ 2.48%
- F500 in state
- 4
Industry mix (Fortune 500 HQ in IA)
| Industry | F500 HQs | Revenue |
|---|---|---|
| Financial Services | 1 | $16B |
|
||
| Retail / Convenience | 1 | $15B |
|
||
Price history
+71.2% since first listed2 events — show timeline
- 2026-06-17 Listed $68,500 IAR
- 2019-01-07 Sold (Public Records) $40,000 Public Records
Property tax history
+3.2%/yrLatest (2025): $774 · +4.9% YoY. Source: county tax records.
Cash-flow waterfall
monthlySold comps — $/sqft
last 12 mo · ≤1 miLoading sold comps…