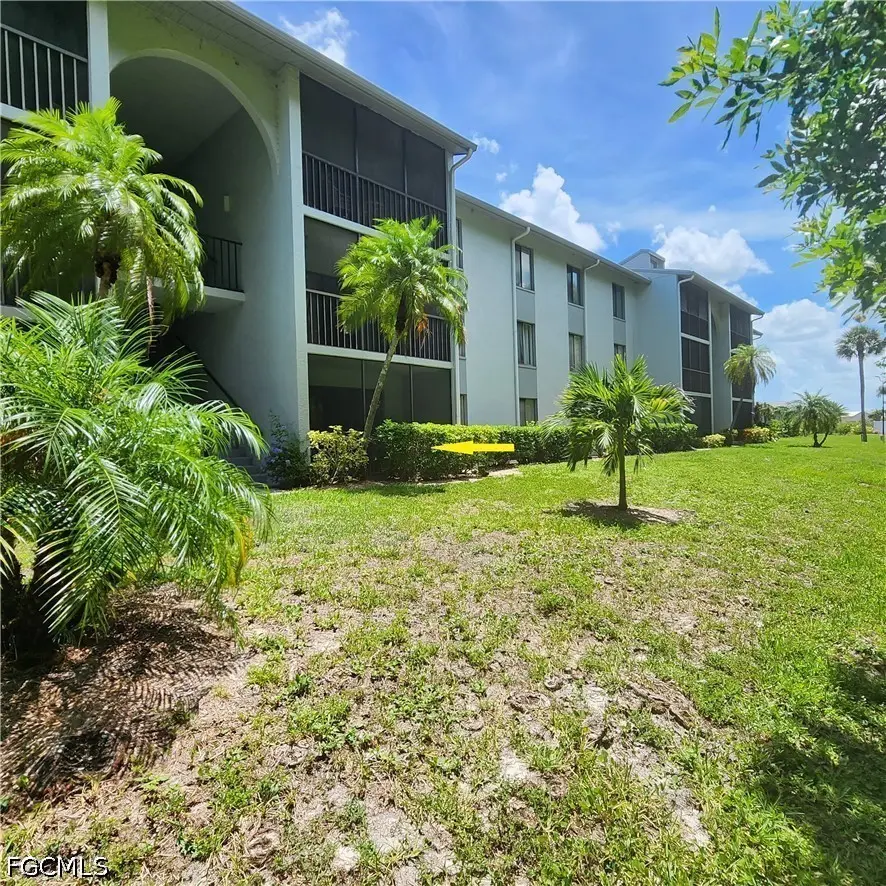
9650 Green Cypress Ln Unit 7-G1 · Buckingham, FL
Flood risk 1/10 · Minimal
- FEMA flood zone
- X (unshaded)
- Chance of flooding over 30 yrs
- 0.0%
- Est. flood insurance / yr
- $507 – $1,088
Fire risk 4/10 · Minor
- Est. fire insurance / yr
- $947 – $1,759
Heat risk 10/10 · Severe
- Hot days now (above 107°F)
- 7 days/yr
- Hot days in 30 yrs
- 30 days/yr
Wind risk 10/10 · Severe
- Chance of severe wind over 30 yrs
- 99.0%
Air-quality risk 2/10 · Minimal
- Unhealthy air days now
- 1 days/yr
- Unhealthy air days in 30 yrs
- 1 days/yr
Risk factors via First Street. Map © Google.
Why this score? — see what drove the C+ grade
The composite is a weighted blend of 9 inputs, each scored 0–100. Each bar is that input's sub-score; the figure is the points it added to the 100-point composite (weight × sub-score).
- Cash flow +26.4/30.0
- 1% rule +10.0/10.0
- DSCR +9.0/10.0
- ARV discount +7.5/15.0
- Schools +4.1/10.0
- Livability +3.5/5.0
- Condition / age +2.2/5.0
- Rent growth +1.8/5.0
- Appreciation +0.0/10.0
$105,000
🖨 Deal sheet 📄 Offer letter ✓ Due diligence
Listing remarks
1st Floor Condo - No Stairs! * Private Woods View From Entire Condo * Sold Fully Furnished As Seen! * Estate Sale-Orig Owner, Never Rented * Priced For Fast Sale - Under $105K - Wow! * Dated, But Very Neat/Clean & Move-In Ready! * Circuit Breaker Box Will Be Replaced Soon! * Snowbird Or Rental Ready! * Carpet & Vinyl Flooring * Inside Laundry * Screen Porch Facing The Woods - Beautiful Private Woods View! * Extra Storage Closet In Hallway * Walking Distance To Clubhouse & Pool * 1st Floor Is Great For Pets Too - Very Pet Friendly Community w/ Separate Fenced Dog Park For Small Or Shy Dogs * Pine Ridge Is A Very Well Maintained Gated 55+ Communit
Key facts
- Gated 55 community
- Private woods view
- Extra storage closet
Tags
Property features AI
Finance
- Other: Community of 462 units; Gated community with street lights; Senior community
- Financial info: Pets allowed conditionally — maximum 1 pet up to 25 lbs
- HOA & community: Quarterly association fee; Association fee includes management, cable TV, insurance, internet, irrigation water, legal/accounting, grounds maintenance, pest control, recreation facilities, reserve fund, road maintenance, sewer, street lights, security, trash and water; Community amenities include clubhouse, pool, spa/hot tub, bocce court, pickleball, tennis courts, shuffleboard, sidewalks, trails, bike storage, dog park, library, barbecue/picnic area, vehicle wash area
Exterior
- Parking: Assigned parking (one space)
- Security: Security gate; Gated community; Key card entry; Smoke detectors
- Utilities: Public water; Public sewer; Cable available; High speed internet available; Underground utilities
- Home design: One-story building; Entry level 1; Northeast facing; Resale property
- Construction: Block, concrete and stucco construction; Shingle roof; On-site management
- Exterior features: Sprinkler/irrigation (automatic); Balcony; Screened patio/porch; Community pool; Reclaimed water irrigation; Private paved road (privately maintained); Southwest exposure; Has view
Interior
- Kitchen: Dishwasher; Freezer; Disposal; Microwave; Range; Refrigerator
- Bedrooms: Great Room
- Flooring: Carpet; Vinyl
- Bathrooms: 2 full bathrooms; Separate shower; Shower only
- Heating & cooling: Central heating (electric); Central air conditioning (electric); Humidity control
- Interior features: Furnished; Living/Dining room; Walk-in closet(s); Cable TV; High speed internet; Window treatments; Single hung and sliding windows
- Laundry & utility: Washer hookup; Dryer hookup; Inside laundry; Washer; Dryer
Neighborhood map
What this means for you Summary
Snapshot
- This is a 2-bed/2.0-bath condo listed at $105k. Condition is rated fair.
Deal economics
- At list price, monthly cash flow is $274 ($3k/yr) — positive.
- The deal already cash-flows at list — no discount required.
- Meets the 1% rule at list price ($2k rent vs $105k).
- Recommended offer: $103k (1.5% below list) — sets the bar for market timing.
- Cap rate 9.4% vs local median 3.6% in Buckingham — top-decile yield for the area; either an underpriced asset or a hidden risk that comps aren't pricing in. Stress-test before assuming the spread holds.
Location & tenants
- Location reads 70/100 on livability (#413 in FL) — a middle-class / working-renter tenant base. Strengths: crime A+, employment A+, housing A+; Watch: cost of living D+, schools F, amenities F.
- Lee (suburban): math 47% / reading 50% proficiency, ranked #42 of 73 in FL (top 58%) — families likely to look elsewhere, expect single-tenant / working-renter base with shorter leases.
- Market conditions: Rents soft (-3.0%/yr); 763 active listings in the ZIP; 18 comparable units currently listed for rent nearby; rentals at typical pace (median 24d on market — plan ~3-4 weeks tenant-placement turnaround); 15,411 units permitted in Lee County in 2024 (4,686 in 5+ unit buildings).
- This rent runs 31% of the median local income ($72k/yr) — at the standard rent-burdened threshold; future hikes will face affordability resistance.
Forward outlook
- Local home prices are declining (-3.0%/yr); year-one equity from $726 of loan paydown is wiped out by about $3k of value loss. Plan a longer hold.
- Lee County population projected at +44% by 2050 — long-run rental-demand tailwind backs the buy-and-hold thesis.
Negotiation context
- It's been on market 22 days — a 2% lower offer ($103k) is reasonable based on typical stale-listing flexibility.
Risks & watch-outs
- Watch-outs: HOA is 26% of rent.
- Climate carrying-cost: severe wind risk, 99% chance of damaging wind over 30y; extreme-heat days projected 7→30/yr by 2055 (HVAC capex compounding) — expect insurance premiums to compound above CPI over the hold.
Questions for the listing agent
- Have any recent inspections been done? Can we get a copy of the seller's disclosures and any deferred-maintenance estimates?
- What does the HOA fee cover, when was the last increase, and are there any pending special assessments or reserve-fund shortfalls?
- Any open or pending special assessments — roof, HVAC, plumbing, elevator, façade? What's the per-unit balance and payoff schedule, and is the seller paying it off at close or rolling it to the buyer?
- Is there a deadline driving the sale (1031 exchange, divorce, estate, relocation)? That informs how much negotiation room exists.
- Schools are F-rated, which usually means shorter tenancies and higher turnover. Who's the typical renter profile here, and what's been the actual vacancy rate?
- What's the average days-on-market for RENTAL listings here right now (not sales)? A rising rental-DOM trend means longer vacancies and softer asking-rent achievability than the comps imply.
- What's the recent tenant-quality profile in this submarket — average credit score on applications, eviction rate, late-payment / NSF rate, and stable-employment percentage? A property-management company in the area should have these aggregated.
- How much new apartment / multifamily construction is in the pipeline within 1–3 miles? Heavy new supply (>2% of stock underway) typically softens rents 12–24 months out; light construction supports rent growth.
Investment metrics
- 1% rule
- 1.79% ✓
- Cap rate
- 9.43%
- Cash-on-cash
- 11.20%
- DSCR
- 1.50
- GRM
- 4.7
CMA / ARV
No comps found within radius.
Projected returns pro-forma
-3.0% appreciation · 0.0% rent growth · sell at horizon
- IRR
- -4.5%
- Equity multiple
- 0.84×
- Total profit
- $-4,719
- Equity at exit
- $15,656
- IRR
- -1.0%
- Equity multiple
- 0.95×
- Total profit
- $-1,560
- Equity at exit
- $9,078
Cash invested: $29,400 (down + closing). Projections, not guarantees.
Landlord ↔ Tenant lean methodology
- Overall (STATE)
- 87 Strongly Landlord-Friendly
- State Florida
- 87 Strongly Landlord-Friendly · R+3
- County
- — inherits STATE
- City
- — inherits STATE
ZIP-level market 33905
- Home prices YoY
- -31.4%
- Rents YoY
- -3.0%
- Active inventory
- 763
- Price-to-rent
- 4.7×
Monthly cashflow live
- Estimated rent
- $1,878 high interval (Pro) →
- Mortgage (P&I)
- −$551
- Tax est. 1.5%
- −$131 /mo · $1,575/yr
- Insurance
- −$44
- HOA
- −$484
- Vacancy / Maint / Mgmt
- −$394
- Net cashflow
- $274
Break-even live
UW: 25.0% down · 7.5% · 30yr · 1.5% tax · 5.0% vac · 8.0% maint · 8.0% mgmt
Financing live
Cash to close
- Down payment
- $26,250
- Closing costs
- $3,150
- Reserves months
- —
- Total cash needed
- —
Loan-product check · same deal, 3 products live
Conventional
25% down · 7.5% · 30yr
- Down + closing
- —
- Monthly P&I
- —
- Monthly cashflow
- —
- DSCR
- —
- Eligible?
- —
Personal DTI + credit; lowest rate.
DSCR
20% down · 8.5% · 30yr
- Down + closing
- —
- Monthly P&I
- —
- Monthly cashflow
- —
- DSCR
- —
- Eligible?
- —
No personal income docs; deal must DSCR.
Hard money
10% down · 12.0% · 12mo
- Down + closing
- —
- Monthly P&I
- —
- Monthly cashflow
- —
- DSCR
- —
- Eligible?
- —
Short-term bridge; refi at stabilization.
Rent comps 18 comps
| Address | Beds | Baths | Sqft | Rent | $/sqft | DOM | Units | Dist |
|---|---|---|---|---|---|---|---|---|
| 9570 Green Cypress Ln #13 Fort Myers, FL | 2.0 | 2.0 | 985 | $2,800 | $2.84 | 23d | 1 | 0.09mi |
| 9540 Green Cypress Ln #11 Fort Myers, FL | 2.0 | 2.0 | 988 | $2,500 | $2.53 | 23d | 1 | 0.12mi |
| 4681 Lakeside Club Blvd #11 Fort Myers, FL | 2.0 | 2.0 | 964 | $1,300 | $1.35 | 23d | 1 | 0.13mi |
| 9950 Sailview Ct #2 Fort Myers, FL | 2.0 | 2.0 | 964 | $1,500 | $1.56 | 23d | 1 | 0.25mi |
| 9970 Sailview Ct #9 Fort Myers, FL | 2.0 | 2.0 | 988 | $1,100 | $1.11 | 3d | 1 | 0.28mi |
| 9970 Sailview Ct #9 Fort Myers, FL | 2.0 | 2.0 | 988 | $1,150 | $1.16 | 23d | 1 | 0.28mi |
| 434 Buena Vista Blvd Fort Myers, FL | 3.0 | 2.0 | 1186 | $1,850 | $1.56 | 23d | 1 | 0.86mi |
| 141 Schneider Dr Fort Myers, FL | 3.0 | 2.0 | 1048 | $2,500 | $2.39 | 23d | 1 | 1.01mi |
| 4900 Tice St Unit 5 Fort Myers, FL | 2.0 | 1.0 | 700 | $800 | $1.14 | 23d | 1 | 1.02mi |
| 320 Morse Plz Fort Myers, FL | 3.0 | 2.0 | 1196 | $2,000 | $1.67 | 23d | 1 | 1.04mi |
| 328 Bellair Rd Fort Myers, FL | 2.0 | 1.0 | 900 | $1,500 | $1.67 | 23d | 1 | 1.11mi |
| 215 Delray Ave Fort Myers, FL | 2.0 | 1.0 | 740 | $1,450 | $1.96 | 14d | 1 | 1.19mi |
| 4724 Tice St Fort Myers, FL | 2.0 | 1.0 | 890 | $1,100 | $1.24 | 15d | 1 | 1.26mi |
| 326 Chattanooga Dr Fort Myers, FL | 2.0 | 1.0 | 895 | $1,475 | $1.65 | 21d | 1 | 1.29mi |
| 243 Tangerine Dr Fort Myers, FL | 2.0 | 1.5 | 720 | $1,425 | $1.98 | 23d | 1 | 1.30mi |
| 464 Carolina Ave Unit A Fort Myers, FL | 2.0 | 1.0 | 714 | $1,150 | $1.61 | 3d | 1 | 1.32mi |
| 464 Carolina Ave Fort Myers, FL | 2.0 | 1.0 | 750 | $975 | $1.30 | 19d | 1 | 1.32mi |
| 580 Thomas Ave Fort Myers, FL | 2.0 | 1.0 | 900 | $1,200 | $1.33 | 23d | 1 | 1.37mi |
HOA detail condo
- Monthly dues
- $484 · $5,808/yr
- Likely covers
- poolsecurity
- Assessments
- None detected in remarks — confirm with the listing agent.
Listing history 13 events
-
2026-06-18statusdays on market $105,000 Pending 22 DOM
-
2026-06-17days on market $105,000 Active 21 DOM
-
2026-06-16days on market $105,000 Active 20 DOM
-
2026-06-15days on market $105,000 Active 19 DOM
-
2026-06-13days on market $105,000 Active 17 DOM
-
2026-06-10days on market $105,000 Active 14 DOM
-
2026-06-09days on market $105,000 Active 13 DOM
-
2026-06-08days on market $105,000 Active 12 DOM
-
2026-06-07days on market $105,000 Active 11 DOM
-
2026-06-03days on market $105,000 Active 7 DOM
-
2026-06-02days on market $105,000 Active 6 DOM
-
2026-06-01days on market $105,000 Active 5 DOM
-
2026-05-31days on market $105,000 Active 4 DOM
ⓘ Source: listings_history table (triggers on properties + properties_extension) + one-shot
backfill from property_details.listing_events for pre-trigger history.
Climate risk First Street
- Flood 1/10 Low FEMA zone X (unshaded) · 0% chance over 30 yrs
- Wildfire 4/10 Moderate
- Heat 10/10 Extreme 7 d/yr ≥107°F today · 30 d/yr by 30 yrs out
- Wind 10/10 Extreme 99% chance of damaging wind over 30 yrs
- Air quality 2/10 Low 1 unhealthy d/yr today · 1 by 30 yrs out
Nearby sold comps map
Loading sold comps map…
Walkable amenities ~0.75 mi
Loading nearby amenities…
Taxation est. · year 1
- Rental income
- $22,542
- − Mortgage interest
- −$5,882
- − Property taxes
- −$1,575
- − Insurance
- −$525
- − Repairs & maintenance
- −$1,803
- − Management
- −$1,803
- − HOA
- −$5,808
- − Depreciation
- −$3,055
- Taxable income
- $2,091
- Est. tax owed @ 24.0%
- −$502
- After-tax cash flow
- $2,791/yr
For passive investors: Depreciation is non-cash, so a rental often shows a tax loss while cash-flowing — sheltering income. Rental losses are passive: they offset passive income freely, and up to $25,000/yr can offset ordinary (W-2) income if you actively participate and your MAGI is under $100k (phasing out to $0 by $150k); unused losses carry forward. On sale, claimed depreciation is recaptured at up to 25%, and gains may owe capital-gains tax (a 1031 exchange can defer both). Figures are a year-1 estimate at your 24.0% rate — not tax advice; consult a CPA.
Condition & rehab AI · 12 photos
This 1st floor condo is in fair condition with cosmetic updates needed. Painting and landscaping can significantly improve its value.
Repairs flagged
- Minor Circuit breaker box — Owner will replace soon.
- Minor Landscaping — Some overgrown areas need trimming.
Value-add opportunities
- Both Painting — Fresh paint can improve curb appeal and interior aesthetics.
- Both Landscaping — Well-maintained landscaping can enhance curb appeal and attract potential buyers/tenants.
Renovation cost estimate screening
| Repair item | Severity | Est. cost |
|---|---|---|
| Circuit breaker box · Owner will replace soon. | Minor | $500–3,000 |
| Landscaping · Some overgrown areas need trimming. | Minor | $500–3,000 |
| Total estimated repair cost · 2 items | $1,000–6,000 |
Value-add ROI direction
- Both Painting — Fresh paint can improve curb appeal and interior aesthetics. ↑
- Both Landscaping — Well-maintained landscaping can enhance curb appeal and attract potential buyers/tenants. ↑
ⓘ Cost ranges are severity-bucket heuristics (US national rule-of-thumb). Get contractor quotes + a written scope before underwriting a rehab budget.
Schools (NCES district)
- District
- Lee
- NCES district ID
- 1201080
- Math proficiency
- 47% ▼ -11.00%
- Reading proficiency
- 50% ▼ -4.00%
- Median HH income
- $49,518
- Composite
- 41.49/100
- National rank
- #3458
- State rank
- #42 of 73 in FL
Livability — Buckingham
- Score
- 70/100
- State rank
- #413
- US rank
- #7367
Category grades
Schools grade is shown separately in the Schools card above.
Census & demographics
- County
- Lee County · 788,662 people
- City population
- 40,908
- Metro
- Cape Coral-Fort Myers, FL
- Population (ZIP)
- 41,381
- Household income
- $71,987
- Rent vs Own
- Severe rent burden
- 1358.0
Population outlook (Lee County) Hauer SSP2
- Today (2025)
- 871,946 people
- By 2030
- 955,468 · +9.6%
- By 2040
- 1,113,587 · +27.7%
- By 2050
- 1,256,891 · +44.1%
- By 2075
- 1,560,270 · +78.9%
- By 2100
- 1,726,848 · +98.0%
Race, ethnicity, and origin ACS 2023
- Neighborhood character
- Diverse neighborhood (Simpson 0.59)
- Race & ethnicity
- White 53% Hispanic / Latino 34% Two or more races 17% Black 9% Native American 4% Asian 2%
- Hispanic origin (detail)
- Mexican 11% Puerto Rican 5% Cuban 2%
- Common ancestry
- Romanian 2% Slovak 2% Lithuanian 2%
- Foreign-born
- 20% · Canada, Jamaica
- Languages at home
- 68% English-only · Spanish 29% Other Indo-European 1% German/W. Germanic 1%
Political lean MEDSL · Lee
- 2024 margin
- Strong R (+28.4) · D 35.5% · R 63.9%
- 2008→2024 swing
- -18.0pp toward R · 2008: -10.4pp · 2024: -28.4pp
- All cycles
- 2024: R+28.4 2020: R+19.2 2016: R+20.4 2012: R+16.6 2008: R+10.4
Not yet ingested
- Civics
- —
Market trends
- HPI YoY
- ▼ -122.89%
- Current HPI
- 268.4598
- Rent YoY
- ▼ -2.97%
- Metro
- Cape Coral-Fort Myers, FL
- State GDP YoY
- ▲ 3.28%
- F500 in state
- 36
Industry mix (Fortune 500 HQ in FL)
| Industry | F500 HQs | Revenue |
|---|---|---|
| Industrial Technology | 2 | $29B |
|
||
| Insurance | 2 | $17B |
|
||
| Retail | 1 | $60B |
|
||
| Technology Distribution | 1 | $58B |
|
||
| Homebuilding | 1 | $35B |
|
||
| Technology Manufacturing | 1 | $35B |
|
||
Price history
1 event — show timeline
- 2026-05-27 Listed $105,000 FORTMLS
Cash-flow waterfall
monthlySold comps — $/sqft
last 12 mo · ≤1 miLoading sold comps…