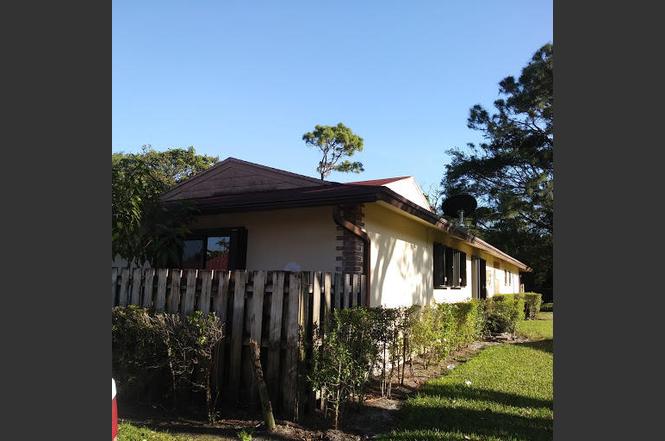
4296 Woodstock Dr Unit A · West Palm Beach, FL
Flood risk 1/10 · Minimal
- FEMA flood zone
- X (unshaded)
- Chance of flooding over 30 yrs
- 0.0%
- Est. flood insurance / yr
- $507 – $1,088
Fire risk 2/10 · Minimal
- Est. fire insurance / yr
- $947 – $1,759
Heat risk 9/10 · Severe
- Hot days now (above 105°F)
- 7 days/yr
- Hot days in 30 yrs
- 24 days/yr
Wind risk 10/10 · Severe
- Chance of severe wind over 30 yrs
- 99.0%
Air-quality risk 2/10 · Minimal
- Unhealthy air days now
- 1 days/yr
- Unhealthy air days in 30 yrs
- 1 days/yr
Risk factors via First Street. Map © Google.
Why this score? — see what drove the C grade
The composite is a weighted blend of 9 inputs, each scored 0–100. Each bar is that input's sub-score; the figure is the points it added to the 100-point composite (weight × sub-score).
- Cash flow +20.6/30.0
- ARV discount +7.5/15.0
- 1% rule +7.0/10.0
- DSCR +6.6/10.0
- Schools +4.3/10.0
- Livability +4.1/5.0
- Rent growth +2.5/5.0
- Condition / age +2.5/5.0
- Appreciation +0.0/10.0
$197,000
🖨 Deal sheet (PDF) 📄 Offer letter ✓ Due diligence
Listing remarks
Create value and equity in this CBS one story 2/2 Town Home. Features include private courtyard, accordion hurricane shutters, high volume ceilings in living, dining, kitchen areas, tile floors throughout, and large primary bedroom.
Key facts
- High volume ceilings
- Tile floors
- Private courtyard
Tags
Neighborhood map
What this means for you Summary
Snapshot
- This is a 2-bed/2.0-bath single-family listed at $197k.
Deal economics
- At list price, monthly cash flow is $265 ($3k/yr) — positive.
- The deal already cash-flows at list — no discount required.
- Meets the 1% rule at list price ($2k rent vs $197k).
- Recommended offer: $194k (1.5% below list) — sets the bar for market timing.
- Cap rate 7.9% vs local median 3.8% in West Palm Beach — top-decile yield for the area; either an underpriced asset or a hidden risk that comps aren't pricing in. Stress-test before assuming the spread holds.
Location & tenants
- Location reads 82/100 on livability (#75 in FL, #1,255 nationally) — a professional / high-income tenant draw. Strengths: commute A+, housing A+, health & safety A+; Watch: employment C-, crime F.
- Palm Beach (suburban): math 46% / reading 53% proficiency, ranked #34 of 73 in FL (top 47%) — families likely to look elsewhere, expect single-tenant / working-renter base with shorter leases.
- Zoned schools: Egret Lake Elementary School (math 32% / reading 37%, grade F, #1,709 of 2,144 statewide, top 81%, 569 students, 80% FRL); Bear Lakes Middle School (math 19% / reading 33%, grade F, #506 of 571 statewide, top 89%, 842 students, 74% FRL); Palm Beach Lakes High School (math 17% / reading 26%, grade F, #546 of 667 statewide, top 82%, 2,688 students, 70% FRL) — zoned schools average 75% FRL vs 52% district-wide (23 pts higher); higher-poverty schools than district average — tighter screening recommended.
- Zoned-school proficiency averages 27% at this address vs 50% district-wide (-22 pts) — the specific schools serving this property underperform the Palm Beach average; the district grade overstates school quality for this exact location.
- Market conditions: Rents soft (-0.1%/yr); 194 active listings in the ZIP; 22 comparable units currently listed for rent nearby; rentals at typical pace (median 26d on market — plan ~3-4 weeks tenant-placement turnaround); 3,974 units permitted in Palm Beach County in 2024 (1,012 in 5+ unit buildings).
- This rent runs 42% of the median local income ($67k/yr) — at the standard rent-burdened threshold; future hikes will face affordability resistance.
Forward outlook
- Local home prices are declining (-3.0%/yr); year-one equity from $1k of loan paydown is wiped out by about $6k of value loss. Plan a longer hold.
- Palm Beach County population projected at +30% by 2050 — long-run rental-demand tailwind backs the buy-and-hold thesis.
Negotiation context
- It's been on market 16 days — a 2% lower offer ($194k) is reasonable based on typical stale-listing flexibility.
- 10 sale attempts since 12y ago with the ask held roughly flat each time — persistent listings suggest the price (not the market) is what's stuck; bring a comps-based counter.
- Current owner paid $160k; 23% above their basis — modest negotiation headroom, anchor on the comps not their cost.
Risks & watch-outs
- Climate carrying-cost: severe wind risk, 99% chance of damaging wind over 30y; extreme-heat days projected 7→24/yr by 2055 (HVAC capex compounding) — expect insurance premiums to compound above CPI over the hold.
Questions for the listing agent
- What does the HOA fee cover, when was the last increase, and are there any pending special assessments or reserve-fund shortfalls?
- Is there a deadline driving the sale (1031 exchange, divorce, estate, relocation)? That informs how much negotiation room exists.
- Crime grade is F in this area — have there been break-ins, vandalism, or insurance claims at this property in the last 3 years? What carrier currently insures it and at what premium?
- What's the average days-on-market for RENTAL listings here right now (not sales)? A rising rental-DOM trend means longer vacancies and softer asking-rent achievability than the comps imply.
- What's the recent tenant-quality profile in this submarket — average credit score on applications, eviction rate, late-payment / NSF rate, and stable-employment percentage? A property-management company in the area should have these aggregated.
- How much new for-sale + rental construction is in the pipeline within 1–3 miles? Heavy new supply typically softens prices + rents 12–24 months out; constrained supply supports both.
Investment metrics
- 1% rule
- 1.20% ✓
- Cap rate
- 7.91%
- Cash-on-cash
- 5.76%
- DSCR
- 1.26
- GRM
- 6.9
CMA / ARV
No comps found within radius.
Projected returns pro-forma
-3.0% appreciation · 0.0% rent growth · sell at horizon
- IRR
- -11.3%
- Equity multiple
- 0.60×
- Total profit
- $-21,792
- Equity at exit
- $29,373
- IRR
- -7.9%
- Equity multiple
- 0.58×
- Total profit
- $-23,264
- Equity at exit
- $17,033
Cash invested: $55,160 (down + closing). Projections, not guarantees.
Landlord ↔ Tenant lean methodology
- Overall (STATE)
- 87 Strongly Landlord-Friendly
- State Florida
- 87 Strongly Landlord-Friendly · R+3
- County
- — inherits STATE
- City
- — inherits STATE
ZIP-level market 33409
- Home prices YoY
- -25.6%
- Rents YoY
- -0.1%
- Active inventory
- 194
- Price-to-rent
- 6.9×
Monthly cashflow live
- Estimated rent
- $2,362 high interval (Pro) →
- Mortgage (P&I)
- −$1,033
- Tax from tax record
- −$171 /mo · $2,053/yr
- Insurance
- −$82
- HOA
- −$315
- Vacancy / Maint / Mgmt
- −$496
- Net cashflow
- $265
Break-even live
Sensitivity live
| Price | -10% $376 | -5% $321 | +0% $265 | +5% $209 | +10% $153 |
|---|---|---|---|---|---|
| Rent | -10% $78 | -5% $172 | +0% $265 | +5% $358 | +10% $451 |
| Rate | -1.0pp $364 | -0.5pp $315 | base $265 | +0.5pp $214 | +1.0pp $162 |
UW: 25.0% down · 7.5% · 30yr · 1.5% tax · 5.0% vac · 8.0% maint · 8.0% mgmt
Financing live
Cash to close
- Down payment
- $49,250
- Closing costs
- $5,910
- Reserves months
- —
- Total cash needed
- —
Loan-product check · same deal, 3 products live
Conventional
25% down · 7.5% · 30yr
- Down + closing
- —
- Monthly P&I
- —
- Monthly cashflow
- —
- DSCR
- —
- Eligible?
- —
Personal DTI + credit; lowest rate.
DSCR
20% down · 8.5% · 30yr
- Down + closing
- —
- Monthly P&I
- —
- Monthly cashflow
- —
- DSCR
- —
- Eligible?
- —
No personal income docs; deal must DSCR.
Hard money
10% down · 12.0% · 12mo
- Down + closing
- —
- Monthly P&I
- —
- Monthly cashflow
- —
- DSCR
- —
- Eligible?
- —
Short-term bridge; refi at stabilization.
Rent comps 22 comps
| Address | Beds | Baths | Sqft | Rent | $/sqft | DOM | Units | Dist |
|---|---|---|---|---|---|---|---|---|
| 1211 Pine Sage Cir West Palm Beach, FL | 3.0 | 2.0 | 1367 | $3,200 | $2.34 | 7d | 1 | 0.65mi |
| 1979 Brandywine Rd Unit 1979-108 West Palm Beach, FL | 3.0 | 2.0 | 1395 | $3,205 | $2.30 | 26d | 1 | 1.10mi |
| 1912 Stratford Way West Palm Beach, FL | 2.0 | 2.5 | 1350 | $3,000 | $2.22 | 26d | 1 | 1.15mi |
| 4855 Elmhurst Rd West Palm Beach, FL | 3.0 | 2.0 | 1427 | $3,600 | $2.52 | 26d | 1 | 1.17mi |
| 149 Stratford N West Palm Beach, FL | 2.0 | 2.0 | 978 | $1,650 | $1.69 | 26d | 1 | 1.21mi |
| 110 Stratford N West Palm Beach, FL | 1.0 | 1.5 | 740 | $1,600 | $2.16 | 20d | 1 | 1.21mi |
| 75 Sheffield D Unit D West Palm Beach, FL | 2.0 | 1.5 | 798 | $1,600 | $2.01 | 3d | 1 | 1.22mi |
| 74 Sheffield D Unit D West Palm Beach, FL | 2.0 | 1.5 | 798 | $1,400 | $1.75 | 26d | 1 | 1.22mi |
| 144 Dorchester G West Palm Beach, FL | 2.0 | 1.5 | 798 | $1,700 | $2.13 | 13d | 1 | 1.32mi |
| 144 Dorchester G West Palm Beach, FL | 2.0 | 1.5 | 798 | $1,700 | $2.13 | 12d | 1 | 1.32mi |
| 2689 Hiawatha Ave West Palm Beach, FL | 3.0 | 2.0 | 1276 | $2,950 | $2.31 | 4d | 1 | 1.34mi |
| 2683 Hiawatha Ave West Palm Beach, FL | 3.0 | 2.0 | 1276 | $3,005 | $2.36 | 26d | 1 | 1.34mi |
| 2677 Hiawatha Ave West Palm Beach, FL | 3.0 | 2.0 | 1276 | $3,005 | $2.36 | 26d | 1 | 1.34mi |
| 2671 Hiawatha Ave West Palm Beach, FL | 3.0 | 2.0 | 1276 | $3,005 | $2.36 | 26d | 1 | 1.34mi |
| 2665 Hiawatha Ave West Palm Beach, FL | 3.0 | 2.0 | 1276 | $3,005 | $2.36 | 26d | 1 | 1.35mi |
| 2615 Hiawatha Ave West Palm Beach, FL | 3.0 | 2.0 | 1276 | $2,950 | $2.31 | 4d | 1 | 1.35mi |
| 79 Dorchester E Unit 79 West Palm Beach, FL | 2.0 | 1.5 | 798 | $1,500 | $1.88 | 26d | 1 | 1.40mi |
| 163 Somerset H West Palm Beach, FL | 2.0 | 2.0 | 874 | $1,500 | $1.72 | 26d | 1 | 1.41mi |
| 330 Andover M Unit M West Palm Beach, FL | 2.0 | 1.5 | 798 | $1,600 | $2.01 | 18d | 1 | 1.42mi |
| 146 Somerset Cres Unit 146 West Palm Beach, FL | 2.0 | 2.0 | 874 | $2,000 | $2.29 | 22d | 1 | 1.42mi |
| 290 Courtney Lakes Cir West Palm Beach, FL | 1.0–3.0 | 1.0–2.0 | 1069 | $2,705 | $2.53 | 21d | 19 | 1.46mi |
| 105 E Wellington Dr #105 West Palm Beach, FL | 2.0 | 2.0 | 1062 | $1,850 | $1.74 | 26d | 1 | 1.50mi |
HOA detail
- Monthly dues
- $315 · $3,780/yr
Listing history 34 events
-
2026-02-18status Pending
-
2026-02-02$197,000 Active
-
2025-11-25historical
-
2025-06-17price $250,000
-
2025-06-13price $260,000
-
2025-05-22$265,000 Active
-
2025-05-13historical
-
2025-04-29price $265,000
-
2025-02-23status Active
-
2025-02-17historical Active Under Contract
-
2025-02-07price $270,000
-
2024-12-06price $275,000
-
2024-11-13$280,000 Active
-
2019-08-07soldstatus $160,000
-
2019-07-31soldstatus $160,000 Closed
-
2019-06-14historical Contingent
-
2019-03-23status Active
-
2019-02-23historical
-
2019-02-07status Active
-
2019-02-04historical
-
2018-11-05price $158,000
-
2018-09-19status Active
-
2018-09-06historical Contingent
-
2018-07-10$160,000 Active
-
2018-04-16historical
-
2018-03-17price $174,900
-
2018-03-15$169,900 Active
-
2014-06-06soldstatus $60,000
-
2014-05-29soldstatus $60,000 Closed
-
2014-05-13status Pending
-
2014-04-21$63,000 Active
-
1992-01-16soldstatus $54,900
-
1988-05-26soldstatus $650,000
-
1987-10-01soldstatus $765,000
ⓘ Source: listings_history table (triggers on properties + properties_extension) + one-shot
backfill from property_details.listing_events for pre-trigger history.
Tax reassessment forecast FL · Resets to sale price
- Current annual tax
- $2,053 · $171/mo
- Projected year-2 tax
- $2,053 · $171/mo
- Expected delta
- $0/yr ($0/mo · 0.0%)
ⓘ Screening estimate from a state-policy table — verify with the county assessor before closing.
Climate risk First Street
- Flood 1/10 Low FEMA zone X (unshaded) · 0% chance over 30 yrs
- Wildfire 2/10 Low
- Heat 9/10 Extreme 7 d/yr ≥105°F today · 24 d/yr by 30 yrs out
- Wind 10/10 Extreme 99% chance of damaging wind over 30 yrs
- Air quality 2/10 Low 1 unhealthy d/yr today · 1 by 30 yrs out
Nearby sold comps map
Loading sold comps map…
Walkable amenities ~0.75 mi
Loading nearby amenities…
Taxation est. · year 1
- Rental income
- $28,347
- − Mortgage interest
- −$11,035
- − Property taxes
- −$2,053
- − Insurance
- −$985
- − Repairs & maintenance
- −$2,268
- − Management
- −$2,268
- − HOA
- −$3,780
- − Depreciation
- −$5,731
- Taxable income
- $227
- Est. tax owed @ 24.0%
- −$54
- After-tax cash flow
- $3,124/yr
For passive investors: Depreciation is non-cash, so a rental often shows a tax loss while cash-flowing — sheltering income. Rental losses are passive: they offset passive income freely, and up to $25,000/yr can offset ordinary (W-2) income if you actively participate and your MAGI is under $100k (phasing out to $0 by $150k); unused losses carry forward. On sale, claimed depreciation is recaptured at up to 25%, and gains may owe capital-gains tax (a 1031 exchange can defer both). Figures are a year-1 estimate at your 24.0% rate — not tax advice; consult a CPA.
Schools (NCES district)
- District
- Palm Beach
- NCES district ID
- 1201500
- Math proficiency
- 46% ▼ -16.00%
- Reading proficiency
- 53% ▼ -4.00%
- Median HH income
- $53,943
- Composite
- 42.72/100
- National rank
- #3160
- State rank
- #34 of 73 in FL
Livability — West Palm Beach
- Score
- 82/100
- State rank
- #75
- US rank
- #1255
Category grades
Schools grade is shown separately in the Schools card above.
Census & demographics
- County
- Palm Beach County · 1,438,312 people
- City population
- 222,012
- Metro
- Miami-Fort Lauderdale-Pompano Beach, FL
- Population (ZIP)
- 33,489
- Household income
- $67,073
- Rent vs Own
- Severe rent burden
- 1333.0
Population outlook (Palm Beach County) Hauer SSP2
- Today (2025)
- 1,637,487 people
- By 2030
- 1,743,255 · +6.5%
- By 2040
- 1,948,712 · +19.0%
- By 2050
- 2,132,979 · +30.3%
- By 2075
- 2,530,027 · +54.5%
- By 2100
- 2,706,979 · +65.3%
Race, ethnicity, and origin ACS 2023
- Neighborhood character
- Highly diverse neighborhood (Simpson 0.70)
- Race & ethnicity
- Hispanic / Latino 36% Black 31% White 27% Two or more races 21% Asian 2%
- Hispanic origin (detail)
- Mexican 4% Puerto Rican 4% Cuban 8% Dominican 1%
- Common ancestry
- Hispanic 8% Romanian 1% Lithuanian 1%
- Foreign-born
- 34% · Canada, Jamaica
- Languages at home
- 55% English-only · Spanish 30% French/Haitian/Cajun 10% Other Indo-European 2%
Political lean MEDSL · Palm Beach
- 2024 margin
- Toss-up / Even · D 50.0% · R 49.2%
- 2008→2024 swing
- -22.1pp toward R · 2008: 22.9pp · 2024: 0.8pp
- All cycles
- 2024: D+0.8 2020: D+12.8 2016: D+15.3 2012: D+17.0 2008: D+22.9
Not yet ingested
- Civics
- —
Market trends
- HPI YoY
- ▼ -128.54%
- Current HPI
- 374.2506
- Rent YoY
- ▼ -0.15%
- Metro
- Miami-Fort Lauderdale-Pompano Beach, FL
- State GDP YoY
- ▲ 3.28%
- F500 in state
- 36
Industry mix (Fortune 500 HQ in FL)
| Industry | F500 HQs | Revenue |
|---|---|---|
| Industrial Technology | 2 | $29B |
|
||
| Insurance | 2 | $17B |
|
||
| Retail | 1 | $60B |
|
||
| Technology Distribution | 1 | $58B |
|
||
| Homebuilding | 1 | $35B |
|
||
| Technology Manufacturing | 1 | $35B |
|
||
Price history
-74.2% since first listed34 events — show timeline
- 2026-02-18 Pending — MARMLS
- 2026-02-02 Listed $197,000 MARMLS
- 2025-11-25 Listing Removed — Beaches MLS
- 2025-06-17 Price Changed $250,000 Beaches MLS
- 2025-06-13 Price Changed $260,000 Beaches MLS
- 2025-05-22 Listed $265,000 Beaches MLS
- 2025-05-13 Listing Removed — Beaches MLS
- 2025-04-29 Price Changed $265,000 Beaches MLS
- 2025-02-23 Relisted — Beaches MLS
- 2025-02-17 Contingent — Beaches MLS
- 2025-02-07 Price Changed $270,000 Beaches MLS
- 2024-12-06 Price Changed $275,000 Beaches MLS
- 2024-11-13 Listed $280,000 Beaches MLS
- 2019-08-07 Sold (Public Records) $160,000 Public Records
- 2019-07-31 Sold (MLS) $160,000 Beaches MLS
- 2019-06-14 Contingent — Beaches MLS
- 2019-03-23 Relisted — Beaches MLS
- 2019-02-23 Listing Removed — Beaches MLS
- 2019-02-07 Relisted — Beaches MLS
- 2019-02-04 Listing Removed — Beaches MLS
- 2018-11-05 Price Changed $158,000 Beaches MLS
- 2018-09-19 Relisted — Beaches MLS
- 2018-09-06 Contingent — Beaches MLS
- 2018-07-10 Listed $160,000 Beaches MLS
- 2018-04-16 Listing Removed — Beaches MLS
- 2018-03-17 Price Changed $174,900 Beaches MLS
- 2018-03-15 Listed $169,900 Beaches MLS
- 2014-06-06 Sold (Public Records) $60,000 Public Records
- 2014-05-29 Sold (MLS) $60,000 Beaches MLS
- 2014-05-13 Pending — Beaches MLS
- 2014-04-21 Listed $63,000 Beaches MLS
- 1992-01-16 Sold (Public Records) $54,900 Public Records
- 1988-05-26 Sold (Public Records) $650,000 Public Records
- 1987-10-01 Sold (Public Records) $765,000 Public Records
Property tax history
+9.6%/yrLatest (2025): $2,053 · +3.9% YoY. Source: county tax records.
Cash-flow waterfall
monthlySold comps — $/sqft
last 12 mo · ≤1 miLoading sold comps…