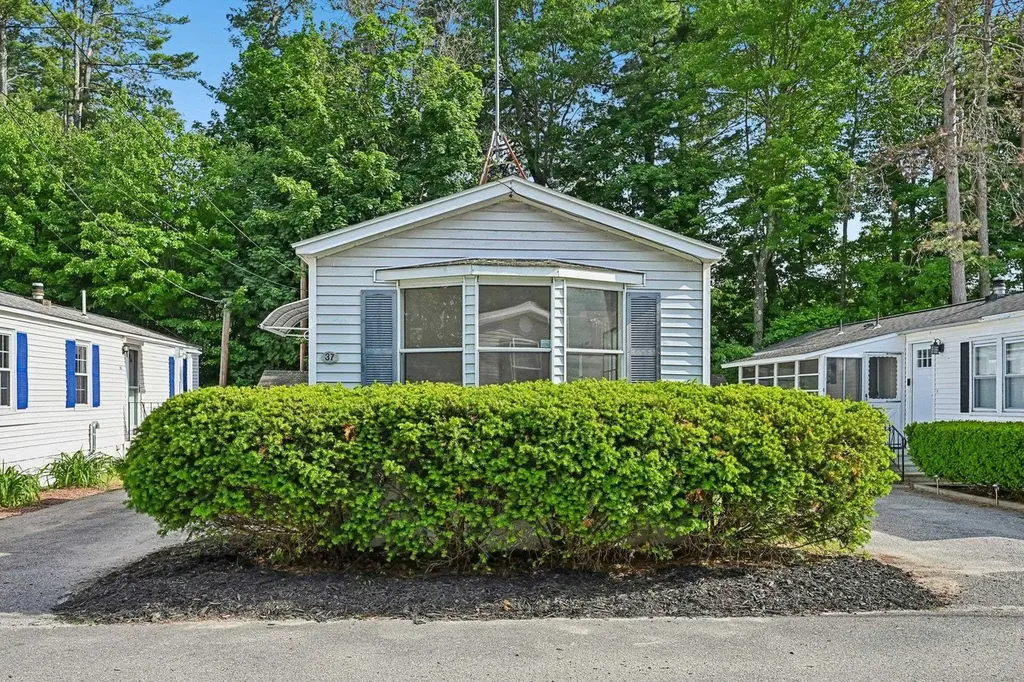
37 Thistle Way · Manchester, NH
Flood risk 1/10 · Minimal
- FEMA flood zone
- X (unshaded)
- Chance of flooding over 30 yrs
- 0.0%
- Est. flood insurance / yr
- $507 – $1,088
Fire risk 2/10 · Minimal
- Est. fire insurance / yr
- $507 – $941
Heat risk 4/10 · Minor
- Hot days now (above 96°F)
- 7 days/yr
- Hot days in 30 yrs
- 15 days/yr
Wind risk 5/10 · Moderate
- Chance of severe wind over 30 yrs
- 23.0%
Air-quality risk 2/10 · Minimal
- Unhealthy air days now
- 1 days/yr
- Unhealthy air days in 30 yrs
- 2 days/yr
Risk factors via First Street. Map © Google.
Why this score? — see what drove the C+ grade
The composite is a weighted blend of 9 inputs, each scored 0–100. Each bar is that input's sub-score; the figure is the points it added to the 100-point composite (weight × sub-score).
- Cash flow +28.9/30.0
- DSCR +10.0/10.0
- ARV discount +7.4/15.0
- 1% rule +7.2/10.0
- Livability +4.2/5.0
- Rent growth +2.5/5.0
- Condition / age +2.5/5.0
- Schools +1.9/10.0
- Appreciation +0.0/10.0
$150,000
🖨 Deal sheet 📄 Offer letter ✓ Due diligence
Listing remarks
Welcome to this desirable manufactured home community in Manchester, NH. This two bedroom, one bathroom home offers an affordable opportunity in a great location, just a short walk from Crystal Lake. Enjoy a peaceful neighborhood setting with nearby areas to walk and enjoy the outdoors. The home has been freshly painted and features new flooring throughout. As one of the more affordable privately owned communities in Southern New Hampshire, this is a great option for those looking for comfort, convenience, and value. Park approval is required for purchase.
Key facts
- New flooring
- Built 1987
- Listed 10 days
Tags
Property features AI
Finance
- Other: Directions: Mammoth Rd to Bodwell Rd, right on Corning Rd, left on Thistle Way
- HOA & community: Monthly park/community fees; Park rent included in fees; Fees include plowing and trash removal; Association amenities include snow removal and trash removal
Exterior
- Parking: Paved driveway
- Utilities: Public water; Public sewer; Circuit breaker electrical service; Internet availability unknown; Other utilities
- Home design: Manufactured/mobile home; Existing structure; Built in 1987; Shingle - asphalt roof
- Construction: Aluminum siding and other exterior materials
- Exterior features: Beach access; Lake access; Level lot; Near golf course; Close to shopping; Near hospital; Near schools; Association road frontage; Paved driveway; Located in Lakeside Mobile Home Park (park approval granted)
Interior
- Kitchen: Electric range; Refrigerator
- Bedrooms: Master bedroom on main level; Additional bedroom on main level
- Flooring: Carpet; Laminate
- Bathrooms: One full bathroom on main level
- Heating & cooling: Forced air heating
- Interior features: 4 total rooms; Full bath on the main level
- Laundry & utility: Water heater (domestic)
Neighborhood map
What this means for you Summary
Snapshot
- This is a 2-bed/1.0-bath manufactured listed at $150k.
Deal economics
- At list price, monthly cash flow is $510 ($6k/yr) — positive.
- The deal already cash-flows at list — no discount required.
- Meets the 1% rule at list price ($2k rent vs $150k).
- Cap rate 10.4% vs local median 3.1% in Manchester — top-decile yield for the area; either an underpriced asset or a hidden risk that comps aren't pricing in. Stress-test before assuming the spread holds.
Location & tenants
- Location reads 83/100 on livability (#10 in NH, #879 nationally) — a professional / high-income tenant draw. Strengths: amenities A+, commute A+, housing A+.
- Manchester School District (urban): math 14% / reading 27% proficiency, ranked #96 of 98 in NH (top 98%) — low school quality limits family demand, transient renter base, plan for 1-2y turnover.
- Zoned schools: Green Acres School (math 27% / reading 42%, grade F, #179 of 263 statewide, top 71%, 435 students, 22% FRL) — zoned schools average 22% FRL vs 50% district-wide (28 pts lower); this property's tenant base skews higher-income than the district average.
- Zoned-school proficiency averages 34% at this address vs 20% district-wide (+14 pts) — the actual schools serving this property are materially stronger than the Manchester School District average implies; a family-tenant draw the district grade alone would hide.
- Market conditions: 35 active listings in the ZIP; 6 comparable units currently listed for rent nearby; rentals leasing fast (median 14d on market — plan ~1-2 weeks tenant-placement turnaround); 981 units permitted in Hillsborough County in 2024 (381 in 5+ unit buildings).
Forward outlook
- Local home prices are declining (-3.0%/yr); year-one equity from $1k of loan paydown is wiped out by about $4k of value loss. Plan a longer hold.
- Hillsborough County population projected to shrink 8% by 2050 — rents likely to lag national; underwrite the cash flow, not the appreciation.
- At projected returns (-3.0% appreciation + 3.0% rent growth), your $42k cash investment doubles in ~9 years — after that, you're playing with house money.
Negotiation context
- Only 10 days on market — expect competitive offers; lowballing is unlikely to land.
Risks & watch-outs
- Climate carrying-cost: moderate wind risk, 23% chance of damaging wind over 30y — expect insurance premiums to compound above CPI over the hold.
Questions for the listing agent
- Is there a deadline driving the sale (1031 exchange, divorce, estate, relocation)? That informs how much negotiation room exists.
- What's the average days-on-market for RENTAL listings here right now (not sales)? A rising rental-DOM trend means longer vacancies and softer asking-rent achievability than the comps imply.
- What's the recent tenant-quality profile in this submarket — average credit score on applications, eviction rate, late-payment / NSF rate, and stable-employment percentage? A property-management company in the area should have these aggregated.
- How much new for-sale + rental construction is in the pipeline within 1–3 miles? Heavy new supply typically softens prices + rents 12–24 months out; constrained supply supports both.
Investment metrics
- 1% rule
- 1.22% ✓
- Cap rate
- 10.37%
- Cash-on-cash
- 14.57%
- DSCR
- 1.65
- GRM
- 6.8
CMA / ARV
- ARV (on-the-fly)
- $149,744
- Comps found
- 3
Show comp detail 3 sales within ~0.75 mi
| Address | Dist | Beds/Ba | Sqft | Sold | Price | $/sf | Match |
|---|---|---|---|---|---|---|---|
| 41 Thistle Way | 0.01mi | 2/1.0 | 784 (0%) | 1mo | $163,900 | $209 | 99 |
| 33 Thistle Way | 0.01mi | 2/1.5 | 784 (0%) | 9mo | $150,000 | $191 | 90 |
| 16 Milky Way | 0.04mi | 2/1.5 | 784 (0%) | 22mo | $135,000 | $172 | 78 |
Match score weights: distance 35% · size 25% · config 20% · recency 20%. Top-matched comps best support the ARV.
Projected returns pro-forma
-3.0% appreciation · 3.0% rent growth · sell at horizon
- IRR
- 5.0%
- Equity multiple
- 1.19×
- Total profit
- $8,145
- Equity at exit
- $22,365
- IRR
- 14.4%
- Equity multiple
- 2.16×
- Total profit
- $48,783
- Equity at exit
- $12,969
Cash invested: $42,000 (down + closing). Projections, not guarantees.
Landlord ↔ Tenant lean methodology
- Overall (STATE)
- 56 Moderately Landlord-Leaning
- State New Hampshire
- 56 Moderately Landlord-Leaning · D+1
- County
- — inherits STATE
- City
- — inherits STATE
ZIP-level market 03109
- Home prices YoY
- -19.7%
- Active inventory
- 35
- Price-to-rent
- 6.8×
Monthly cashflow live
- Estimated rent
- $1,829 high interval (Pro) →
- Mortgage (P&I)
- −$787
- Tax from tax record
- −$86 /mo · $1,028/yr
- Insurance
- −$62
- HOA
- −$0
- Vacancy / Maint / Mgmt
- −$384
- Net cashflow
- $510
Break-even live
UW: 25.0% down · 7.5% · 30yr · 1.5% tax · 5.0% vac · 8.0% maint · 8.0% mgmt
Financing live
Cash to close
- Down payment
- $37,500
- Closing costs
- $4,500
- Reserves months
- —
- Total cash needed
- —
Loan-product check · same deal, 3 products live
Conventional
25% down · 7.5% · 30yr
- Down + closing
- —
- Monthly P&I
- —
- Monthly cashflow
- —
- DSCR
- —
- Eligible?
- —
Personal DTI + credit; lowest rate.
DSCR
20% down · 8.5% · 30yr
- Down + closing
- —
- Monthly P&I
- —
- Monthly cashflow
- —
- DSCR
- —
- Eligible?
- —
No personal income docs; deal must DSCR.
Hard money
10% down · 12.0% · 12mo
- Down + closing
- —
- Monthly P&I
- —
- Monthly cashflow
- —
- DSCR
- —
- Eligible?
- —
Short-term bridge; refi at stabilization.
Rent comps 6 comps
| Address | Beds | Baths | Sqft | Rent | $/sqft | DOM | Units | Dist |
|---|---|---|---|---|---|---|---|---|
| 1225 Bodwell Rd #22 Manchester, NH | 1.0 | 1.0 | 656 | $1,400 | $2.13 | 13d | 1 | 0.41mi |
| 1445 Bodwell Rd Manchester, NH | 2.0 | 1.0 | 485 | $2,055 | $4.24 | 12d | 1 | 0.70mi |
| 1025 S Mammoth Rd #6 Manchester, NH | 2.0 | 1.5 | 1080 | $2,500 | $2.31 | 13d | 1 | 1.02mi |
| 1799 Bodwell Rd #2 Manchester, NH | 2.0 | 1.0 | 795 | $1,695 | $2.13 | 13d | 1 | 1.14mi |
| 379 Huse Rd Manchester, NH | 1.0–2.0 | 1.0 | 806 | $2,200 | $2.73 | 13d | 2 | 1.50mi |
| 379 Huse Rd #33 Manchester, NH | 1.0 | 1.0 | 664 | $1,961 | $2.95 | 21d | 1 | 1.50mi |
Listing history 9 events
-
2026-06-18days on market $150,000 Active 10 DOM
-
2026-06-17days on market $150,000 Active 9 DOM
-
2026-06-16days on market $150,000 Active 8 DOM
-
2026-06-15days on market $150,000 Active 7 DOM
-
2026-06-14days on market $150,000 Active 5 DOM
-
2026-06-13days on market $150,000 Active 4 DOM
-
2026-06-10days on market $150,000 Active 2 DOM
-
2026-06-09remarks 562-char remark
-
2026-06-09$150,000 Active 1 DOM
ⓘ Source: listings_history table (triggers on properties + properties_extension) + one-shot
backfill from property_details.listing_events for pre-trigger history.
Tax reassessment forecast NH · Partial reset (capped growth)
- Current annual tax
- $1,028 · $86/mo
- Projected year-2 tax
- $2,149 · $179/mo
- Expected delta
- +$1,121/yr (+$93/mo · 109.0%)
ⓘ Screening estimate from a state-policy table — verify with the county assessor before closing.
Climate risk First Street
- Flood 1/10 Low FEMA zone X (unshaded) · 0% chance over 30 yrs
- Wildfire 2/10 Low
- Heat 4/10 Moderate 7 d/yr ≥96°F today · 15 d/yr by 30 yrs out
- Wind 5/10 Major 23% chance of damaging wind over 30 yrs
- Air quality 2/10 Low 1 unhealthy d/yr today · 2 by 30 yrs out
Nearby sold comps map
Loading sold comps map…
Walkable amenities ~0.75 mi
Loading nearby amenities…
Taxation est. · year 1
- Rental income
- $21,947
- − Mortgage interest
- −$8,402
- − Property taxes
- −$1,028
- − Insurance
- −$750
- − Repairs & maintenance
- −$1,756
- − Management
- −$1,756
- − Depreciation
- −$4,364
- Taxable income
- $3,892
- Est. tax owed @ 24.0%
- −$934
- After-tax cash flow
- $5,187/yr
For passive investors: Depreciation is non-cash, so a rental often shows a tax loss while cash-flowing — sheltering income. Rental losses are passive: they offset passive income freely, and up to $25,000/yr can offset ordinary (W-2) income if you actively participate and your MAGI is under $100k (phasing out to $0 by $150k); unused losses carry forward. On sale, claimed depreciation is recaptured at up to 25%, and gains may owe capital-gains tax (a 1031 exchange can defer both). Figures are a year-1 estimate at your 24.0% rate — not tax advice; consult a CPA.
Schools (NCES district)
- District
- Manchester School District
- NCES district ID
- 3304590
- Math proficiency
- 14% ▼ -10.00%
- Reading proficiency
- 27% ▼ -6.00%
- Median HH income
- $54,096
- Composite
- 18.67/100
- National rank
- #8886
- State rank
- #96 of 98 in NH
Livability — Manchester
- Score
- 83/100
- State rank
- #10
- US rank
- #879
Category grades
Schools grade is shown separately in the Schools card above.
Census & demographics
- Census place
- Manchester, NH
- City population
- 110,172
- Population (ZIP)
- 10,118
Population outlook (Hillsborough County) Hauer SSP2
- Today (2025)
- 412,771 people
- By 2030
- 410,974 · -0.4%
- By 2040
- 399,959 · -3.1%
- By 2050
- 381,542 · -7.6%
- By 2075
- 339,855 · -17.7%
- By 2100
- 289,270 · -29.9%
Race, ethnicity, and origin ACS 2023
- Neighborhood character
- Predominantly White (90%)
- Race & ethnicity
- White 90% Two or more races 6% Asian 2% Hispanic / Latino 1%
- Common ancestry
- Lithuanian 11% Romanian 3% Russian 2%
- Foreign-born
- 4% · Canada, Vietnam
- Languages at home
- 91% English-only · French/Haitian/Cajun 4% Other Indo-European 3% German/W. Germanic 1%
Political lean MEDSL · Hillsborough
- 2024 margin
- Toss-up / Even · D 50.9% · R 48.0% · Other 1.0%
- 2008→2024 swing
- -0.9pp no change · 2008: 3.8pp · 2024: 2.9pp
- All cycles
- 2024: D+2.9 2020: D+7.7 2016: R+0.2 2012: D+1.7 2008: D+3.8
Not yet ingested
- Civics
- —
Market trends
- HPI YoY
- ▼ -86.66%
- Current HPI
- 353.7732
- Rent YoY
- —
- Metro
- —
- State GDP YoY
- —
- F500 in state
- 0
Price history
1 event — show timeline
- 2026-06-08 Listed $150,000 PrimeMLS
Property tax history
+0.2%/yrLatest (2024): $1,028 · +3.8% YoY. Source: county tax records.
Cash-flow waterfall
monthlySold comps — $/sqft
last 12 mo · ≤1 miLoading sold comps…