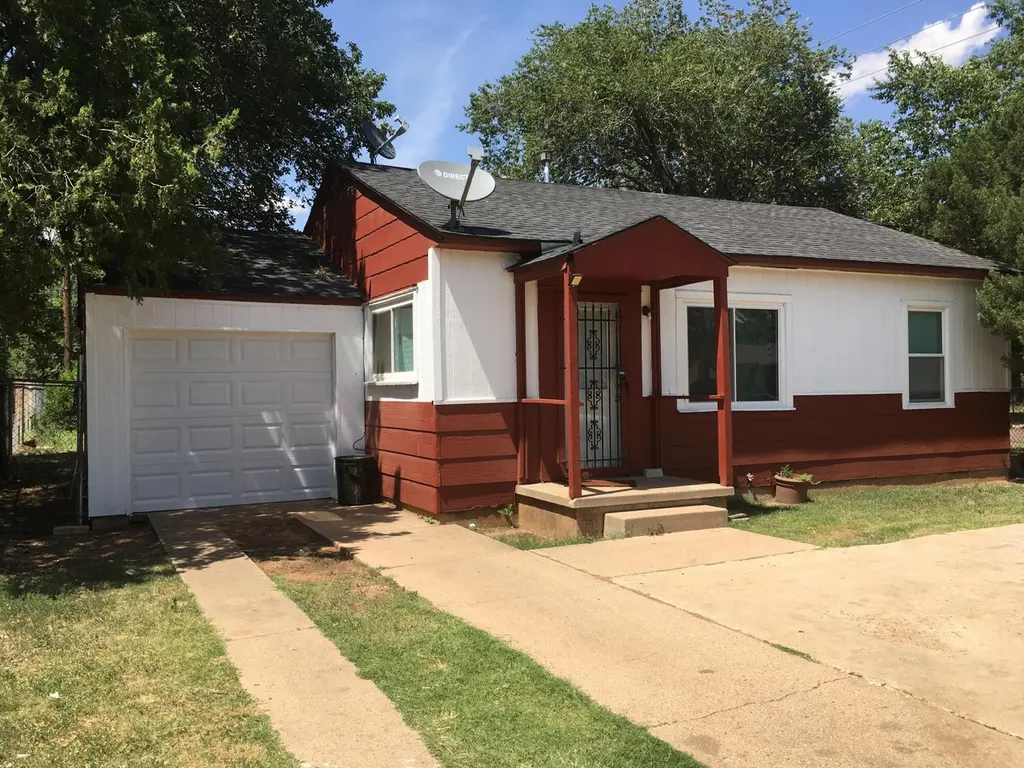
2702 2nd Pl · Lubbock, TX
Flood risk 1/10 · Minimal
- FEMA flood zone
- X (unshaded)
- Chance of flooding over 30 yrs
- 0.0%
- Est. flood insurance / yr
- $507 – $1,088
Fire risk 2/10 · Minimal
- Est. fire insurance / yr
- $1,222 – $2,270
Heat risk 5/10 · Moderate
- Hot days now (above 100°F)
- 7 days/yr
- Hot days in 30 yrs
- 21 days/yr
Wind risk 2/10 · Minimal
- Chance of severe wind over 30 yrs
- —
Air-quality risk 2/10 · Minimal
- Unhealthy air days now
- 1 days/yr
- Unhealthy air days in 30 yrs
- 1 days/yr
Risk factors via First Street. Map © Google.
Why this score? — see what drove the D+ grade
The composite is a weighted blend of 9 inputs, each scored 0–100. Each bar is that input's sub-score; the figure is the points it added to the 100-point composite (weight × sub-score).
- Cash flow +16.5/30.0
- ARV discount +7.5/15.0
- DSCR +5.1/10.0
- 1% rule +4.1/10.0
- Livability +4.0/5.0
- Schools +3.1/10.0
- Rent growth +2.5/5.0
- Condition / age +2.5/5.0
- Appreciation +0.0/10.0
$99,900
🖨 Deal sheet 📄 Offer letter ✓ Due diligence
Listing remarks
Investment property that has monthly income. Offer 2 bedrooms, one bath and a one car garage. Call now for your private showing.
Key facts
- 6,875 sq ft lot
- Garage
- Built 1947
Property features AI
Finance
- HOA & community: Nearby park
Exterior
- Parking: Attached garage; Additional parking available; Off-street and on-street parking
- Security: Smoke detector(s)
- Utilities: Public water; Public sewer; Electricity connected; Natural gas connected; Natural gas available; Water connected; Sewer connected
- Home design: Single-family residence; Single-story; Updated / remodeled
- Construction: Asbestos construction materials; Pillar/post/pier foundation; Composition roof
- Exterior features: Private yard; Fenced backyard; City lot on a corner
Interior
- Kitchen: Range / Free-standing range; Refrigerator
- Bedrooms: Total of 4 rooms (includes bedrooms and living spaces)
- Flooring: Tile flooring; Wood flooring
- Bathrooms: 1 full bathroom
- Heating & cooling: Central heating (electric and natural gas); Central air conditioning; Ceiling fans
- Interior features: Ceiling fans; Aluminum window frames; Smoke detector(s)
- Laundry & utility: Laundry area located in the garage
Neighborhood map
What this means for you Summary
Snapshot
- This is a 3-bed/1.0-bath single-family listed at $100k.
Deal economics
- At list price, monthly cash flow is $59 ($708/yr) — positive.
- The deal already cash-flows at list — no discount required.
- To meet the 1% rule (rent ≥ 1% of price), the offer needs to be $91k (8.7% below list).
- Recommended offer: $91k (8.7% below list) — sets the bar for 1% rule.
Location & tenants
- Location reads 80/100 on livability (#37 in TX, #1,749 nationally) — a professional / high-income tenant draw. Strengths: commute A+, cost of living A+, housing A+; Watch: employment C-, crime F.
- Lubbock ISD (urban): math 36% / reading 39% proficiency, ranked #481 of 826 in TX (top 58%) — families likely to look elsewhere, expect single-tenant / working-renter base with shorter leases; 60% free/reduced lunch — lower-income household profile, screen leases tightly.
- Zoned schools: Mcwhorter El (math 28% / reading 27%, grade F, #2,768 of 4,322 statewide, top 65%, 535 students, 94% FRL); Cavazos Middle (math 24% / reading 24%, grade F, #1,301 of 1,662 statewide, top 79%, 479 students, 97% FRL); Lubbock H S (math 45% / reading 52%, grade D, #560 of 1,632 statewide, top 35%, 1,839 students, 55% FRL) — zoned schools average 82% FRL vs 60% district-wide (22 pts higher); higher-poverty schools than district average — tighter screening recommended.
- Market conditions: 110 active listings in the ZIP; 37 comparable units currently listed for rent nearby; rentals at typical pace (median 21d on market — plan ~3-4 weeks tenant-placement turnaround); 49% of comp listings sitting > 30 days — soft ceiling on asking rent; lower-income renter base — watch delinquency; 2,219 units permitted in Lubbock County in 2024 (252 in 5+ unit buildings).
- This rent runs 30% of the median local income ($36k/yr) — at the standard rent-burdened threshold; future hikes will face affordability resistance.
Forward outlook
- Local home prices are declining (-3.0%/yr); year-one equity from $691 of loan paydown is wiped out by about $3k of value loss. Plan a longer hold.
- Lubbock County population projected at +39% by 2050 — long-run rental-demand tailwind backs the buy-and-hold thesis.
Negotiation context
- It's been on market 27 days — a 2% lower offer ($98k) is reasonable based on typical stale-listing flexibility.
- 2 sale attempts since 6y ago with the ask held roughly flat each time — persistent listings suggest the price (not the market) is what's stuck; bring a comps-based counter.
Risks & watch-outs
- Watch-outs: built in 1947 — expect roof / HVAC / electrical / plumbing capex.
- Climate carrying-cost: extreme-heat days projected 7→21/yr by 2055 (HVAC capex compounding) — expect insurance premiums to compound above CPI over the hold.
Questions for the listing agent
- Built in 1947 — when were the roof, HVAC, electrical panel, plumbing, and water heater last replaced?
- Is there a deadline driving the sale (1031 exchange, divorce, estate, relocation)? That informs how much negotiation room exists.
- Schools are D-rated, which usually means shorter tenancies and higher turnover. Who's the typical renter profile here, and what's been the actual vacancy rate?
- Crime grade is F in this area — have there been break-ins, vandalism, or insurance claims at this property in the last 3 years? What carrier currently insures it and at what premium?
- The area grade is low — what's the realistic commute time and amenity access for the typical tenant pool here? Any planned neighborhood developments (good or bad) we should know about?
- What's the average days-on-market for RENTAL listings here right now (not sales)? A rising rental-DOM trend means longer vacancies and softer asking-rent achievability than the comps imply.
- What's the recent tenant-quality profile in this submarket — average credit score on applications, eviction rate, late-payment / NSF rate, and stable-employment percentage? A property-management company in the area should have these aggregated.
- How much new for-sale + rental construction is in the pipeline within 1–3 miles? Heavy new supply typically softens prices + rents 12–24 months out; constrained supply supports both.
Investment metrics
- 1% rule
- 0.91% ✗
- Cap rate
- 7.00%
- Cash-on-cash
- 2.53%
- DSCR
- 1.11
- GRM
- 9.1
CMA / ARV
No comps found within radius.
Projected returns pro-forma
-3.0% appreciation · 3.0% rent growth · sell at horizon
- IRR
- -12.3%
- Equity multiple
- 0.56×
- Total profit
- $-12,432
- Equity at exit
- $14,895
- IRR
- -3.2%
- Equity multiple
- 0.79×
- Total profit
- $-6,000
- Equity at exit
- $8,638
Cash invested: $27,972 (down + closing). Projections, not guarantees.
Landlord ↔ Tenant lean methodology
- Overall (STATE)
- 87 Strongly Landlord-Friendly
- State Texas
- 87 Strongly Landlord-Friendly · R+5
- County
- — inherits STATE
- City
- — inherits STATE
ZIP-level market 79415
- Home prices YoY
- -20.1%
- Active inventory
- 110
- Price-to-rent
- 9.1×
Monthly cashflow live
- Estimated rent
- $912 high interval (Pro) →
- Mortgage (P&I)
- −$524
- Tax from tax record
- −$96 /mo · $1,151/yr
- Insurance
- −$42
- HOA
- −$0
- Vacancy / Maint / Mgmt
- −$192
- Net cashflow
- $59
Break-even live
UW: 25.0% down · 7.5% · 30yr · 1.5% tax · 5.0% vac · 8.0% maint · 8.0% mgmt
Financing live
Cash to close
- Down payment
- $24,975
- Closing costs
- $2,997
- Reserves months
- —
- Total cash needed
- —
Loan-product check · same deal, 3 products live
Conventional
25% down · 7.5% · 30yr
- Down + closing
- —
- Monthly P&I
- —
- Monthly cashflow
- —
- DSCR
- —
- Eligible?
- —
Personal DTI + credit; lowest rate.
DSCR
20% down · 8.5% · 30yr
- Down + closing
- —
- Monthly P&I
- —
- Monthly cashflow
- —
- DSCR
- —
- Eligible?
- —
No personal income docs; deal must DSCR.
Hard money
10% down · 12.0% · 12mo
- Down + closing
- —
- Monthly P&I
- —
- Monthly cashflow
- —
- DSCR
- —
- Eligible?
- —
Short-term bridge; refi at stabilization.
Rent comps 37 comps
| Address | Beds | Baths | Sqft | Rent | $/sqft | DOM | Units | Dist |
|---|---|---|---|---|---|---|---|---|
| 2803 2nd St Lubbock, TX | 2.0 | 1.0 | 784 | $800 | $1.02 | 43d | 1 | 0.14mi |
| 2805 1st Pl Lubbock, TX | 2.0 | 1.0 | 730 | $895 | $1.23 | 21d | 1 | 0.18mi |
| 2814 1st Pl Lubbock, TX | 2.0 | 1.0 | 676 | $695 | $1.03 | 21d | 1 | 0.23mi |
| 2814 1st Pl Lubbock, TX | 2.0 | 1.0 | 676 | $695 | $1.03 | 43d | 1 | 0.23mi |
| 2512 1st St Lubbock, TX | 2.0 | 1.0 | 1050 | $900 | $0.86 | 13d | 1 | 0.30mi |
| 2613 Auburn St Lubbock, TX | 2.0 | 1.0 | 978 | $875 | $0.89 | 43d | 1 | 0.31mi |
| 3207 Amherst St Lubbock, TX | 3.0 | 1.0 | 1020 | $1,200 | $1.18 | 43d | 1 | 0.58mi |
| 114 Avenue V Lubbock, TX | 2.0 | 1.0 | 728 | $750 | $1.03 | 43d | 1 | 0.63mi |
| 2906 Cornell St Lubbock, TX | 2.0 | 1.0 | 920 | $875 | $0.95 | 13d | 1 | 0.63mi |
| 3315 Amherst St Lubbock, TX | 2.0 | 1.0 | 950 | $875 | $0.92 | 21d | 1 | 0.73mi |
| 105 North Avenue U Unit U Lubbock, TX | 2.0 | 1.0 | 672 | $750 | $1.12 | 43d | 1 | 0.78mi |
| 301 Avenue U Lubbock, TX | 1.0–2.0 | 1.0 | 625 | $875 | $1.40 | 13d | 4 | 0.78mi |
| 3207 Duke St Lubbock, TX | 2.0 | 1.0 | 647 | $695 | $1.07 | 43d | 1 | 0.87mi |
| 3207 Duke St Lubbock, TX | 2.0 | 1.0 | 647 | $595 | $0.92 | 21d | 1 | 0.87mi |
| 2715 Fordham St Unit 7 Lubbock, TX | 2.0 | 2.0 | 1100 | $1,150 | $1.05 | 43d | 1 | 0.88mi |
| 2315 13th St Lubbock, TX | 2.0 | 1.0 | 825 | $995 | $1.21 | 43d | 1 | 0.92mi |
| 2316 15th St Lubbock, TX | 2.0 | 1.0 | 960 | $795 | $0.83 | 21d | 1 | 1.00mi |
| 2317 15th St Lubbock, TX | 2.0 | 1.0 | 900 | $1,000 | $1.11 | 43d | 1 | 1.02mi |
| 3307 Erskine St Lubbock, TX | 3.0 | 1.0 | 1120 | $1,000 | $0.89 | 21d | 1 | 1.05mi |
| 2117 14th St Unit A Lubbock, TX | 2.0 | 2.0 | 980 | $1,250 | $1.28 | 21d | 1 | 1.09mi |
| 1619 University Ave Unit 8 Lubbock, TX | 2.0 | 2.0 | 900 | $700 | $0.78 | 43d | 1 | 1.13mi |
| 2101 14th St Lubbock, TX | 2.0 | 1.0 | 895 | $850 | $0.95 | 21d | 1 | 1.14mi |
| 2101 14th St Lubbock, TX | 2.0 | 1.0 | 895 | $850 | $0.95 | 43d | 1 | 1.14mi |
| 1710 9th St Unit 29 Lubbock, TX | 2.0 | 1.0 | 700 | $1,000 | $1.43 | 13d | 1 | 1.20mi |
| 2101 16th St Unit 2D Lubbock, TX | 2.0 | 1.0 | 950 | $825 | $0.87 | 43d | 1 | 1.24mi |
| 2121 17th St Lubbock, TX | 3.0 | 1.0 | 1048 | $995 | $0.95 | 21d | 1 | 1.24mi |
| 701 N Indiana Ave Lubbock, TX | 1.0–2.0 | 1.0–2.0 | 675 | $850 | $1.26 | 21d | 1 | 1.27mi |
| 3318 Itasca St Lubbock, TX | 3.0 | 1.5 | 1068 | $950 | $0.89 | 13d | 1 | 1.29mi |
| 1805 Avenue V Unit V Lubbock, TX | 2.0 | 1.0 | 558 | $599 | $1.07 | 21d | 1 | 1.30mi |
| 2320 20th St Lubbock, TX | 2.0 | 1.0 | 844 | $1,000 | $1.18 | 43d | 1 | 1.33mi |
| 2516 21st St Lubbock, TX | 2.0 | 1.0 | 1052 | $1,125 | $1.07 | 43d | 1 | 1.34mi |
| 2307 20th St Lubbock, TX | 2.0 | 2.0 | 850 | $850 | $1.00 | 43d | 1 | 1.37mi |
| 2408 22nd St Lubbock, TX | 2.0 | 1.0 | 1000 | $1,100 | $1.10 | 13d | 1 | 1.45mi |
| 2518 23rd St Lubbock, TX | 2.0 | 1.0 | 900 | $1,075 | $1.19 | 43d | 1 | 1.47mi |
| 2122 21st St Lubbock, TX | 2.0 | 1.0 | 800 | $750 | $0.94 | 21d | 2 | 1.48mi |
| 2122 21st St Unit B Lubbock, TX | 2.0 | 1.0 | 800 | $750 | $0.94 | 21d | 1 | 1.48mi |
| 2122 21st St Unit A Lubbock, TX | 2.0 | 1.0 | 800 | $800 | $1.00 | 43d | 1 | 1.48mi |
Listing history 22 events
-
2026-06-18days on market $99,900 Active 27 DOM
-
2026-06-17days on market $99,900 Active 26 DOM
-
2026-06-16days on market $99,900 Active 25 DOM
-
2026-06-15days on market $99,900 Active 24 DOM
-
2026-06-14days on market $99,900 Active 22 DOM
-
2026-06-13days on market $99,900 Active 21 DOM
-
2026-06-10days on market $99,900 Active 19 DOM
-
2026-06-09days on market $99,900 Active 18 DOM
-
2026-06-08days on market $99,900 Active 17 DOM
-
2026-06-07days on market $99,900 Active 16 DOM
-
2026-06-05days on market $99,900 Active 13 DOM
-
2026-06-03days on market $99,900 Active 12 DOM
-
2026-06-02days on market $99,900 Active 11 DOM
-
2026-06-01days on market $99,900 Active 10 DOM
-
2026-05-31days on market $99,900 Active 9 DOM
-
2026-05-30days on market $99,900 Active 8 DOM
-
2026-05-22$99,900 Active
-
2022-02-28soldstatus
-
2020-10-09soldstatus
-
2020-08-05$89,000
-
2007-10-25soldstatus
-
2006-08-15soldstatus
ⓘ Source: listings_history table (triggers on properties + properties_extension) + one-shot
backfill from property_details.listing_events for pre-trigger history.
Tax reassessment forecast TX · Resets to sale price
- Current annual tax
- $1,151 · $96/mo
- Projected year-2 tax
- $1,828 · $152/mo
- Expected delta
- +$677/yr (+$56/mo · 58.8%)
ⓘ Screening estimate from a state-policy table — verify with the county assessor before closing.
Climate risk First Street
- Flood 1/10 Low FEMA zone X (unshaded) · 0% chance over 30 yrs
- Wildfire 2/10 Low
- Heat 5/10 Major 7 d/yr ≥100°F today · 21 d/yr by 30 yrs out
- Wind 2/10 Low
- Air quality 2/10 Low 1 unhealthy d/yr today · 1 by 30 yrs out
Nearby sold comps map
Loading sold comps map…
Walkable amenities ~0.75 mi
Loading nearby amenities…
Taxation est. · year 1
- Rental income
- $10,944
- − Mortgage interest
- −$5,596
- − Property taxes
- −$1,151
- − Insurance
- −$500
- − Repairs & maintenance
- −$876
- − Management
- −$876
- − Depreciation
- −$2,906
- Taxable loss
- −$960
- Est. tax savings @ 24.0%
- +$230
- After-tax cash flow
- $939/yr
For passive investors: Depreciation is non-cash, so a rental often shows a tax loss while cash-flowing — sheltering income. Rental losses are passive: they offset passive income freely, and up to $25,000/yr can offset ordinary (W-2) income if you actively participate and your MAGI is under $100k (phasing out to $0 by $150k); unused losses carry forward. On sale, claimed depreciation is recaptured at up to 25%, and gains may owe capital-gains tax (a 1031 exchange can defer both). Figures are a year-1 estimate at your 24.0% rate — not tax advice; consult a CPA.
Schools (NCES district)
- District
- Lubbock ISD
- NCES district ID
- 4828500
- Math proficiency
- 36% ▼ -8.00%
- Reading proficiency
- 39% ▼ -1.00%
- Median HH income
- $39,820
- Composite
- 31.44/100
- National rank
- #5984
- State rank
- #481 of 826 in TX
Livability — Lubbock
- Score
- 80/100
- State rank
- #37
- US rank
- #1749
Category grades
Schools grade is shown separately in the Schools card above.
Census & demographics
- Census place
- Lubbock, TX
- County
- Lubbock County · 293,542 people
- City population
- 283,030
- Metro
- Lubbock, TX
- Population (ZIP)
- 15,794
- Household income
- $36,468
- Rent vs Own
- Severe rent burden
- 1287.0
Population outlook (Lubbock County) Hauer SSP2
- Today (2025)
- 345,960 people
- By 2030
- 371,449 · +7.4%
- By 2040
- 424,539 · +22.7%
- By 2050
- 481,150 · +39.1%
- By 2075
- 633,467 · +83.1%
- By 2100
- 746,853 · +115.9%
Race, ethnicity, and origin ACS 2023
- Neighborhood character
- Diverse neighborhood (Simpson 0.58)
- Race & ethnicity
- Hispanic / Latino 59% White 26% Two or more races 19% Black 7% Asian 5%
- Hispanic origin (detail)
- Mexican 49%
- Common ancestry
- Italian 1% Serbian 1% Estonian 1%
- Foreign-born
- 15% · Canada, China
- Languages at home
- 57% English-only · Spanish 36% Other Indo-European 4% Arabic 1%
Political lean MEDSL · Lubbock
- 2024 margin
- Solid R (+39.5) · D 29.7% · R 69.2% · Other 1.0%
- 2008→2024 swing
- -2.8pp toward R · 2008: -36.7pp · 2024: -39.5pp
- All cycles
- 2024: R+39.5 2020: R+32.2 2016: R+38.4 2012: R+40.9 2008: R+36.7
Not yet ingested
- Civics
- —
Market trends
- HPI YoY
- ▼ -41.79%
- Current HPI
- 165.7933
- Rent YoY
- —
- Metro
- Lubbock, TX
- State GDP YoY
- ▲ 3.95%
- F500 in state
- 110
Industry mix (Fortune 500 HQ in TX)
| Industry | F500 HQs | Revenue |
|---|---|---|
| Energy | 16 | $1,198B |
|
||
| Technology | 5 | $198B |
|
||
| Engineering / Construction | 4 | $72B |
|
||
| Energy Services | 3 | $60B |
|
||
| Utilities | 3 | $41B |
|
||
| Healthcare | 2 | $330B |
|
||
Price history
+12.2% since first listed6 events — show timeline
- 2026-05-22 Listed $99,900 LARMLS
- 2022-02-28 Sold (Public Records) — Public Records
- 2020-10-09 Sold (Public Records) — Public Records
- 2020-08-05 Listed $89,000 LARMLS
- 2007-10-25 Sold (Public Records) — Public Records
- 2006-08-15 Sold (Public Records) — Public Records
Property tax history
+4.9%/yrLatest (2025): $1,151 · -1.2% YoY. Source: county tax records.
Cash-flow waterfall
monthlySold comps — $/sqft
last 12 mo · ≤1 miLoading sold comps…