 🏷️ Likely Rental
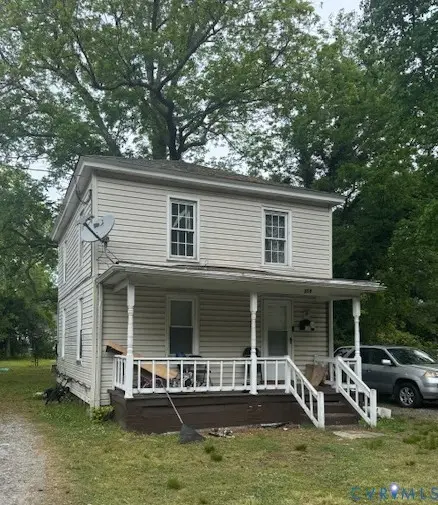
318 E Pinner St · Suffolk, VA
Flood risk No data
- FEMA flood zone
- —
- Chance of flooding over 30 yrs
- —
- Est. flood insurance / yr
- —
Fire risk No data
- Est. fire insurance / yr
- —
Heat risk No data
- Hot days now (above threshold)
- —
- Hot days in 30 yrs
- —
Wind risk No data
- Chance of severe wind over 30 yrs
- —
Air-quality risk No data
- Unhealthy air days now
- —
- Unhealthy air days in 30 yrs
- —
Risk factors via First Street. Map © Google.
Why this score? — see what drove the B+ grade
The composite is a weighted blend of 9 inputs, each scored 0–100. Each bar is that input's sub-score; the figure is the points it added to the 100-point composite (weight × sub-score).
- Cash flow +30.0/30.0
- ARV discount +15.0/15.0
- DSCR +10.0/10.0
- 1% rule +7.9/10.0
- Schools +4.8/10.0
- Rent growth +4.0/5.0
- Livability +3.9/5.0
- Condition / age +2.2/5.0
- Appreciation +0.0/10.0
$129,500
🖨 Deal sheet 📄 Offer letter ✓ Due diligence
Listing remarks
INVESTOR SPECIAL! Two-story rental property located in the heart of Suffolk with a long-term tenant already in place. The main level offers a comfortable living room, kitchen. Upstairs features two bedrooms and a full bath. Enjoy a classic front porch and easy-to-maintain layout. Tenant has been in place long-term, with the current lease running through December 2026—and they would love to stay. This is a turnkey opportunity for any investor seeking stable rental income in a desirable Suffolk location.
Key facts
- Classic front porch
- 7,405 sq ft lot
- Parking
Tags
Property features AI
Exterior
- Parking: Driveway parking; Off-street parking (unpaved)
- Utilities: Public water; Public sewer; Electric service
- Home design: 2-story frame home with vinyl siding; Shingle roof; Above grade finished area approximately 1,102; Built (actual year not specified)
- Construction: Frame construction with vinyl siding; Shingle roof
- Exterior features: Front porch; Unpaved driveway
Interior
- Bedrooms: Total of 5 rooms (includes bedrooms and living spaces); Half bath located on the first level; Full bath located on the first level
- Flooring: Linoleum; Partially carpeted
- Bathrooms: One full bathroom with tub and shower; One half bathroom on the first level
- Heating & cooling: Heat pump heating (electric); Central air conditioning
- Interior features: Partially carpeted and linoleum flooring; Tub and shower in full bathroom; Resale condition
- Laundry & utility: Electric water heater
Neighborhood map
What this means for you Summary
Snapshot
- This is a 2-bed/1.0-bath single-family listed at $130k. Condition is rated fair.
Deal economics
- At list price, monthly cash flow is $499 ($6k/yr) — positive.
- The deal already cash-flows at list — no discount required.
- Meets the 1% rule at list price ($2k rent vs $130k).
- Recommended offer: $126k (3.0% below list) — sets the bar for market timing.
- Cap rate 10.9% vs local median 3.5% in Suffolk — top-decile yield for the area; either an underpriced asset or a hidden risk that comps aren't pricing in. Stress-test before assuming the spread holds.
Location & tenants
- Location reads 77/100 on livability (#88 in VA, #2,896 nationally) — a middle-class / working-renter tenant base. Strengths: housing A+, health & safety A+, schools A; Watch: crime C-, commute F.
- Suffolk City Public School District (suburban): math 41% / reading 69% proficiency, ranked #72 of 131 in VA (top 55%) — acceptable for families but not a draw, mixed tenant base, ~2y average lease.
- Market conditions: Rents rising fast (+5.8%/yr); 536 active listings in the ZIP; 16 comparable units currently listed for rent nearby; rentals at typical pace (median 24d on market — plan ~3-4 weeks tenant-placement turnaround); solid renter incomes; 680 units permitted in Suffolk city in 2024 (0 in 5+ unit buildings).
Forward outlook
- Local home prices are declining (-3.0%/yr); year-one equity from $895 of loan paydown is wiped out by about $4k of value loss. Plan a longer hold.
- Suffolk County population projected at +11% by 2050 — modest demand growth; plan on rents tracking national, not racing it.
- At projected returns (-3.0% appreciation + 5.8% rent growth), your $36k cash investment doubles in ~7 years — after that, you're playing with house money.
Negotiation context
- It's been on market 45 days — a 3% lower offer ($126k) is reasonable based on typical stale-listing flexibility.
Risks & watch-outs
- Watch-outs: built in 1930 — expect roof / HVAC / electrical / plumbing capex.
Questions for the listing agent
- It's been on market 45 days. Have you received any prior offers? Is the seller open to a 3% concession, seller financing, or rate buy-down credit?
- Have any recent inspections been done? Can we get a copy of the seller's disclosures and any deferred-maintenance estimates?
- Built in 1930 — when were the roof, HVAC, electrical panel, plumbing, and water heater last replaced?
- Is there a deadline driving the sale (1031 exchange, divorce, estate, relocation)? That informs how much negotiation room exists.
- Schools are A-rated — typically a magnet for longer-tenancy family renters. What's the average tenant stay here, and is there a school-zone premium baked into asking?
- What's the average days-on-market for RENTAL listings here right now (not sales)? A rising rental-DOM trend means longer vacancies and softer asking-rent achievability than the comps imply.
- What's the recent tenant-quality profile in this submarket — average credit score on applications, eviction rate, late-payment / NSF rate, and stable-employment percentage? A property-management company in the area should have these aggregated.
- How much new for-sale + rental construction is in the pipeline within 1–3 miles? Heavy new supply typically softens prices + rents 12–24 months out; constrained supply supports both.
Investment metrics
- 1% rule
- 1.29% ✓
- Cap rate
- 10.92%
- Cash-on-cash
- 16.51%
- DSCR
- 1.73
- GRM
- 6.5
CMA / ARV
- ARV (median comp)
- $229,228
- List price
- $129,500
- Delta
- -43.51%
- Verdict
- UNDERPRICED
- Comps
- 20 within 1.0 mi
Show comp detail 12 sales within ~0.75 mi
| Address | Dist | Beds/Ba | Sqft | Sold | Price | $/sf | Match |
|---|---|---|---|---|---|---|---|
| 407 Henry St | 0.25mi | 3/1.0 (+1) | 1,147 (+4%) | 1mo | $209,000 | $182 | 76 |
| 341 N 5th St | 0.39mi | 3/1.0 (+1) | 1,100 (-0%) | 1mo | $220,000 | $200 | 76 |
| 210 Katherine St | 0.17mi | 3/1.0 (+1) | 1,027 (-7%) | 2mo | $249,000 | $242 | 74 |
| 421 Highland Ave | 0.14mi | 3/2.5 (+1) | 1,200 (+9%) | 0mo | $285,000 | $238 | 67 |
| 403 E Constance Rd | 0.19mi | 3/1.0 (+1) | 1,225 (+11%) | 7mo | $220,000 | $180 | 62 |
| 301 Goodman St | 0.57mi | 3/1.0 (+1) | 1,053 (-4%) | 1mo | $125,000 | $119 | 60 |
| 215 N Capital St | 0.60mi | 3/1.0 (+1) | 1,140 (+3%) | 2mo | $90,000 | $79 | 60 |
| 226 N 4th St | 0.60mi | 3/2.0 (+1) | 1,022 (-7%) | 2mo | $222,000 | $217 | 49 |
| 120 Oak St | 0.70mi | 3/1.0 (+1) | 1,200 (+9%) | 2mo | $189,500 | $158 | 46 |
| 200 N Capital St | 0.67mi | 3/2.0 (+1) | 1,184 (+7%) | 2mo | $253,000 | $214 | 46 |
| 111 Halifax St | 0.74mi | 3/2.5 (+1) | 1,200 (+9%) | 2mo | $274,900 | $229 | 38 |
| 108 N 6th St | 0.73mi | 3/2.0 (+1) | 1,224 (+11%) | 1mo | $246,200 | $201 | 38 |
Match score weights: distance 35% · size 25% · config 20% · recency 20%. Top-matched comps best support the ARV.
Projected returns pro-forma
-3.0% appreciation · 5.84% rent growth · sell at horizon
- IRR
- 10.6%
- Equity multiple
- 1.43×
- Total profit
- $15,659
- Equity at exit
- $19,309
- IRR
- 21.7%
- Equity multiple
- 3.09×
- Total profit
- $75,748
- Equity at exit
- $11,197
Cash invested: $36,260 (down + closing). Projections, not guarantees.
Landlord ↔ Tenant lean methodology
- Overall (STATE)
- 55 Moderately Landlord-Leaning
- State Virginia
- 55 Moderately Landlord-Leaning · D+2
- County
- — inherits STATE
- City
- — inherits STATE
ZIP-level market 23434
- Rents YoY
- 5.8%
- Active inventory
- 536
- Price-to-rent
- 6.5×
Monthly cashflow live
- Estimated rent
- $1,666 high interval (Pro) →
- Mortgage (P&I)
- −$679
- Tax from tax record
- −$84 /mo · $1,010/yr
- Insurance
- −$54
- HOA
- −$0
- Vacancy / Maint / Mgmt
- −$350
- Net cashflow
- $499
Break-even live
UW: 25.0% down · 7.5% · 30yr · 1.5% tax · 5.0% vac · 8.0% maint · 8.0% mgmt
Financing live
Cash to close
- Down payment
- $32,375
- Closing costs
- $3,885
- Reserves months
- —
- Total cash needed
- —
Loan-product check · same deal, 3 products live
Conventional
25% down · 7.5% · 30yr
- Down + closing
- —
- Monthly P&I
- —
- Monthly cashflow
- —
- DSCR
- —
- Eligible?
- —
Personal DTI + credit; lowest rate.
DSCR
20% down · 8.5% · 30yr
- Down + closing
- —
- Monthly P&I
- —
- Monthly cashflow
- —
- DSCR
- —
- Eligible?
- —
No personal income docs; deal must DSCR.
Hard money
10% down · 12.0% · 12mo
- Down + closing
- —
- Monthly P&I
- —
- Monthly cashflow
- —
- DSCR
- —
- Eligible?
- —
Short-term bridge; refi at stabilization.
Rent comps 16 comps
| Address | Beds | Baths | Sqft | Rent | $/sqft | DOM | Units | Dist |
|---|---|---|---|---|---|---|---|---|
| 307 Central Ave Suffolk, VA | 3.0 | 1.0 | 840 | $1,700 | $2.02 | 43d | 1 | 0.38mi |
| 223 N 7th St Suffolk, VA | 3.0 | 2.5 | 1495 | $2,300 | $1.54 | 43d | 1 | 0.65mi |
| 116 Franklin St Suffolk, VA | 3.0 | 1.0 | 1335 | $1,750 | $1.31 | 23d | 1 | 0.67mi |
| 116 Franklin St Unit 3 Suffolk, VA | 3.0 | 1.0 | 1335 | $1,750 | $1.31 | 43d | 1 | 0.67mi |
| 326 E Washington St Suffolk, VA | 2.0 | 2.0 | 839 | $1,629 | $1.94 | 3d | 1 | 0.68mi |
| 214 N 7th St Unit NA Suffolk, VA | 2.0 | 1.0 | 760 | $1,500 | $1.97 | 23d | 1 | 0.69mi |
| 181 N Main St Suffolk, VA | 2.0 | 1.0–2.0 | 804 | $1,885 | $2.34 | 1d | 15 | 0.70mi |
| 120 S 10th St Suffolk, VA | 2.0 | 1.0 | 736 | $1,250 | $1.70 | 43d | 1 | 0.88mi |
| 558 1st Ave Suffolk, VA | 2.0 | 1.5 | 1000 | $1,250 | $1.25 | 43d | 1 | 1.13mi |
| 564 1st Ave Suffolk, VA | 2.0 | 1.0 | 1000 | $1,100 | $1.10 | 43d | 1 | 1.14mi |
| 408 Wellons St Suffolk, VA | 1.0 | 1.0 | 750 | $1,486 | $1.98 | 1d | 3 | 1.20mi |
| 206 Reid's Place Dr Suffolk, VA | 3.0 | 2.5 | 1280 | $2,200 | $1.72 | 4d | 1 | 1.24mi |
| 308 Saint James Ave Unit B Suffolk, VA | 2.0 | 1.0 | 936 | $1,295 | $1.38 | 23d | 1 | 1.25mi |
| 206 Reid's Place Dr Unit 206 Suffolk, VA | 3.0 | 2.5 | 1280 | $2,300 | $1.80 | 17d | 1 | 1.27mi |
| 806 W Washington St Unit 112 Suffolk, VA | 2.0 | 2.0 | 900 | $1,325 | $1.47 | 17d | 1 | 1.35mi |
| 410 Bosley Ave Unit B Suffolk, VA | 2.0 | 1.0 | 850 | $1,095 | $1.29 | 10d | 1 | 1.46mi |
Listing history 13 events
-
2026-06-18days on market $129,500 Active 45 DOM
-
2026-06-17days on market $129,500 Active 44 DOM
-
2026-06-16days on market $129,500 Active 43 DOM
-
2026-06-15days on market $129,500 Active 42 DOM
-
2026-06-13days on market $129,500 Active 40 DOM
-
2026-06-09days on market $129,500 Active 36 DOM
-
2026-06-08days on market $129,500 Active 35 DOM
-
2026-06-07days on market $129,500 Active 34 DOM
-
2026-06-03days on market $129,500 Active 30 DOM
-
2026-06-02days on market $129,500 Active 29 DOM
-
2026-06-01days on market $129,500 Active 28 DOM
-
2026-05-31days on market $129,500 Active 27 DOM
-
2026-05-04$129,500 Active 516-char remark
ⓘ Source: listings_history table (triggers on properties + properties_extension) + one-shot
backfill from property_details.listing_events for pre-trigger history.
Tax reassessment forecast VA · Resets to sale price
- Current annual tax
- $1,010 · $84/mo
- Projected year-2 tax
- $1,062 · $88/mo
- Expected delta
- +$52/yr (+$4/mo · 5.1%)
ⓘ Screening estimate from a state-policy table — verify with the county assessor before closing.
Nearby sold comps map
Loading sold comps map…
Walkable amenities ~0.75 mi
Loading nearby amenities…
Taxation est. · year 1
- Rental income
- $19,991
- − Mortgage interest
- −$7,254
- − Property taxes
- −$1,010
- − Insurance
- −$648
- − Repairs & maintenance
- −$1,599
- − Management
- −$1,599
- − Depreciation
- −$3,767
- Taxable income
- $4,114
- Est. tax owed @ 24.0%
- −$987
- After-tax cash flow
- $4,999/yr
For passive investors: Depreciation is non-cash, so a rental often shows a tax loss while cash-flowing — sheltering income. Rental losses are passive: they offset passive income freely, and up to $25,000/yr can offset ordinary (W-2) income if you actively participate and your MAGI is under $100k (phasing out to $0 by $150k); unused losses carry forward. On sale, claimed depreciation is recaptured at up to 25%, and gains may owe capital-gains tax (a 1031 exchange can defer both). Figures are a year-1 estimate at your 24.0% rate — not tax advice; consult a CPA.
Condition & rehab AI · 3 photos
This two-story rental property in Suffolk, VA shows average condition with some wear and tear. Light repairs and maintenance, such as painting and landscaping, would significantly enhance its value and appeal to both buyers and renters.
Repairs flagged
- Minor Paint — Light discoloration on exterior and interior
- Minor Siding — Light wear and tear
Value-add opportunities
- Both Paint exterior and interior — Enhances curb appeal and interior aesthetics
- Both Landscaping — Improves curb appeal and enhances property value
Renovation cost estimate screening
| Repair item | Severity | Est. cost |
|---|---|---|
| Paint · Light discoloration on exterior and interior | Minor | $500–3,000 |
| Siding · Light wear and tear | Minor | $500–3,000 |
| Total estimated repair cost · 2 items | $1,000–6,000 |
Value-add ROI direction
- Both Paint exterior and interior — Enhances curb appeal and interior aesthetics ↑
- Both Landscaping — Improves curb appeal and enhances property value ↑
ⓘ Cost ranges are severity-bucket heuristics (US national rule-of-thumb). Get contractor quotes + a written scope before underwriting a rehab budget.
Schools (NCES district)
- District
- Suffolk City Public School District
- NCES district ID
- 5103710
- Math proficiency
- 41% ▼ -43.00%
- Reading proficiency
- 69% ▼ -8.00%
- Median HH income
- $65,573
- Composite
- 48.31/100
- National rank
- #2151
- State rank
- #72 of 131 in VA
Livability — Suffolk
- Score
- 77/100
- State rank
- #88
- US rank
- #2896
Category grades
Schools grade is shown separately in the Schools card above.
Census & demographics
- Census place
- Suffolk, VA
- County
- Suffolk City · 88,108 people
- City population
- 88,108
- Metro
- Virginia Beach-Norfolk-Newport News, VA-NC
- Population (ZIP)
- 54,387
- Household income
- $79,877
- Rent vs Own
- Severe rent burden
- 1934.0
Population outlook (Suffolk County) Hauer SSP2
- Today (2025)
- 95,269 people
- By 2030
- 98,269 · +3.1%
- By 2040
- 103,177 · +8.3%
- By 2050
- 105,777 · +11.0%
- By 2075
- 110,963 · +16.5%
- By 2100
- 103,711 · +8.9%
Race, ethnicity, and origin ACS 2023
- Neighborhood character
- Diverse neighborhood (Simpson 0.58)
- Race & ethnicity
- Black 49% White 41% Two or more races 5% Hispanic / Latino 4% Asian 1%
- Common ancestry
- Lithuanian 1% Slovak 1% Italian 1%
- Foreign-born
- 3% · Canada
- Languages at home
- 96% English-only · Spanish 2%
Political lean MEDSL · Suffolk
- 2024 margin
- D (+15.9) · D 57.4% · R 41.5% · Other 1.2%
- 2008→2024 swing
- +2.7pp toward D · 2008: 13.2pp · 2024: 15.9pp
- All cycles
- 2024: D+15.9 2020: D+17.3 2016: D+13.8 2012: D+15.1 2008: D+13.2
Not yet ingested
- Civics
- —
Market trends
- HPI YoY
- ▼ -383.80%
- Current HPI
- 158.5866
- Rent YoY
- ▲ 5.84%
- Metro
- Virginia Beach-Norfolk-Newport News, VA-NC
- State GDP YoY
- ▲ 2.40%
- F500 in state
- 50
Industry mix (Fortune 500 HQ in VA)
| Industry | F500 HQs | Revenue |
|---|---|---|
| Aerospace / Defense | 4 | $236B |
|
||
| Technology / Defense | 3 | $32B |
|
||
| Financial Services | 2 | $176B |
|
||
| Utilities | 2 | $27B |
|
||
| Insurance | 2 | $25B |
|
||
| Technology | 2 | $15B |
|
||
Price history
1 event — show timeline
- 2026-05-04 Listed $129,500 CVRMLS
Property tax history
+2.9%/yrLatest (2025): $1,010 · +2.5% YoY. Source: county tax records.
Cash-flow waterfall
monthlySold comps — $/sqft
last 12 mo · ≤1 miLoading sold comps…