11611 Sherwood Dr · Otsego Lake, MI
Flood risk 1/10 · Minimal
- FEMA flood zone
- —
- Chance of flooding over 30 yrs
- 0.0%
- Est. flood insurance / yr
- —
Fire risk 4/10 · Minor
- Est. fire insurance / yr
- $784 – $1,456
Heat risk 1/10 · Minimal
- Hot days now (above 93°F)
- 7 days/yr
- Hot days in 30 yrs
- 13 days/yr
Wind risk 1/10 · Minimal
- Chance of severe wind over 30 yrs
- —
Air-quality risk 1/10 · Minimal
- Unhealthy air days now
- 0 days/yr
- Unhealthy air days in 30 yrs
- 0 days/yr
Risk factors via First Street. Map © Google.
Why this score? — see what drove the D grade
The composite is a weighted blend of 9 inputs, each scored 0–100. Each bar is that input's sub-score; the figure is the points it added to the 100-point composite (weight × sub-score).
- Cash flow +10.8/30.0
- Appreciation +10.0/10.0
- Schools +4.1/10.0
- DSCR +3.1/10.0
- ARV discount +2.6/15.0
- Rent growth +2.5/5.0
- Livability +2.5/5.0
- Condition / age +2.5/5.0
- 1% rule +2.1/10.0
$122,000
🖨 Deal sheet 📄 Offer letter ✓ Due diligence
Listing remarks MLS
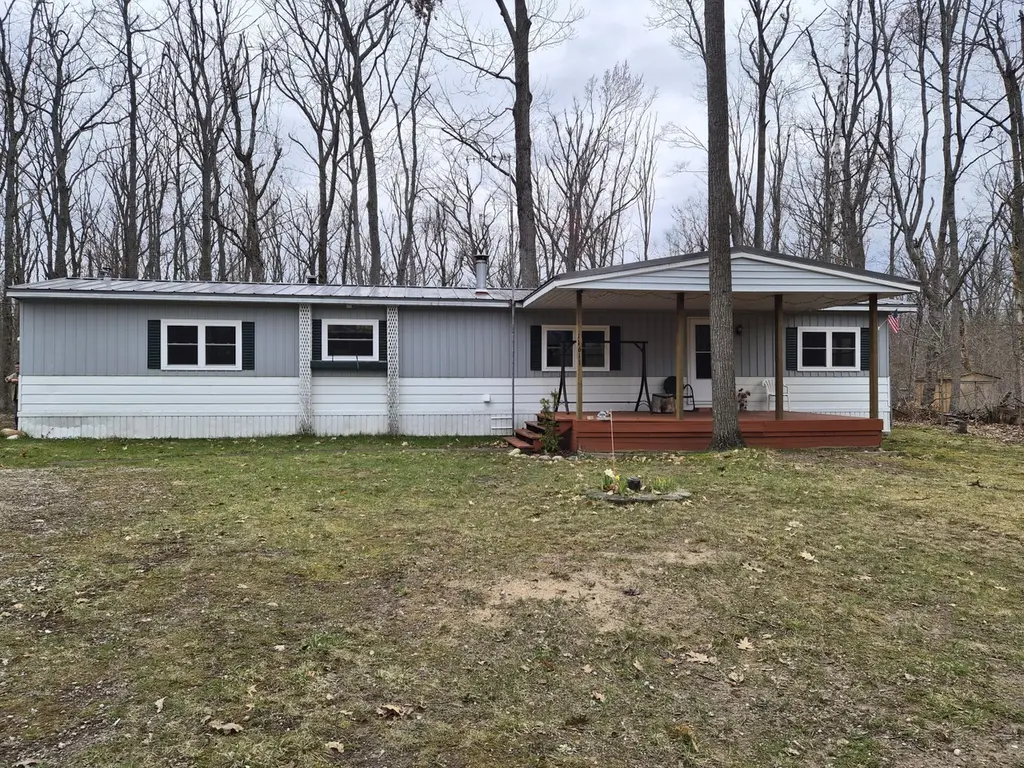
Nice big wooded lot in Guthrie Lakes Enchanted Forest association. 2 bed/2 bath mobile with detached garage, & all appliances included! Enjoy all the amenities - pool, clubhouse, lake access with great fishing. New windows & fencing in back yard. Nice big covered porch & the roof has been upgraded to metal. Great price for a great exclusive location. This is priced to sell quickly!
Key facts
- Covered porch
- Wooded lot
- Wood stove
Tags
Property features AI
Finance
- HOA & community: Homeowners association with annual fee
Exterior
- Parking: Detached 2-car garage
- Utilities: Well water; Septic tank; Cable available
- Home design: Single family residence; Residential property; Located in Enchanted Forest Subdivision
- Construction: Crawl space basement
- Exterior features: Deck; Shed(s); On waterfront (Guthrie Lake); Paved road access
Interior
- Kitchen: Refrigerator; Oven; Range; Microwave; Dishwasher
- Bathrooms: 2 full bathrooms
- Heating & cooling: Forced air heating; Oil heating; Wood heating; Wood stove; Ceiling fan(s) for cooling
- Interior features: Walk-in closet(s); Wood burning stove
- Laundry & utility: Washer; Dryer; Laundry on main level
Neighborhood map
What this means for you Summary
Snapshot
- This is a 2-bed/2.0-bath single-family listed at $122k.
Deal economics
- At list price, monthly cash flow is $-55 ($-658/yr) — negative.
- To cash-flow at today's rent, offer at most $112k (7.9% below list).
- To meet the 1% rule (rent ≥ 1% of price), the offer needs to be $87k (29.0% below list).
- Recommended offer: $87k (29.0% below list) — sets the bar for 1% rule.
Location & tenants
- Location reads: area grade D — affects rentability + tenant quality, not the cash-flow math above.
- Gaylord Community Schools (rural): math 43% / reading 53% proficiency, ranked #123 of 540 in MI (top 23%) — families likely to look elsewhere, expect single-tenant / working-renter base with shorter leases.
- Zoned schools: Gaylord High Schoolvoc Bldg (math 47% / reading 67%, grade C, #99 of 713 statewide, top 14%, 961 students, 43% FRL) — zoned schools at 43% FRL track the district average.
- Market conditions: 38 active listings in the ZIP; 24 units permitted in Otsego County in 2024 (0 in 5+ unit buildings).
Forward outlook
- In year one you build about $13k of equity ($843 loan paydown + $12k appreciation (10.0% local appreciation)).
- Otsego County population projected at -11% by 2050 — secular population decline; favor cash flow + early exit over multi-decade hold.
- At projected returns (10.0% appreciation + 3.0% rent growth), your $34k cash investment doubles in ~3 years — after that, you're playing with house money.
- By year 3, paydown + projected appreciation supports a ~$33k cash-out refi (75% LTV) — recoverable capital for the next deal without selling this one.
Negotiation context
- It's been on market 26 days — a 2% lower offer ($120k) is reasonable based on typical stale-listing flexibility.
- 2 sale attempts since 5y ago with the ask held roughly flat each time — persistent listings suggest the price (not the market) is what's stuck; bring a comps-based counter.
Questions for the listing agent
- What do current leases actually rent for vs. the listed asking? Can we see a recent rent roll and the last 12 months of T-12 income?
- Built in 1978 — when were the roof, HVAC, electrical panel, plumbing, and water heater last replaced?
- Is there a deadline driving the sale (1031 exchange, divorce, estate, relocation)? That informs how much negotiation room exists.
- The area grade is low — what's the realistic commute time and amenity access for the typical tenant pool here? Any planned neighborhood developments (good or bad) we should know about?
- What's the average days-on-market for RENTAL listings here right now (not sales)? A rising rental-DOM trend means longer vacancies and softer asking-rent achievability than the comps imply.
- What's the recent tenant-quality profile in this submarket — average credit score on applications, eviction rate, late-payment / NSF rate, and stable-employment percentage? A property-management company in the area should have these aggregated.
- How much new for-sale + rental construction is in the pipeline within 1–3 miles? Heavy new supply typically softens prices + rents 12–24 months out; constrained supply supports both.
Investment metrics
- 1% rule
- 0.71% ✗
- Cap rate
- 5.75%
- Cash-on-cash
- -1.93%
- DSCR
- 0.91
- GRM
- 11.7
CMA / ARV
- ARV (median comp)
- $110,000
- List price
- $122,000
- Delta
- 10.91%
- Verdict
- OVERPRICED
- Comps
- 3 within 1.0 mi
Show comp detail 1 sale within ~0.75 mi
| Address | Dist | Beds/Ba | Sqft | Sold | Price | $/sf | Match |
|---|---|---|---|---|---|---|---|
| 11611 Sherwood Dr | 0.00mi | 2/2.0 | 858 (0%) | 1mo | $110,000 | $128 | 100 |
Match score weights: distance 35% · size 25% · config 20% · recency 20%. Top-matched comps best support the ARV.
Projected returns pro-forma
10.0% appreciation · 3.0% rent growth · sell at horizon
- IRR
- 22.9%
- Equity multiple
- 2.84×
- Total profit
- $62,899
- Equity at exit
- $109,907
- IRR
- 20.4%
- Equity multiple
- 6.50×
- Total profit
- $187,873
- Equity at exit
- $237,019
Cash invested: $34,160 (down + closing). Projections, not guarantees.
Landlord ↔ Tenant lean methodology
- Overall (STATE)
- 62 Landlord-Friendly
- State Michigan
- 62 Landlord-Friendly · EVEN
- County
- — inherits STATE
- City
- — inherits STATE
ZIP-level market 49733
- Home prices YoY
- 3.7%
- Active inventory
- 38
- Price-to-rent
- 11.7×
Monthly cashflow live
- Estimated rent
- $866 medium interval (Pro) →
- Mortgage (P&I)
- −$640
- Tax from tax record
- −$48 /mo · $578/yr
- Insurance
- −$51
- HOA
- −$0
- Vacancy / Maint / Mgmt
- −$182
- Net cashflow
- $-55
Break-even live
UW: 25.0% down · 7.5% · 30yr · 1.5% tax · 5.0% vac · 8.0% maint · 8.0% mgmt
Financing live
Cash to close
- Down payment
- $30,500
- Closing costs
- $3,660
- Reserves months
- —
- Total cash needed
- —
Loan-product check · same deal, 3 products live
Conventional
25% down · 7.5% · 30yr
- Down + closing
- —
- Monthly P&I
- —
- Monthly cashflow
- —
- DSCR
- —
- Eligible?
- —
Personal DTI + credit; lowest rate.
DSCR
20% down · 8.5% · 30yr
- Down + closing
- —
- Monthly P&I
- —
- Monthly cashflow
- —
- DSCR
- —
- Eligible?
- —
No personal income docs; deal must DSCR.
Hard money
10% down · 12.0% · 12mo
- Down + closing
- —
- Monthly P&I
- —
- Monthly cashflow
- —
- DSCR
- —
- Eligible?
- —
Short-term bridge; refi at stabilization.
Listing history 9 events
-
2026-06-01status $122,000 Pending 26 DOM
-
2026-06-01days on market $122,000 Active Under Contract 26 DOM
-
2026-05-31days on market $122,000 Active Under Contract 25 DOM
-
2026-05-31days on market $122,000 Active Under Contract 24 DOM
-
2026-05-15historical Active Under Contract 828-char remark
-
2026-05-06$122,000 Active 828-char remark
-
2021-10-01soldstatus $55,000 402-char remark
Show marketing remark (402 chars)
Nice big wooded lot in Guthrie Lakes Enchanted Forest association. 2 bed/2 bath mobile with detached garage, & all appliances included! Enjoy all the amenities - pool, clubhouse, lake access with great fishing. New windows & fencing in back yard. Nice big covered porch & the roof has been upgraded to metal. Great price for a great exclusive location. This is priced to sell quickly!
-
2021-09-05$65,000 402-char remark
Show marketing remark (402 chars)
Nice big wooded lot in Guthrie Lakes Enchanted Forest association. 2 bed/2 bath mobile with detached garage, & all appliances included! Enjoy all the amenities - pool, clubhouse, lake access with great fishing. New windows & fencing in back yard. Nice big covered porch & the roof has been upgraded to metal. Great price for a great exclusive location. This is priced to sell quickly!
-
2013-10-29soldstatus $32,900
ⓘ Source: listings_history table (triggers on properties + properties_extension) + one-shot
backfill from property_details.listing_events for pre-trigger history.
Tax reassessment forecast MI · Partial reset (capped growth)
- Current annual tax
- $578 · $48/mo
- Projected year-2 tax
- $1,228 · $102/mo
- Expected delta
- +$650/yr (+$54/mo · 112.6%)
ⓘ Screening estimate from a state-policy table — verify with the county assessor before closing.
Climate risk First Street
- Flood 1/10 Low 0% chance over 30 yrs
- Wildfire 4/10 Moderate
- Heat 1/10 Low 7 d/yr ≥93°F today · 13 d/yr by 30 yrs out
- Wind 1/10 Low
- Air quality 1/10 Low 0 unhealthy d/yr today · 0 by 30 yrs out
Nearby sold comps map
Loading sold comps map…
Walkable amenities ~0.75 mi
Loading nearby amenities…
Taxation est. · year 1
- Rental income
- $10,388
- − Mortgage interest
- −$6,834
- − Property taxes
- −$578
- − Insurance
- −$610
- − Repairs & maintenance
- −$831
- − Management
- −$831
- − Depreciation
- −$3,549
- Taxable loss
- −$2,845
- Est. tax savings @ 24.0%
- +$683
- After-tax cash flow
- $24/yr
For passive investors: Depreciation is non-cash, so a rental often shows a tax loss while cash-flowing — sheltering income. Rental losses are passive: they offset passive income freely, and up to $25,000/yr can offset ordinary (W-2) income if you actively participate and your MAGI is under $100k (phasing out to $0 by $150k); unused losses carry forward. On sale, claimed depreciation is recaptured at up to 25%, and gains may owe capital-gains tax (a 1031 exchange can defer both). Figures are a year-1 estimate at your 24.0% rate — not tax advice; consult a CPA.
Schools (NCES district)
- District
- Gaylord Community Schools
- NCES district ID
- 2615730
- Math proficiency
- 43% ▼ -5.00%
- Reading proficiency
- 53% ▼ -5.00%
- Median HH income
- $48,682
- Composite
- 40.97/100
- National rank
- #3597
- State rank
- #123 of 540 in MI
Livability — Otsego Lake
No livability data for this city. (Only ~50 U.S. cities are tracked.)
Census & demographics
- Population (ZIP)
- 1,910
Population outlook (Otsego County) Hauer SSP2
- Today (2025)
- 24,175 people
- By 2030
- 23,836 · -1.4%
- By 2040
- 22,718 · -6.0%
- By 2050
- 21,411 · -11.4%
- By 2075
- 18,864 · -22.0%
- By 2100
- 15,011 · -37.9%
Race, ethnicity, and origin ACS 2023
- Neighborhood character
- Predominantly White (94%)
- Race & ethnicity
- White 94% Two or more races 4% Hispanic / Latino 2% Asian 1%
- Common ancestry
- Romanian 8% Lithuanian 5% Iranian 3%
- Foreign-born
- 2% · Vietnam, Canada
- Languages at home
- 99% English-only · Spanish 1%
Political lean MEDSL · Otsego
- 2024 margin
- Solid R (+35.3) · D 31.6% · R 67.0% · Other 1.4%
- 2008→2024 swing
- -26.5pp toward R · 2008: -8.9pp · 2024: -35.3pp
- All cycles
- 2024: R+35.3 2020: R+34.1 2016: R+37.6 2012: R+19.7 2008: R+8.9
Not yet ingested
- Civics
- —
Market trends
- HPI YoY
- ▲ 10.47%
- Current HPI
- 291.6348
- Rent YoY
- —
- Metro
- —
- State GDP YoY
- ▲ 1.37%
- F500 in state
- 28
Industry mix (Fortune 500 HQ in MI)
| Industry | F500 HQs | Revenue |
|---|---|---|
| Automotive Parts | 3 | $48B |
|
||
| Automotive | 2 | $372B |
|
||
| Chemicals | 1 | $45B |
|
||
| Automotive Retail | 1 | $29B |
|
||
| Healthcare / Medical Devices | 1 | $23B |
|
||
| Automotive Technology | 1 | $20B |
|
||
Price history
+234.3% since first listed7 events — show timeline
- 2026-06-02 Sold (MLS) $110,000 WWMLS
- 2026-06-01 Pending — WWMLS
- 2026-05-15 Contingent — WWMLS
- 2026-05-06 Listed $122,000 WWMLS
- 2021-10-01 Sold (MLS) $55,000 WWMLS
- 2021-09-05 Listed $65,000 WWMLS
- 2013-10-29 Sold (Public Records) $32,900 Public Records
Property tax history
+6.8%/yrLatest (2025): $578 · -22.9% YoY. Source: county tax records.
Cash-flow waterfall
monthlySold comps — $/sqft
last 12 mo · ≤1 miLoading sold comps…