 🏗️ New Construction
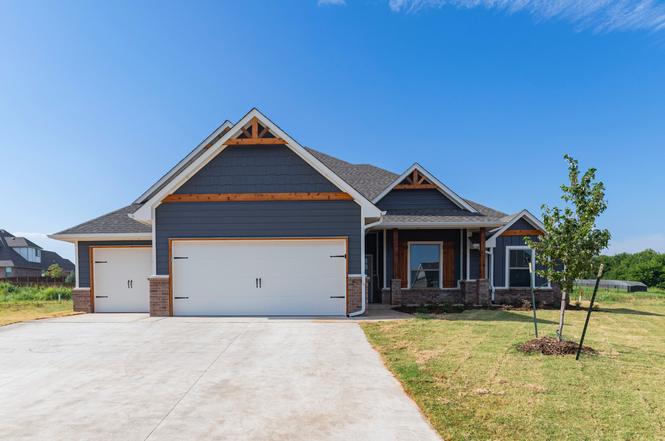
Cornerstone Bonus Room 2 Plan · Edmond, OK
Flood risk No data
- FEMA flood zone
- —
- Chance of flooding over 30 yrs
- —
- Est. flood insurance / yr
- —
Fire risk No data
- Est. fire insurance / yr
- —
Heat risk No data
- Hot days now (above threshold)
- —
- Hot days in 30 yrs
- —
Wind risk No data
- Chance of severe wind over 30 yrs
- —
Air-quality risk No data
- Unhealthy air days now
- —
- Unhealthy air days in 30 yrs
- —
Risk factors via First Street. Map © Google.
Why this score? — see what drove the D grade
The composite is a weighted blend of 9 inputs, each scored 0–100. Each bar is that input's sub-score; the figure is the points it added to the 100-point composite (weight × sub-score).
- Appreciation +10.0/10.0
- Cash flow +7.6/30.0
- ARV discount +7.5/15.0
- Livability +3.9/5.0
- Schools +3.6/10.0
- Rent growth +2.5/5.0
- Condition / age +2.5/5.0
- 1% rule +2.3/10.0
- DSCR +1.7/10.0
$562,840
🖨 Deal sheet (PDF) 📄 Offer letter ✓ Due diligence
Listing remarks
This Cornerstone Bonus Room 2 floor plan includes 3,080 Sq Ft of total living space, which includes 2,800 Sq Ft of indoor living space and 280 Sq Ft of outdoor living space. There is also a 630 Sq Ft, three car garage. This home offers so much more than the second-floor addition. We expanded one of Homes by Taber's most sought-after designs, adding 600 square feet of indoor living space and enlarging both the front porch and garage, while keeping the uniqueness of the exterior. The open floor plan features an expansive area under ten-foot ceilings where you can create spaces for any purpose-like a library, homework station, studio, or play area-and still keep your formal and casual dining r
Key facts
- Open floor plan
- Three car garage
- Gas fireplace
Tags
Property features AI
Finance
- Financial info: List price available (active listing)
Exterior
- Utilities: Natural gas; Central air
- Home design: Single-family plan with bonus room (Cornerstone Bonus Room 2)
- Construction: New construction (plan); Living area approximately 2800
- Exterior features: Addressed in Arcadia, OK (73007)
Interior
- Bedrooms: 4 bedrooms
- Bathrooms: 3 full bathrooms
- Heating & cooling: Natural gas forced-air heating; Central air conditioning
- Interior features: Plan: Cornerstone Bonus Room 2 (new construction plan)
Neighborhood map
What this means for you Summary
Snapshot
- This is a 4-bed/3.0-bath single-family listed at $563k.
Deal economics
- At list price, monthly cash flow is $-652 ($-8k/yr) — negative.
- To cash-flow at today's rent, offer at most $457k (18.8% below list).
- To meet the 1% rule (rent ≥ 1% of price), the offer needs to be $400k (28.9% below list).
- Recommended offer: $400k (28.9% below list) — sets the bar for 1% rule.
- Cap rate 4.9% vs local median 3.4% in Edmond — top-decile yield for the area; either an underpriced asset or a hidden risk that comps aren't pricing in. Stress-test before assuming the spread holds.
Location & tenants
- Location reads 78/100 on livability (#6 in OK, #2,383 nationally) — a middle-class / working-renter tenant base. Strengths: employment A+, housing A+, schools A-; Watch: health & safety C-, commute F.
- Edmond (suburban): math 38% / reading 40% proficiency, ranked #11 of 270 in OK (top 4%) — families likely to look elsewhere, expect single-tenant / working-renter base with shorter leases.
- Market conditions: 192 active listings in the ZIP; 1 comparable units currently listed for rent nearby; 5,365 units permitted in Oklahoma County in 2024 (569 in 5+ unit buildings).
Forward outlook
- In year one you build about $59k of equity ($4k loan paydown + $55k appreciation (10.0% local appreciation)).
- Oklahoma County population projected at +41% by 2050 — long-run rental-demand tailwind backs the buy-and-hold thesis.
- By year 2, paydown + projected appreciation supports a ~$95k cash-out refi (75% LTV) — recoverable capital for the next deal without selling this one.
Negotiation context
- It's been on market 269 days — a 12% lower offer ($495k) is reasonable based on typical stale-listing flexibility.
Questions for the listing agent
- What do current leases actually rent for vs. the listed asking? Can we see a recent rent roll and the last 12 months of T-12 income?
- It's been on market 269 days. Have you received any prior offers? Is the seller open to a 29% concession, seller financing, or rate buy-down credit?
- Why hasn't it sold? Are there any deal-killer items the seller is aware of (foundation, flood, title, zoning, code violations)?
- Is there a deadline driving the sale (1031 exchange, divorce, estate, relocation)? That informs how much negotiation room exists.
- Schools are A-rated — typically a magnet for longer-tenancy family renters. What's the average tenant stay here, and is there a school-zone premium baked into asking?
- The area grade is low — what's the realistic commute time and amenity access for the typical tenant pool here? Any planned neighborhood developments (good or bad) we should know about?
- What's the average days-on-market for RENTAL listings here right now (not sales)? A rising rental-DOM trend means longer vacancies and softer asking-rent achievability than the comps imply.
- What's the recent tenant-quality profile in this submarket — average credit score on applications, eviction rate, late-payment / NSF rate, and stable-employment percentage? A property-management company in the area should have these aggregated.
- How much new for-sale + rental construction is in the pipeline within 1–3 miles? Heavy new supply typically softens prices + rents 12–24 months out; constrained supply supports both.
Investment metrics
- 1% rule
- 0.73% ✗
- Cap rate
- 4.87%
- Cash-on-cash
- -5.07%
- DSCR
- 0.77
- GRM
- 11.5
CMA / ARV
- ARV (on-the-fly)
- $551,600
- Comps found
- 12
Show comp detail 12 sales within ~0.75 mi
| Address | Dist | Beds/Ba | Sqft | Sold | Price | $/sf | Match |
|---|---|---|---|---|---|---|---|
| 5316 Braavos Way | 0.24mi | 4/3.0 | 2,850 (+2%) | 1mo | $593,340 | $208 | 85 |
| 5001 Braavos Way | 0.30mi | 4/3.0 | 2,800 (0%) | 2mo | $529,000 | $189 | 84 |
| 5400 Braavos Way | 0.22mi | 5/3.0 (+1) | 2,950 (+5%) | 3mo | $582,340 | $197 | 73 |
| 5009 Sunspear Dr | 0.28mi | 4/3.0 | 2,640 (-6%) | 8mo | $450,000 | $170 | 71 |
| 8700 Stark St | 0.03mi | 5/3.0 (+1) | 2,530 (-10%) | 8mo | $495,000 | $196 | 71 |
| 8817 Arya Rd | 0.28mi | 4/3.0 | 2,624 (-6%) | 9mo | $502,500 | $192 | 69 |
| 5216 Braavos Way | 0.25mi | 4/3.0 | 2,450 (-12%) | 1mo | $533,000 | $218 | 67 |
| 5408 Braavos Way | 0.22mi | 5/3.0 (+1) | 2,520 (-10%) | 2mo | $543,840 | $216 | 66 |
| 6025 Lindberg Ln | 0.58mi | 4/3.5 | 2,870 (+2%) | 7mo | $637,500 | $222 | 61 |
| 8217 Grass Creek Dr | 0.71mi | 4/3.0 | 2,829 (+1%) | 6mo | $555,000 | $196 | 60 |
| 4900 Sunspear Dr | 0.37mi | 4/3.5 | 3,146 (+12%) | 10mo | $560,000 | $178 | 52 |
| 8624 Grey Wind Way | 0.46mi | 4/2.5 | 2,450 (-12%) | 11mo | $499,000 | $204 | 46 |
Match score weights: distance 35% · size 25% · config 20% · recency 20%. Top-matched comps best support the ARV.
Projected returns pro-forma
10.0% appreciation · 3.0% rent growth · sell at horizon
- IRR
- 20.7%
- Equity multiple
- 2.68×
- Total profit
- $258,951
- Equity at exit
- $496,925
- IRR
- 18.8%
- Equity multiple
- 6.15×
- Total profit
- $795,344
- Equity at exit
- $1,071,637
Cash invested: $154,448 (down + closing). Projections, not guarantees.
Landlord ↔ Tenant lean methodology
- Overall (STATE)
- 83 Strongly Landlord-Friendly
- State Oklahoma
- 83 Strongly Landlord-Friendly · R+20
- County
- — inherits STATE
- City
- — inherits STATE
ZIP-level market 73007
- Home prices YoY
- 4.0%
- Active inventory
- 192
- Price-to-rent
- 11.7×
Monthly cashflow live
- Estimated rent
- $4,000 medium interval (Pro) →
- Mortgage (P&I)
- −$2,893
- Tax est. 1.5%
- −$690 /mo · $8,274/yr
- Insurance
- −$230
- HOA
- −$0
- Vacancy / Maint / Mgmt
- −$840
- Net cashflow
- $-652
Break-even live
Sensitivity live
| Price | -10% $-271 | -5% $-461 | +0% $-652 | +5% $-843 | +10% $-1,033 |
|---|---|---|---|---|---|
| Rent | -10% $-968 | -5% $-810 | +0% $-652 | +5% $-494 | +10% $-336 |
| Rate | -1.0pp $-374 | -0.5pp $-512 | base $-652 | +0.5pp $-795 | +1.0pp $-940 |
UW: 25.0% down · 7.5% · 30yr · 1.5% tax · 5.0% vac · 8.0% maint · 8.0% mgmt
Financing live
Cash to close
- Down payment
- $137,900
- Closing costs
- $16,548
- Reserves months
- —
- Total cash needed
- —
Loan-product check · same deal, 3 products live
Conventional
25% down · 7.5% · 30yr
- Down + closing
- —
- Monthly P&I
- —
- Monthly cashflow
- —
- DSCR
- —
- Eligible?
- —
Personal DTI + credit; lowest rate.
DSCR
20% down · 8.5% · 30yr
- Down + closing
- —
- Monthly P&I
- —
- Monthly cashflow
- —
- DSCR
- —
- Eligible?
- —
No personal income docs; deal must DSCR.
Hard money
10% down · 12.0% · 12mo
- Down + closing
- —
- Monthly P&I
- —
- Monthly cashflow
- —
- DSCR
- —
- Eligible?
- —
Short-term bridge; refi at stabilization.
Rent comps 1 comps
| Address | Beds | Baths | Sqft | Rent | $/sqft | DOM | Units | Dist |
|---|---|---|---|---|---|---|---|---|
| 7901 Behr Dr Edmond, OK | 5.0 | 4.0 | 2829 | $4,000 | $1.41 | 21d | 1 | 0.97mi |
Listing history 13 events
-
2026-06-21days on market $562,840 Active 269 DOM
-
2026-06-18days on market $562,840 Active 266 DOM
-
2026-06-17days on market $562,840 Active 265 DOM
-
2026-06-16days on market $562,840 Active 264 DOM
-
2026-06-15days on market $562,840 Active 263 DOM
-
2026-06-13days on market $562,840 Active 261 DOM
-
2026-06-09days on market $562,840 Active 257 DOM
-
2026-06-08days on market $562,840 Active 256 DOM
-
2026-06-07days on market $562,840 Active 255 DOM
-
2026-06-03days on market $562,840 Active 251 DOM
-
2026-06-02days on market $562,840 Active 250 DOM
-
2026-06-01days on market $562,840 Active 249 DOM
-
2026-05-31days on market $562,840 Active 248 DOM
ⓘ Source: listings_history table (triggers on properties + properties_extension) + one-shot
backfill from property_details.listing_events for pre-trigger history.
Nearby sold comps map
Loading sold comps map…
Walkable amenities ~0.75 mi
Loading nearby amenities…
Taxation est. · year 1
- Rental income
- $48,000
- − Mortgage interest
- −$30,898
- − Property taxes
- −$8,274
- − Insurance
- −$2,758
- − Repairs & maintenance
- −$3,840
- − Management
- −$3,840
- − Depreciation
- −$16,047
- Taxable loss
- −$17,657
- Est. tax savings @ 24.0%
- +$4,238
- After-tax cash flow
- $-3,586/yr
For passive investors: Depreciation is non-cash, so a rental often shows a tax loss while cash-flowing — sheltering income. Rental losses are passive: they offset passive income freely, and up to $25,000/yr can offset ordinary (W-2) income if you actively participate and your MAGI is under $100k (phasing out to $0 by $150k); unused losses carry forward. On sale, claimed depreciation is recaptured at up to 25%, and gains may owe capital-gains tax (a 1031 exchange can defer both). Figures are a year-1 estimate at your 24.0% rate — not tax advice; consult a CPA.
Schools (NCES district)
- District
- Edmond
- NCES district ID
- 4010590
- Math proficiency
- 38% ▼ -12.00%
- Reading proficiency
- 40% ▼ -12.00%
- Median HH income
- $73,212
- Composite
- 35.88/100
- National rank
- #4814
- State rank
- #11 of 270 in OK
Livability — Edmond
- Score
- 78/100
- State rank
- #6
- US rank
- #2383
Category grades
Schools grade is shown separately in the Schools card above.
Census & demographics
- Census place
- Edmond, OK
- City population
- 177,083
- Population (ZIP)
- 2,945
Population outlook (Oklahoma County) Hauer SSP2
- Today (2025)
- 911,875 people
- By 2030
- 982,413 · +7.7%
- By 2040
- 1,130,468 · +24.0%
- By 2050
- 1,288,422 · +41.3%
- By 2075
- 1,711,482 · +87.7%
- By 2100
- 2,088,448 · +129.0%
Race, ethnicity, and origin ACS 2023
- Neighborhood character
- Predominantly White (80%)
- Race & ethnicity
- White 80% Two or more races 15% Hispanic / Latino 5% Black 2%
- Common ancestry
- Lithuanian 5% Romanian 3% Italian 2%
- Foreign-born
- 2% · Canada
- Languages at home
- 94% English-only · Spanish 2% Other Asian/Pacific 1%
Political lean MEDSL · Oklahoma
- 2024 margin
- Toss-up / Even · D 48.0% · R 49.7% · Other 2.3%
- 2008→2024 swing
- +15.1pp toward D · 2008: -16.8pp · 2024: -1.7pp
- All cycles
- 2024: R+1.7 2020: R+1.1 2016: R+10.5 2012: R+16.7 2008: R+16.8
Not yet ingested
- Civics
- —
Market trends
- HPI YoY
- ▲ 12.99%
- Current HPI
- 336.6015
- Rent YoY
- —
- Metro
- —
- State GDP YoY
- ▲ 1.55%
- F500 in state
- 6
Industry mix (Fortune 500 HQ in OK)
| Industry | F500 HQs | Revenue |
|---|---|---|
| Energy | 3 | $48B |
|
||
Cash-flow waterfall
monthlySold comps — $/sqft
last 12 mo · ≤1 miLoading sold comps…