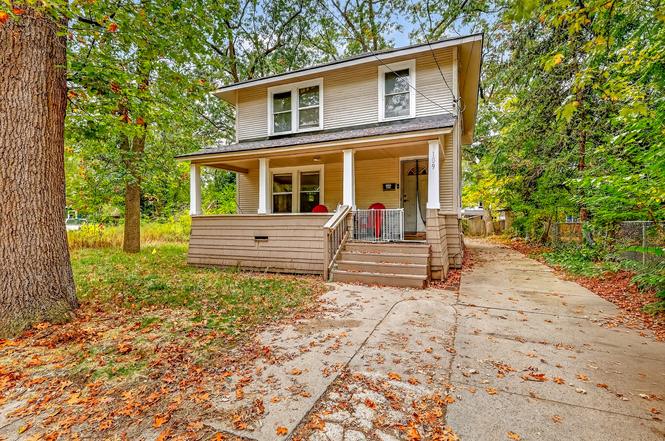
3109 Fifth St · Muskegon Heights, MI
Flood risk 1/10 · Minimal
- FEMA flood zone
- X (unshaded)
- Chance of flooding over 30 yrs
- 0.0%
- Est. flood insurance / yr
- $473 – $860
Fire risk 1/10 · Minimal
- Est. fire insurance / yr
- $784 – $1,456
Heat risk 1/10 · Minimal
- Hot days now (above 93°F)
- 7 days/yr
- Hot days in 30 yrs
- 14 days/yr
Wind risk 1/10 · Minimal
- Chance of severe wind over 30 yrs
- —
Air-quality risk 4/10 · Minor
- Unhealthy air days now
- 4 days/yr
- Unhealthy air days in 30 yrs
- 6 days/yr
Risk factors via First Street. Map © Google.
Why this score? — see what drove the C+ grade
The composite is a weighted blend of 9 inputs, each scored 0–100. Each bar is that input's sub-score; the figure is the points it added to the 100-point composite (weight × sub-score).
- Cash flow +24.8/30.0
- ARV discount +8.6/15.0
- DSCR +8.0/10.0
- 1% rule +5.9/10.0
- Schools +5.0/10.0
- Livability +3.1/5.0
- Rent growth +2.5/5.0
- Condition / age +2.5/5.0
- Appreciation +0.0/10.0
$150,000
🖨 Deal sheet 📄 Offer letter ✓ Due diligence
Listing remarks MLS
4-bedroom, 1.5-bath traditional home with recent updates throughout! Enjoy newer interior paint, flooring, carpet, furnace, water heater, plumbing, and fixtures. The exterior has been freshly painted, giving the home a clean, modern look. Spacious layout, fenced backyard, and is conveniently located near local amenities
Key facts
- Fenced backyard
- Newer interior paint
- 6,534 sq ft lot
Tags
Property features AI
Exterior
- Utilities: Public water; Natural gas available and connected; Electricity available; Cable connected; High-speed internet available
- Home design: Traditional-style single family home; 1,536 sq ft living area; Built in 1925
- Construction: Wood siding construction; Composition shingle roof
- Exterior features: Sidewalk; Paved road access
Interior
- Kitchen: Microwave; Range; Refrigerator
- Bathrooms: 1 full bathroom; 1 half bathroom
- Heating & cooling: Forced air heating; Heating available
- Interior features: 10 total rooms; Full basement
Neighborhood map
What this means for you Summary
Snapshot
- This is a 4-bed/1.5-bath single-family listed at $150k.
Deal economics
- At list price, monthly cash flow is $317 ($4k/yr) — positive.
- The deal already cash-flows at list — no discount required.
- Meets the 1% rule at list price ($2k rent vs $150k).
- Recommended offer: $132k (12.0% below list) — sets the bar for market timing.
Location & tenants
- Location reads 61/100 on livability (#574 in MI) — a middle-class / working-renter tenant base. Strengths: cost of living A+, housing A; Watch: schools D+, crime F, amenities F.
- Market conditions: 237 active listings in the ZIP; 438 units permitted in Muskegon County in 2024 (115 in 5+ unit buildings).
- This rent runs 37% of the median local income ($53k/yr) — at the standard rent-burdened threshold; future hikes will face affordability resistance.
Forward outlook
- Local home prices are declining (-3.0%/yr); year-one equity from $1k of loan paydown is wiped out by about $4k of value loss. Plan a longer hold.
- Muskegon County population projected to shrink 8% by 2050 — rents likely to lag national; underwrite the cash flow, not the appreciation.
Negotiation context
- It's been on market 238 days — a 12% lower offer ($132k) is reasonable based on typical stale-listing flexibility.
- 25 sale attempts since 28y ago; this cycle's ask has dropped $15k (9%) from the opening price — seller is motivated, your offer sets the floor, not the list.
- Current owner paid $127k; 18% above their basis — modest negotiation headroom, anchor on the comps not their cost.
Risks & watch-outs
- Watch-outs: built in 1925 — expect roof / HVAC / electrical / plumbing capex.
Questions for the listing agent
- It's been on market 238 days. Have you received any prior offers? Is the seller open to a 12% concession, seller financing, or rate buy-down credit?
- Built in 1925 — when were the roof, HVAC, electrical panel, plumbing, and water heater last replaced?
- Why hasn't it sold? Are there any deal-killer items the seller is aware of (foundation, flood, title, zoning, code violations)?
- Is there a deadline driving the sale (1031 exchange, divorce, estate, relocation)? That informs how much negotiation room exists.
- Schools are D-rated, which usually means shorter tenancies and higher turnover. Who's the typical renter profile here, and what's been the actual vacancy rate?
- Crime grade is F in this area — have there been break-ins, vandalism, or insurance claims at this property in the last 3 years? What carrier currently insures it and at what premium?
- What's the average days-on-market for RENTAL listings here right now (not sales)? A rising rental-DOM trend means longer vacancies and softer asking-rent achievability than the comps imply.
- What's the recent tenant-quality profile in this submarket — average credit score on applications, eviction rate, late-payment / NSF rate, and stable-employment percentage? A property-management company in the area should have these aggregated.
- How much new for-sale + rental construction is in the pipeline within 1–3 miles? Heavy new supply typically softens prices + rents 12–24 months out; constrained supply supports both.
Investment metrics
- 1% rule
- 1.09% ✓
- Cap rate
- 8.83%
- Cash-on-cash
- 9.07%
- DSCR
- 1.40
- GRM
- 7.7
CMA / ARV
- ARV (on-the-fly)
- $153,600
- Comps found
- 12
Show comp detail 12 sales within ~0.75 mi
| Address | Dist | Beds/Ba | Sqft | Sold | Price | $/sf | Match |
|---|---|---|---|---|---|---|---|
| 3201 6th St | 0.10mi | 5/2.0 (+1) | 1,614 (+5%) | 1mo | $99,000 | $61 | 79 |
| 3133 Glendale St | 0.08mi | 4/2.0 | 1,386 (-10%) | 10mo | $40,000 | $29 | 70 |
| 3333 5th St | 0.27mi | 3/1.5 (-1) | 1,600 (+4%) | 10mo | $63,000 | $39 | 68 |
| 3136 Glendale St | 0.10mi | 4/1.5 | 1,312 (-15%) | 4mo | $131,000 | $100 | 67 |
| 3014 Highland St | 0.15mi | 3/1.0 (-1) | 1,404 (-9%) | 7mo | $125,000 | $89 | 66 |
| 3309 Baker St | 0.37mi | 3/2.0 (-1) | 1,610 (+5%) | 6mo | $144,900 | $90 | 62 |
| 142 First Ave | 0.71mi | 4/1.0 | 1,507 (-2%) | 4mo | $239,900 | $159 | 58 |
| 3332 Mona St | 0.38mi | 4/1.5 | 1,332 (-13%) | 2mo | $145,000 | $109 | 58 |
| 3213 Mona St | 0.31mi | 3/1.0 (-1) | 1,349 (-12%) | 0mo | $145,000 | $107 | 58 |
| 26 W Maplewood Ave | 0.33mi | 3/2.0 (-1) | 1,344 (-12%) | 4mo | $101,000 | $75 | 54 |
| 2918 Mason Blvd | 0.66mi | 3/1.5 (-1) | 1,344 (-12%) | 0mo | $159,900 | $119 | 43 |
| 2616 7th St | 0.57mi | 3/2.0 (-1) | 1,370 (-11%) | 7mo | $168,000 | $123 | 42 |
Match score weights: distance 35% · size 25% · config 20% · recency 20%. Top-matched comps best support the ARV.
Projected returns pro-forma
-3.0% appreciation · 3.0% rent growth · sell at horizon
- IRR
- -2.6%
- Equity multiple
- 0.90×
- Total profit
- $-4,105
- Equity at exit
- $22,365
- IRR
- 7.1%
- Equity multiple
- 1.53×
- Total profit
- $22,395
- Equity at exit
- $12,969
Cash invested: $42,000 (down + closing). Projections, not guarantees.
Landlord ↔ Tenant lean methodology
- Overall (STATE)
- 62 Landlord-Friendly
- State Michigan
- 62 Landlord-Friendly · EVEN
- County
- — inherits STATE
- City
- — inherits STATE
ZIP-level market 49444
- Active inventory
- 237
- Price-to-rent
- 7.7×
Monthly cashflow live
- Estimated rent
- $1,631 medium interval (Pro) →
- Mortgage (P&I)
- −$787
- Tax from tax record
- −$122 /mo · $1,460/yr
- Insurance
- −$62
- HOA
- −$0
- Vacancy / Maint / Mgmt
- −$342
- Net cashflow
- $317
Break-even live
UW: 25.0% down · 7.5% · 30yr · 1.5% tax · 5.0% vac · 8.0% maint · 8.0% mgmt
Financing live
Cash to close
- Down payment
- $37,500
- Closing costs
- $4,500
- Reserves months
- —
- Total cash needed
- —
Loan-product check · same deal, 3 products live
Conventional
25% down · 7.5% · 30yr
- Down + closing
- —
- Monthly P&I
- —
- Monthly cashflow
- —
- DSCR
- —
- Eligible?
- —
Personal DTI + credit; lowest rate.
DSCR
20% down · 8.5% · 30yr
- Down + closing
- —
- Monthly P&I
- —
- Monthly cashflow
- —
- DSCR
- —
- Eligible?
- —
No personal income docs; deal must DSCR.
Hard money
10% down · 12.0% · 12mo
- Down + closing
- —
- Monthly P&I
- —
- Monthly cashflow
- —
- DSCR
- —
- Eligible?
- —
Short-term bridge; refi at stabilization.
Listing history 50 events
-
2026-06-09status $150,000 Pending 238 DOM
-
2026-06-08days on market $150,000 Active 238 DOM
-
2026-06-07days on market $150,000 Active 237 DOM
-
2026-06-02days on market $150,000 Active 232 DOM
-
2026-06-01days on market $150,000 Active 231 DOM
-
2026-05-31days on market $150,000 Active 230 DOM
-
2026-05-30days on market $150,000 Active 229 DOM
-
2026-02-11price $150,000 321-char remark
Show marketing remark (321 chars)
4-bedroom, 1.5-bath traditional home with recent updates throughout! Enjoy newer interior paint, flooring, carpet, furnace, water heater, plumbing, and fixtures. The exterior has been freshly painted, giving the home a clean, modern look. Spacious layout, fenced backyard, and is conveniently located near local amenities
-
2026-02-10price $150,000 321-char remark
Show marketing remark (321 chars)
4-bedroom, 1.5-bath traditional home with recent updates throughout! Enjoy newer interior paint, flooring, carpet, furnace, water heater, plumbing, and fixtures. The exterior has been freshly painted, giving the home a clean, modern look. Spacious layout, fenced backyard, and is conveniently located near local amenities
-
2026-02-10price $150,000
Show marketing remark (321 chars)
4-bedroom, 1.5-bath traditional home with recent updates throughout! Enjoy newer interior paint, flooring, carpet, furnace, water heater, plumbing, and fixtures. The exterior has been freshly painted, giving the home a clean, modern look. Spacious layout, fenced backyard, and is conveniently located near local amenities
-
2025-11-25price $160,000 321-char remark
Show marketing remark (321 chars)
4-bedroom, 1.5-bath traditional home with recent updates throughout! Enjoy newer interior paint, flooring, carpet, furnace, water heater, plumbing, and fixtures. The exterior has been freshly painted, giving the home a clean, modern look. Spacious layout, fenced backyard, and is conveniently located near local amenities
-
2025-11-24price $160,000 321-char remark
Show marketing remark (321 chars)
4-bedroom, 1.5-bath traditional home with recent updates throughout! Enjoy newer interior paint, flooring, carpet, furnace, water heater, plumbing, and fixtures. The exterior has been freshly painted, giving the home a clean, modern look. Spacious layout, fenced backyard, and is conveniently located near local amenities
-
2025-11-24price $160,000
Show marketing remark (321 chars)
4-bedroom, 1.5-bath traditional home with recent updates throughout! Enjoy newer interior paint, flooring, carpet, furnace, water heater, plumbing, and fixtures. The exterior has been freshly painted, giving the home a clean, modern look. Spacious layout, fenced backyard, and is conveniently located near local amenities
-
2025-10-13$165,000 Active 321-char remark
Show marketing remark (321 chars)
4-bedroom, 1.5-bath traditional home with recent updates throughout! Enjoy newer interior paint, flooring, carpet, furnace, water heater, plumbing, and fixtures. The exterior has been freshly painted, giving the home a clean, modern look. Spacious layout, fenced backyard, and is conveniently located near local amenities
-
2025-10-13$165,000 Active
Show marketing remark (321 chars)
4-bedroom, 1.5-bath traditional home with recent updates throughout! Enjoy newer interior paint, flooring, carpet, furnace, water heater, plumbing, and fixtures. The exterior has been freshly painted, giving the home a clean, modern look. Spacious layout, fenced backyard, and is conveniently located near local amenities
-
2023-05-30soldstatus $127,000
-
2023-05-26soldstatus $127,000 Sold
-
2023-05-26soldstatus $127,000 Closed
-
2023-05-26soldstatus $127,000 Sold
-
2023-03-21status Pending
-
2023-03-21status Pending
-
2023-03-21status Pending
-
2023-03-17$120,000 Active
-
2023-03-17$120,000 Active
-
2023-03-17$120,000 Active
-
2020-07-08soldstatus $27,000
-
2020-07-08soldstatus $27,000 Sold
-
2020-07-08soldstatus $27,000
-
2020-06-20status Pending
-
2020-02-19price $27,900
-
2019-12-02status Active
-
2019-10-19status Pending
-
2019-10-15price $29,900
-
2019-10-15price $29
-
2019-10-04$27,900
-
2019-10-04$35,200 Active
-
2019-10-04$27,900
-
2018-03-22soldstatus $26,900
-
2018-03-22soldstatus $26,900 Sold
-
2018-02-28status Pending
-
2017-10-23$26,900 Active
-
2017-10-23$26,900
-
2014-10-17historical
-
2014-09-25historical
-
2014-09-16historical
-
2014-09-15historical
-
2014-09-15historical
-
2009-04-13soldstatus $9,000
-
2009-04-13soldstatus $9,000
ⓘ Source: listings_history table (triggers on properties + properties_extension) + one-shot
backfill from property_details.listing_events for pre-trigger history.
Tax reassessment forecast MI · Partial reset (capped growth)
- Current annual tax
- $1,460 · $122/mo
- Projected year-2 tax
- $1,885 · $157/mo
- Expected delta
- +$425/yr (+$35/mo · 29.1%)
ⓘ Screening estimate from a state-policy table — verify with the county assessor before closing.
Climate risk First Street
- Flood 1/10 Low FEMA zone X (unshaded) · 0% chance over 30 yrs
- Wildfire 1/10 Low
- Heat 1/10 Low 7 d/yr ≥93°F today · 14 d/yr by 30 yrs out
- Wind 1/10 Low
- Air quality 4/10 Moderate 4 unhealthy d/yr today · 6 by 30 yrs out
Nearby sold comps map
Loading sold comps map…
Walkable amenities ~0.75 mi
Loading nearby amenities…
Taxation est. · year 1
- Rental income
- $19,567
- − Mortgage interest
- −$8,402
- − Property taxes
- −$1,460
- − Insurance
- −$750
- − Repairs & maintenance
- −$1,565
- − Management
- −$1,565
- − Depreciation
- −$4,364
- Taxable income
- $1,461
- Est. tax owed @ 24.0%
- −$351
- After-tax cash flow
- $3,459/yr
For passive investors: Depreciation is non-cash, so a rental often shows a tax loss while cash-flowing — sheltering income. Rental losses are passive: they offset passive income freely, and up to $25,000/yr can offset ordinary (W-2) income if you actively participate and your MAGI is under $100k (phasing out to $0 by $150k); unused losses carry forward. On sale, claimed depreciation is recaptured at up to 25%, and gains may owe capital-gains tax (a 1031 exchange can defer both). Figures are a year-1 estimate at your 24.0% rate — not tax advice; consult a CPA.
Schools (NCES district)
No district data.
Livability — Muskegon Heights
- Score
- 61/100
- State rank
- #574
- US rank
- #18269
Category grades
Schools grade is shown separately in the Schools card above.
Census & demographics
- Census place
- Muskegon Heights, MI
- County
- Muskegon County · 107,917 people
- Metro
- Muskegon, MI
- Population (ZIP)
- 26,372
- Household income
- $53,054
- Rent vs Own
- Severe rent burden
- 930.0
Population outlook (Muskegon County) Hauer SSP2
- Today (2025)
- 174,032 people
- By 2030
- 173,365 · -0.4%
- By 2040
- 168,877 · -3.0%
- By 2050
- 160,306 · -7.9%
- By 2075
- 134,426 · -22.8%
- By 2100
- 98,836 · -43.2%
Race, ethnicity, and origin ACS 2023
- Neighborhood character
- Diverse neighborhood (Simpson 0.55)
- Race & ethnicity
- White 59% Black 31% Two or more races 6% Hispanic / Latino 4% Native American 1%
- Common ancestry
- Iranian 6% Romanian 4% Lithuanian 2%
- Foreign-born
- 1% · Canada
- Languages at home
- 97% English-only · Spanish 2%
Political lean MEDSL · Muskegon
- 2024 margin
- Toss-up / Even · D 48.4% · R 50.2% · Other 1.5%
- 2008→2024 swing
- -31.1pp toward R · 2008: 29.3pp · 2024: -1.8pp
- All cycles
- 2024: R+1.8 2020: D+0.6 2016: D+0.9 2012: D+17.8 2008: D+29.3
Not yet ingested
- Civics
- —
Market trends
- HPI YoY
- ▼ -150.02%
- Current HPI
- 209.2698
- Rent YoY
- —
- Metro
- Muskegon, MI
- State GDP YoY
- ▲ 1.37%
- F500 in state
- 28
Industry mix (Fortune 500 HQ in MI)
| Industry | F500 HQs | Revenue |
|---|---|---|
| Automotive Parts | 3 | $48B |
|
||
| Automotive | 2 | $372B |
|
||
| Chemicals | 1 | $45B |
|
||
| Automotive Retail | 1 | $29B |
|
||
| Healthcare / Medical Devices | 1 | $23B |
|
||
| Automotive Technology | 1 | $20B |
|
||
Price history
+401.7% since first listed63 events — show timeline
- 2026-02-11 Price Changed $150,000 MiRealSource-MiMLS
- 2026-02-10 Price Changed $150,000 REALCOMP
- 2026-02-10 Price Changed $150,000 SW Michigan MLS
- 2025-11-25 Price Changed $160,000 MiRealSource-MiMLS
- 2025-11-24 Price Changed $160,000 REALCOMP
- 2025-11-24 Price Changed $160,000 SW Michigan MLS
- 2025-10-13 Listed $165,000 SW Michigan MLS
- 2025-10-13 Listed $165,000 REALCOMP
- 2025-10-13 Listed $165,000 MiRealSource-MiMLS
- 2023-05-30 Sold (Public Records) $127,000 Public Records
- 2023-05-26 Sold (MLS) $127,000 SW Michigan MLS
- 2023-05-26 Sold (MLS) $127,000 MiRealSource-MiMLS
- 2023-05-26 Sold (MLS) $127,000 REALCOMP
- 2023-03-21 Pending — MiRealSource-MiMLS
- 2023-03-21 Pending — REALCOMP
- 2023-03-21 Pending — SW Michigan MLS
- 2023-03-17 Listed $120,000 SW Michigan MLS
- 2023-03-17 Listed $120,000 MiRealSource-MiMLS
- 2023-03-17 Listed $120,000 REALCOMP
- 2020-07-08 Sold (MLS) $27,000 MiRealSource-MiMLS
- 2020-07-08 Sold (MLS) $27,000 SW Michigan MLS
- 2020-07-08 Sold (MLS) $27,000 REALCOMP
- 2020-06-20 Pending — SW Michigan MLS
- 2020-02-19 Price Changed $27,900 SW Michigan MLS
- 2019-12-02 Relisted — SW Michigan MLS
- 2019-10-19 Pending — SW Michigan MLS
- 2019-10-15 Price Changed $29,900 SW Michigan MLS
- 2019-10-15 Price Changed $29 SW Michigan MLS
- 2019-10-04 Listed $27,900 MiRealSource-MiMLS
- 2019-10-04 Listed $35,200 SW Michigan MLS
- 2019-10-04 Listed $27,900 REALCOMP
- 2018-03-22 Sold (MLS) $26,900 SW Michigan MLS
- 2018-03-22 Sold (MLS) $26,900 REALCOMP
- 2018-02-28 Pending — SW Michigan MLS
- 2017-10-23 Listed $26,900 SW Michigan MLS
- 2017-10-23 Listed $26,900 REALCOMP
- 2014-10-17 Listing Removed — SW Michigan MLS
- 2014-09-25 Listing Removed — SW Michigan MLS
- 2014-09-16 Listing Removed — SW Michigan MLS
- 2014-09-15 Listing Removed — SW Michigan MLS
- 2014-09-15 Listing Removed — SW Michigan MLS
- 2009-04-13 Sold (MLS) $9,000 REALCOMP
- 2009-04-13 Sold (MLS) $9,000 SW Michigan MLS
- 2008-12-05 Listed $10,000 REALCOMP
- 2008-12-05 Listed $10,000 SW Michigan MLS
- 2008-04-03 Listing Removed — REALCOMP
- 2008-03-31 Listing Removed — REALCOMP
- 2007-06-22 Listed $30,909 REALCOMP
- 2007-06-22 Listed $30,909 REALCOMP
- 2007-06-22 Listed $30,909 SW Michigan MLS
- 2007-06-22 Listed $30,909 SW Michigan MLS
- 2007-05-16 Listing Removed — REALCOMP
- 2007-03-16 Listed $45,000 REALCOMP
- 2007-03-16 Listed $45,000 SW Michigan MLS
- 2002-06-12 Sold (Public Records) $64,000 Public Records
- 2002-06-12 Sold (MLS) $64,000 REALCOMP
- 2002-06-12 Sold (MLS) $64,000 SW Michigan MLS
- 2001-07-25 Listed $59,900 REALCOMP
- 2001-07-25 Listed $59,900 SW Michigan MLS
- 1998-12-31 Listing Removed — REALCOMP
- 1998-09-01 Listed $29,900 REALCOMP
- 1998-09-01 Listed $29,900 SW Michigan MLS
- 1998-08-03 Listed $29,900 SW Michigan MLS
Property tax history
+3.0%/yrLatest (2025): $1,460 · +2.7% YoY. Source: county tax records.
Cash-flow waterfall
monthlySold comps — $/sqft
last 12 mo · ≤1 miLoading sold comps…