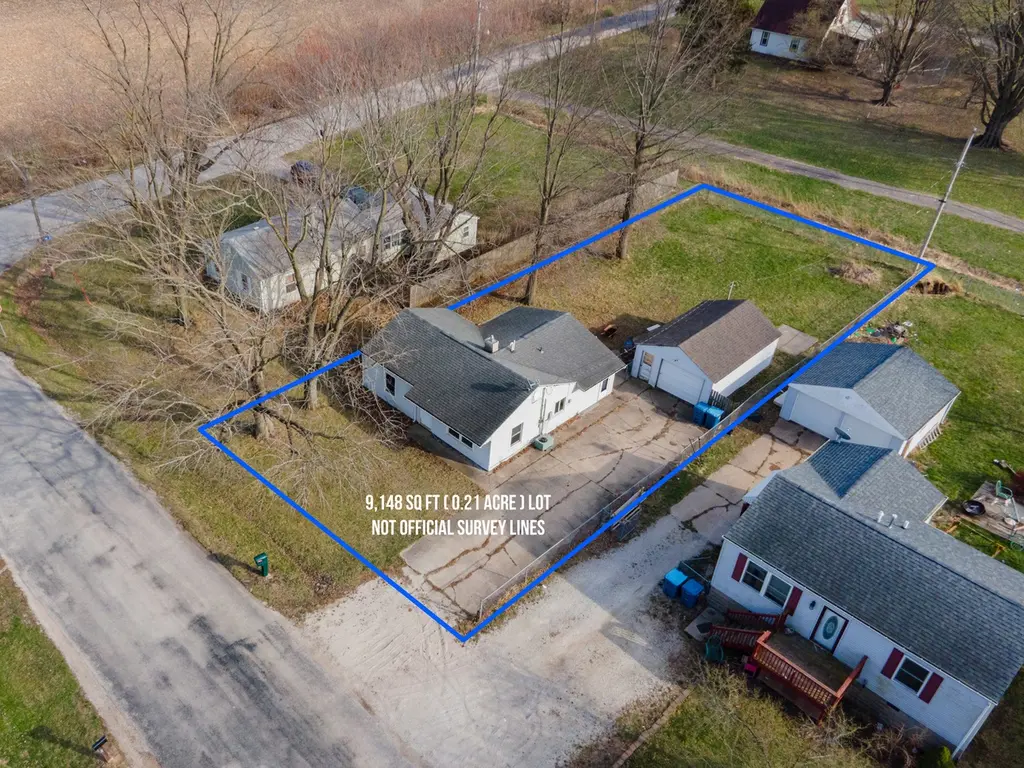
17122 10th Ave · Carbon Cliff, IL
Flood risk No data
- FEMA flood zone
- —
- Chance of flooding over 30 yrs
- —
- Est. flood insurance / yr
- —
Fire risk No data
- Est. fire insurance / yr
- —
Heat risk No data
- Hot days now (above threshold)
- —
- Hot days in 30 yrs
- —
Wind risk No data
- Chance of severe wind over 30 yrs
- —
Air-quality risk No data
- Unhealthy air days now
- —
- Unhealthy air days in 30 yrs
- —
Risk factors via First Street. Map © Google.
Why this score? — see what drove the D+ grade
The composite is a weighted blend of 9 inputs, each scored 0–100. Each bar is that input's sub-score; the figure is the points it added to the 100-point composite (weight × sub-score).
- Cash flow +15.0/30.0
- Appreciation +7.9/10.0
- ARV discount +7.5/15.0
- 1% rule +5.0/10.0
- DSCR +5.0/10.0
- Livability +3.4/5.0
- Rent growth +2.5/5.0
- Condition / age +2.2/5.0
- Schools +1.2/10.0
$32,000
🖨 Deal sheet 📄 Offer letter ✓ Due diligence
Listing remarks
Set near the scenic Rock River, this property offers a peaceful setting with some land and outstanding investment potential for an array of things. The spacious lot provides ample room to create a beautiful outdoor retreat, entertaining space, or explore future expansion possibilities. The existing single-level slab home features a bright, open living area filled with natural light and serves as an excellent foundation for your vision. Whether you choose to refresh the current residence, reimagine the space with a custom remodel, the possibilities here are wide open. With its desirable location, generous yard, and long-term potential, this is a rare opportunity for investors or buyers looki
Key facts
- Scenic location
- Great size yard
- Spacious living area
Tags
Property features AI
Finance
- Other: Living area source: Assessor; Property listed with eXp Realty
- HOA & community: No master association fee required
Exterior
- Parking: Detached garage (1 garage space, 1 total parking space)
- Utilities: Sewer: Other; Electric: Circuit breakers
- Home design: Detached single-family home; One-story; Fee simple ownership; Built before 1978
- Construction: Vinyl siding; Concrete perimeter foundation; Approximately 71–80 years old
- Exterior features: Level lot; Lot dimensions about 100 x 100; Less than 0.25 acre
Interior
- Kitchen: Kitchen on main level, approximately 8 x 8
- Bedrooms: Master bedroom (Main level), approximately 12 x 12; Bedroom 2 (Main level), approximately 9 x 12; Bedroom 3 (Main level), approximately 12 x 11
- Flooring: Other flooring throughout
- Bathrooms: One full bathroom
- Heating & cooling: Natural gas heating; Central air conditioning
- Interior features: Five total rooms; Flood zone
- Laundry & utility: Laundry room
Neighborhood map
What this means for you Summary
Snapshot
- This is a 3-bed/1.0-bath single-family listed at $32k. Condition is rated fair.
Deal economics
- At list price, monthly cash flow is $841 ($10k/yr) — positive.
- The deal already cash-flows at list — no discount required.
- Meets the 1% rule at list price ($1k rent vs $32k).
- Recommended offer: $30k (6.0% below list) — sets the bar for market timing.
Location & tenants
- Location reads 67/100 on livability (#502 in IL) — a middle-class / working-renter tenant base. Strengths: crime A+, cost of living A+, health & safety A-; Watch: schools D+, amenities F, commute F.
- United Twp Hsd 30 (suburban): math 12% / reading 15% proficiency, ranked #536 of 620 in IL (top 86%) — low school quality limits family demand, transient renter base, plan for 1-2y turnover.
- Market conditions: 16 active listings in the ZIP; 2 comparable units currently listed for rent nearby; 116 units permitted in Rock Island County in 2024 (50 in 5+ unit buildings).
Forward outlook
- In year one you build about $2k of equity ($221 loan paydown + $2k appreciation (5.8% local appreciation)).
- Rock Island County population projected at -12% by 2050 — secular population decline; favor cash flow + early exit over multi-decade hold.
- At projected returns (5.8% appreciation + 3.0% rent growth), your $9k cash investment doubles in ~1 year — after that, you're playing with house money.
Negotiation context
- It's been on market 84 days — a 6% lower offer ($30k) is reasonable based on typical stale-listing flexibility.
Risks & watch-outs
- Watch-outs: built in 1954 — expect roof / HVAC / electrical / plumbing capex.
Questions for the listing agent
- It's been on market 84 days. Have you received any prior offers? Is the seller open to a 6% concession, seller financing, or rate buy-down credit?
- Have any recent inspections been done? Can we get a copy of the seller's disclosures and any deferred-maintenance estimates?
- Built in 1954 — when were the roof, HVAC, electrical panel, plumbing, and water heater last replaced?
- Why hasn't it sold? Are there any deal-killer items the seller is aware of (foundation, flood, title, zoning, code violations)?
- Is there a deadline driving the sale (1031 exchange, divorce, estate, relocation)? That informs how much negotiation room exists.
- Schools are D-rated, which usually means shorter tenancies and higher turnover. Who's the typical renter profile here, and what's been the actual vacancy rate?
- The area grade is low — what's the realistic commute time and amenity access for the typical tenant pool here? Any planned neighborhood developments (good or bad) we should know about?
- What's the average days-on-market for RENTAL listings here right now (not sales)? A rising rental-DOM trend means longer vacancies and softer asking-rent achievability than the comps imply.
- What's the recent tenant-quality profile in this submarket — average credit score on applications, eviction rate, late-payment / NSF rate, and stable-employment percentage? A property-management company in the area should have these aggregated.
- How much new for-sale + rental construction is in the pipeline within 1–3 miles? Heavy new supply typically softens prices + rents 12–24 months out; constrained supply supports both.
Investment metrics
- 1% rule
- 4.20% ✓
- Cap rate
- 37.84%
- Cash-on-cash
- 112.66%
- DSCR
- 6.01
- GRM
- 2.0
CMA / ARV
- ARV (on-the-fly)
- $123,708
- Comps found
- 5
Show comp detail 5 sales within ~0.75 mi
| Address | Dist | Beds/Ba | Sqft | Sold | Price | $/sf | Match |
|---|---|---|---|---|---|---|---|
| 129 State St | 0.29mi | 2/1.0 (-1) | 987 (-3%) | 10mo | $95,000 | $96 | 69 |
| 111 5th St | 0.11mi | 2/1.5 (-1) | 906 (-11%) | 10mo | $129,000 | $142 | 62 |
| 16808 10th Ave | 0.39mi | 3/1.0 | 912 (-10%) | 11mo | $112,500 | $123 | 56 |
| 206 Cliff Dr | 0.43mi | 3/1.0 | 1,107 (+9%) | 14mo | $135,000 | $122 | 53 |
| 116 State St | 0.28mi | 2/1.0 (-1) | 864 (-15%) | 19mo | $105,000 | $122 | 41 |
Match score weights: distance 35% · size 25% · config 20% · recency 20%. Top-matched comps best support the ARV.
Projected returns pro-forma
5.8% appreciation · 3.0% rent growth · sell at horizon
- IRR
- —
- Equity multiple
- 7.97×
- Total profit
- $62,450
- Equity at exit
- $19,709
- IRR
- —
- Equity multiple
- 16.84×
- Total profit
- $141,891
- Equity at exit
- $35,394
Cash invested: $8,960 (down + closing). Projections, not guarantees.
Landlord ↔ Tenant lean methodology
- Overall (STATE)
- 43 Moderately Tenant-Leaning
- State Illinois
- 43 Moderately Tenant-Leaning · D+7
- County
- — inherits STATE
- City
- — inherits STATE
ZIP-level market 61239
- Home prices YoY
- 4.6%
- Active inventory
- 16
- Price-to-rent
- 2.0×
Monthly cashflow live
- Estimated rent
- $1,345 medium interval (Pro) →
- Mortgage (P&I)
- −$168
- Tax est. 1.5%
- −$40 /mo · $480/yr
- Insurance
- −$13
- HOA
- −$0
- Vacancy / Maint / Mgmt
- −$282
- Net cashflow
- $841
Break-even live
UW: 25.0% down · 7.5% · 30yr · 1.5% tax · 5.0% vac · 8.0% maint · 8.0% mgmt
Financing live
Cash to close
- Down payment
- $8,000
- Closing costs
- $960
- Reserves months
- —
- Total cash needed
- —
Loan-product check · same deal, 3 products live
Conventional
25% down · 7.5% · 30yr
- Down + closing
- —
- Monthly P&I
- —
- Monthly cashflow
- —
- DSCR
- —
- Eligible?
- —
Personal DTI + credit; lowest rate.
DSCR
20% down · 8.5% · 30yr
- Down + closing
- —
- Monthly P&I
- —
- Monthly cashflow
- —
- DSCR
- —
- Eligible?
- —
No personal income docs; deal must DSCR.
Hard money
10% down · 12.0% · 12mo
- Down + closing
- —
- Monthly P&I
- —
- Monthly cashflow
- —
- DSCR
- —
- Eligible?
- —
Short-term bridge; refi at stabilization.
Rent comps 2 comps
| Address | Beds | Baths | Sqft | Rent | $/sqft | DOM | Units | Dist |
|---|---|---|---|---|---|---|---|---|
| 3402 Orchard Ln Carbon Cliff, IL | 1.0–3.0 | 1.0–1.5 | 941 | $1,385 | $1.47 | 13d | 11 | 1.11mi |
| 1810 14th St Silvis, IL | 3.0 | 1.0 | 1100 | $1,300 | $1.18 | 13d | 1 | 1.22mi |
Listing history 15 events
-
2026-06-18days on market $32,000 Active 84 DOM
-
2026-06-17days on market $32,000 Active 83 DOM
-
2026-06-16days on market $32,000 Active 82 DOM
-
2026-06-15days on market $32,000 Active 81 DOM
-
2026-06-14days on market $32,000 Active 79 DOM
-
2026-06-13days on market $32,000 Active 78 DOM
-
2026-06-10days on market $32,000 Active 76 DOM
-
2026-06-09days on market $32,000 Active 75 DOM
-
2026-06-08days on market $32,000 Active 74 DOM
-
2026-06-07days on market $32,000 Active 73 DOM
-
2026-06-02days on market $32,000 Active 68 DOM
-
2026-06-01days on market $32,000 Active 67 DOM
-
2026-05-31days on market $32,000 Active 66 DOM
-
2026-05-30days on market $32,000 Active 65 DOM
-
2026-03-26$32,000 Active
ⓘ Source: listings_history table (triggers on properties + properties_extension) + one-shot
backfill from property_details.listing_events for pre-trigger history.
Nearby sold comps map
Loading sold comps map…
Walkable amenities ~0.75 mi
Loading nearby amenities…
Taxation est. · year 1
- Rental income
- $16,136
- − Mortgage interest
- −$1,792
- − Property taxes
- −$480
- − Insurance
- −$160
- − Repairs & maintenance
- −$1,291
- − Management
- −$1,291
- − Depreciation
- −$931
- Taxable income
- $10,191
- Est. tax owed @ 24.0%
- −$2,446
- After-tax cash flow
- $7,648/yr
For passive investors: Depreciation is non-cash, so a rental often shows a tax loss while cash-flowing — sheltering income. Rental losses are passive: they offset passive income freely, and up to $25,000/yr can offset ordinary (W-2) income if you actively participate and your MAGI is under $100k (phasing out to $0 by $150k); unused losses carry forward. On sale, claimed depreciation is recaptured at up to 25%, and gains may owe capital-gains tax (a 1031 exchange can defer both). Figures are a year-1 estimate at your 24.0% rate — not tax advice; consult a CPA.
Condition & rehab AI · 13 photos
This single-family home requires moderate repairs and maintenance to improve its condition and increase its resale and rental value.
Repairs flagged
- Moderate roof — Signs of wear
- Moderate exterior siding — Weathered and paint peeling
- Major flooring — Damaged and uneven
- Major interior walls — Paint peeling and walls worn
Value-add opportunities
- Both Paint exterior — Enhances curb appeal and value
- Both Seal and repair roof — Prevents water damage and extends life
- Both Replace flooring — Improves living space and value
- Both Paint interior walls — Enhances interior appearance and value
Renovation cost estimate screening
| Repair item | Severity | Est. cost |
|---|---|---|
| roof · Signs of wear | Moderate | $3,000–15,000 |
| exterior siding · Weathered and paint peeling | Moderate | $3,000–15,000 |
| flooring · Damaged and uneven | Major | $15,000–50,000 |
| interior walls · Paint peeling and walls worn | Major | $15,000–50,000 |
| Total estimated repair cost · 4 items | $36,000–130,000 |
Value-add ROI direction
- Both Paint exterior — Enhances curb appeal and value ↑
- Both Seal and repair roof — Prevents water damage and extends life ↑
- Both Replace flooring — Improves living space and value ↑
- Both Paint interior walls — Enhances interior appearance and value ↑
ⓘ Cost ranges are severity-bucket heuristics (US national rule-of-thumb). Get contractor quotes + a written scope before underwriting a rehab budget.
Schools (NCES district)
- District
- United Twp Hsd 30
- NCES district ID
- 1739870
- Math proficiency
- 12% ▼ -5.00%
- Reading proficiency
- 15% ▼ -6.00%
- Median HH income
- $43,647
- Composite
- 11.91/100
- National rank
- #9670
- State rank
- #536 of 620 in IL
Livability — Carbon Cliff
- Score
- 67/100
- State rank
- #502
- US rank
- #10342
Category grades
Schools grade is shown separately in the Schools card above.
Census & demographics
- Census place
- Carbon Cliff, IL
- City population
- 1,138
- Population (ZIP)
- 1,138
Population outlook (Rock Island County) Hauer SSP2
- Today (2025)
- 140,982 people
- By 2030
- 137,705 · -2.3%
- By 2040
- 130,512 · -7.4%
- By 2050
- 123,841 · -12.2%
- By 2075
- 109,851 · -22.1%
- By 2100
- 90,922 · -35.5%
Race, ethnicity, and origin ACS 2023
- Neighborhood character
- Predominantly White (66%)
- Race & ethnicity
- White 66% Black 18% Two or more races 10% Hispanic / Latino 7%
- Hispanic origin (detail)
- Mexican 7%
- Common ancestry
- Romanian 3% English 3% Slovak 2%
- Foreign-born
- 11% · United Kingdom
- Languages at home
- 91% English-only · French/Haitian/Cajun 4%
Political lean MEDSL · Rock Island
- 2024 margin
- Lean D (+9.6) · D 53.9% · R 44.4% · Other 1.7%
- 2008→2024 swing
- -15.0pp toward R · 2008: 24.6pp · 2024: 9.6pp
- All cycles
- 2024: D+9.6 2020: D+12.1 2016: D+8.4 2012: D+21.9 2008: D+24.6
Not yet ingested
- Civics
- —
Market trends
- HPI YoY
- ▲ 5.80%
- Current HPI
- 132.7
- Rent YoY
- —
- Metro
- —
- State GDP YoY
- ▲ 1.59%
- F500 in state
- 60
Industry mix (Fortune 500 HQ in IL)
| Industry | F500 HQs | Revenue |
|---|---|---|
| Insurance | 4 | $201B |
|
||
| Consumer Goods | 4 | $87B |
|
||
| Industrial Machinery | 3 | $64B |
|
||
| Healthcare | 2 | $55B |
|
||
| Retail / Pharmacy | 1 | $148B |
|
||
| Agriculture / Food | 1 | $86B |
|
||
Price history
1 event — show timeline
- 2026-03-26 Listed $32,000 MRED as Distributed by MLS Grid
Cash-flow waterfall
monthlySold comps — $/sqft
last 12 mo · ≤1 miLoading sold comps…