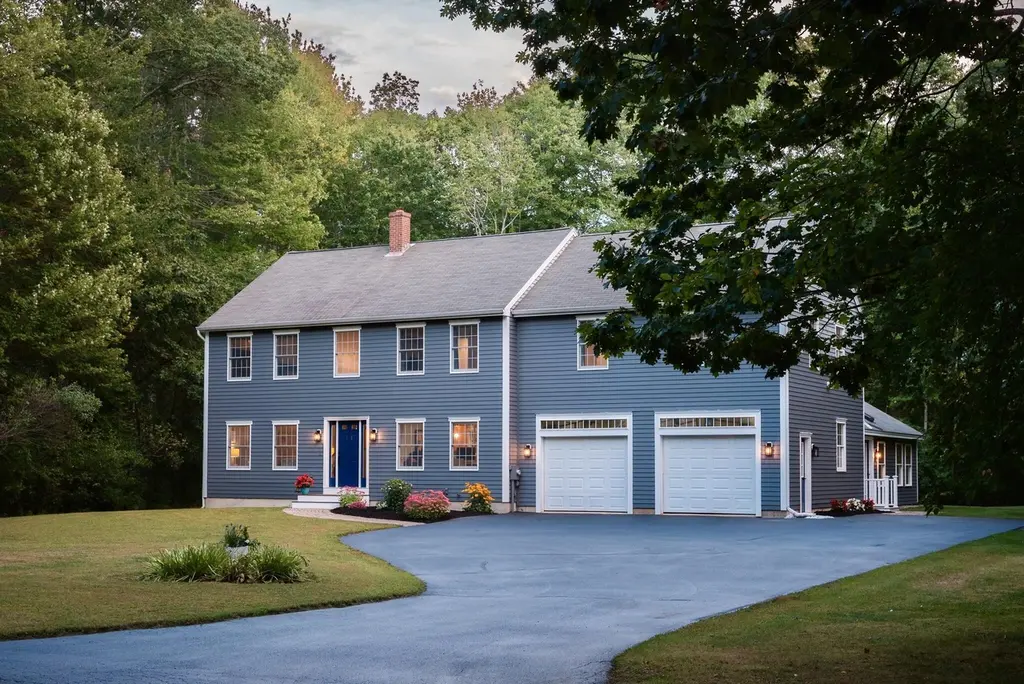
8 Constitution Rd · Kennebunk, ME
Flood risk 1/10 · Minimal
- FEMA flood zone
- X
- Chance of flooding over 30 yrs
- 0.0%
- Est. flood insurance / yr
- $473 – $860
Fire risk 1/10 · Minimal
- Est. fire insurance / yr
- $669 – $1,243
Heat risk 4/10 · Minor
- Hot days now (above 88°F)
- 7 days/yr
- Hot days in 30 yrs
- 17 days/yr
Wind risk 6/10 · Moderate
- Chance of severe wind over 30 yrs
- 66.0%
Air-quality risk 2/10 · Minimal
- Unhealthy air days now
- 1 days/yr
- Unhealthy air days in 30 yrs
- 1 days/yr
Risk factors via First Street. Map © Google.
Why this score? — see what drove the F grade
The composite is a weighted blend of 9 inputs, each scored 0–100. Each bar is that input's sub-score; the figure is the points it added to the 100-point composite (weight × sub-score).
- Schools +8.0/10.0
- ARV discount +7.5/15.0
- Livability +4.0/5.0
- Cash flow +2.6/30.0
- Rent growth +2.5/5.0
- Condition / age +2.5/5.0
- 1% rule +0.0/10.0
- DSCR +0.0/10.0
- Appreciation +0.0/10.0
$1,199,000
🖨 Deal sheet (PDF) 📄 Offer letter ✓ Due diligence
Listing remarks
Set in a sought-after neighborhood just minutes from Kennebunk's beaches, Lower Village, Dock Square, and downtown, this beautiful 5 bedroom, 3.5 bath home offers the perfect balance of privacy and convenience. Thoughtfully designed for both everyday living and entertaining, the home features spacious, flexible interiors and stunning outdoor living areas. Inside, you'll find a well-appointed layout with generous living spaces, abundant natural light, and seamless flow. A versatile bonus area provides the ideal opportunity for a guest suite or first-floor primary; flexibility to suit a variety of needs. Step outside to a private backyard retreat complete with an inviting deck and pool area,
Key facts
- 0.9 acre lot
- 2 garage spots
- Pool
Property features AI
Exterior
- Parking: Attached 2-car garage with auto door opener and direct entry to the living area; Paved parking with room for 5–10 additional vehicles
- Utilities: Public water; Private sewer (septic design available); Gas water heater; Electric with circuit breakers
- Home design: Single-family residence; Built in 2000; Wood frame construction with wood siding; Shingle roof
- Construction: Wood frame construction; Wood siding; Shingle roof; Year built: 2000
- Exterior features: Deck; In-ground pool; Level, wooded lot located near golf course, public beach, town, and turnpike/interstate; Neighborhood setting; subdivided; Paved road access
Interior
- Kitchen: Eat-in kitchen with island; Appliances included: Gas range, microwave, refrigerator, dishwasher, disposal
- Bedrooms: First-floor bedroom (suite with full bath, cathedral ceiling, closet, laundry hook-up, separate shower); Second-floor bedroom with closet; Second-floor bedroom with closet; Second-floor bedroom with walk-in closet, double vanity, soaking tub, full bath, laundry hook-up (suite); Second-floor bedroom
- Flooring: Hardwood; Tile; Carpet
- Bathrooms: Three full bathrooms; One half bathroom; Features include double vanity, soaking tub, separate shower, and full baths associated with suites
- Heating & cooling: Heat pump for heating and cooling; Baseboard and hot water heating; Zoned heating
- Interior features: One-floor living with in-law floorplan and 1st-floor primary bedroom with bath; First-floor bedroom; Primary bedroom with bath; Bathtub and separate shower; Storage; Walk-in closet(s); 36+ inch doorways for accessibility; Double-pane windows; Total of 10 rooms
- Laundry & utility: Washer and dryer included; Laundry hookups on main and upper levels
Neighborhood map
What this means for you Summary
Snapshot
- This is a 3-bed/3.5-bath single-family listed at $1.20M.
Deal economics
- At list price, monthly cash flow is $-4k ($-49k/yr) — negative.
- To cash-flow at today's rent, offer at most $477k (60.2% below list).
- To meet the 1% rule (rent ≥ 1% of price), the offer needs to be $449k (62.5% below list).
- Recommended offer: $449k (62.5% below list) — sets the bar for 1% rule.
- Cap rate 2.2% vs local median 3.2% in Kennebunk — below-typical yield; the buyer is paying a premium for something (appreciation thesis, condition, location) that the cap rate doesn't capture.
Location & tenants
- Location reads 79/100 on livability (#20 in ME, #2,049 nationally) — a middle-class / working-renter tenant base. Strengths: schools A+, crime A+, employment A+; Watch: cost of living D+, amenities F, commute F.
- RSU 21 (rural): math 91% / reading 94% proficiency, ranked #13 of 112 in ME (top 12%) — strong family-tenant draw, lease renewals of 3-5y typical; only 16% free/reduced lunch — higher-income household profile.
- Market conditions: 132 active listings in the ZIP; 1,386 units permitted in York County in 2024 (338 in 5+ unit buildings).
Forward outlook
- Local home prices are declining (-3.0%/yr); year-one equity from $8k of loan paydown is wiped out by about $36k of value loss. Plan a longer hold.
Negotiation context
- It's been on market 35 days — a 3% lower offer ($1.16M) is reasonable based on typical stale-listing flexibility.
- 2 sale attempts with the ask held roughly flat each time — persistent listings suggest the price (not the market) is what's stuck; bring a comps-based counter.
Risks & watch-outs
- Climate carrying-cost: major wind risk, 66% chance of damaging wind over 30y — expect insurance premiums to compound above CPI over the hold.
Questions for the listing agent
- What do current leases actually rent for vs. the listed asking? Can we see a recent rent roll and the last 12 months of T-12 income?
- It's been on market 35 days. Have you received any prior offers? Is the seller open to a 63% concession, seller financing, or rate buy-down credit?
- Is there a deadline driving the sale (1031 exchange, divorce, estate, relocation)? That informs how much negotiation room exists.
- Schools are A-rated — typically a magnet for longer-tenancy family renters. What's the average tenant stay here, and is there a school-zone premium baked into asking?
- The area grade is low — what's the realistic commute time and amenity access for the typical tenant pool here? Any planned neighborhood developments (good or bad) we should know about?
- What's the average days-on-market for RENTAL listings here right now (not sales)? A rising rental-DOM trend means longer vacancies and softer asking-rent achievability than the comps imply.
- What's the recent tenant-quality profile in this submarket — average credit score on applications, eviction rate, late-payment / NSF rate, and stable-employment percentage? A property-management company in the area should have these aggregated.
- How much new for-sale + rental construction is in the pipeline within 1–3 miles? Heavy new supply typically softens prices + rents 12–24 months out; constrained supply supports both.
Investment metrics
- 1% rule
- 0.37% ✗
- Cap rate
- 2.20%
- Cash-on-cash
- -14.61%
- DSCR
- 0.35
- GRM
- 22.2
CMA / ARV
- ARV (median comp)
- $759,771
- List price
- $1,199,000
- Delta
- 57.81%
- Verdict
- OVERPRICED
- Comps
- 4 within 1.0 mi
Show comp detail 1 sale within ~0.75 mi
| Address | Dist | Beds/Ba | Sqft | Sold | Price | $/sf | Match |
|---|---|---|---|---|---|---|---|
| 23 Constitution Rd | 0.13mi | 4/2.5 (+1) | 3,481 (-2%) | 21mo | $1,512,500 | $435 | 65 |
Match score weights: distance 35% · size 25% · config 20% · recency 20%. Top-matched comps best support the ARV.
Projected returns pro-forma
-3.0% appreciation · 3.0% rent growth · sell at horizon
- IRR
- -44.3%
- Equity multiple
- -0.36×
- Total profit
- $-454,986
- Equity at exit
- $178,775
- IRR
- -79.8%
- Equity multiple
- -1.18×
- Total profit
- $-732,803
- Equity at exit
- $103,668
Cash invested: $335,720 (down + closing). Projections, not guarantees.
Landlord ↔ Tenant lean methodology
- Overall (STATE)
- 41 Moderately Tenant-Leaning
- State Maine
- 41 Moderately Tenant-Leaning · D+2
- County
- — inherits STATE
- City
- — inherits STATE
ZIP-level market 04043
- Home prices YoY
- -21.4%
- Active inventory
- 132
- Price-to-rent
- 22.2×
Monthly cashflow live
- Estimated rent
- $4,491 medium interval (Pro) →
- Mortgage (P&I)
- −$6,288
- Tax from tax record
- −$849 /mo · $10,187/yr
- Insurance
- −$500
- HOA
- −$0
- Vacancy / Maint / Mgmt
- −$943
- Net cashflow
- $-4,088
Break-even live
Sensitivity live
| Price | -10% $-3,409 | -5% $-3,749 | +0% $-4,088 | +5% $-4,427 | +10% $-4,767 |
|---|---|---|---|---|---|
| Rent | -10% $-4,443 | -5% $-4,265 | +0% $-4,088 | +5% $-3,911 | +10% $-3,733 |
| Rate | -1.0pp $-3,484 | -0.5pp $-3,783 | base $-4,088 | +0.5pp $-4,399 | +1.0pp $-4,715 |
UW: 25.0% down · 7.5% · 30yr · 1.5% tax · 5.0% vac · 8.0% maint · 8.0% mgmt
Financing live
Cash to close
- Down payment
- $299,750
- Closing costs
- $35,970
- Reserves months
- —
- Total cash needed
- —
Loan-product check · same deal, 3 products live
Conventional
25% down · 7.5% · 30yr
- Down + closing
- —
- Monthly P&I
- —
- Monthly cashflow
- —
- DSCR
- —
- Eligible?
- —
Personal DTI + credit; lowest rate.
DSCR
20% down · 8.5% · 30yr
- Down + closing
- —
- Monthly P&I
- —
- Monthly cashflow
- —
- DSCR
- —
- Eligible?
- —
No personal income docs; deal must DSCR.
Hard money
10% down · 12.0% · 12mo
- Down + closing
- —
- Monthly P&I
- —
- Monthly cashflow
- —
- DSCR
- —
- Eligible?
- —
Short-term bridge; refi at stabilization.
Listing history 10 events
-
2026-06-07statusdays on market $1,199,000 Pending 35 DOM
-
2026-06-05days on market $1,199,000 Active Under Contract 34 DOM
-
2026-06-03days on market $1,199,000 Active Under Contract 33 DOM
-
2026-06-02days on market $1,199,000 Active Under Contract 32 DOM
-
2026-06-01days on market $1,199,000 Active Under Contract 31 DOM
-
2026-05-31days on market $1,199,000 Active Under Contract 30 DOM
-
2026-05-30days on market $1,199,000 Active Under Contract 29 DOM
-
2026-05-18status Active 1045-char remark
-
2026-05-05historical Active Under Contract 1045-char remark
-
2026-05-01$1,199,000 Active 1045-char remark
ⓘ Source: listings_history table (triggers on properties + properties_extension) + one-shot
backfill from property_details.listing_events for pre-trigger history.
Tax reassessment forecast ME · Partial reset (capped growth)
- Current annual tax
- $10,187 · $849/mo
- Projected year-2 tax
- $13,247 · $1,104/mo
- Expected delta
- +$3,060/yr (+$255/mo · 30.0%)
ⓘ Screening estimate from a state-policy table — verify with the county assessor before closing.
Climate risk First Street
- Flood 1/10 Low FEMA zone X · 0% chance over 30 yrs
- Wildfire 1/10 Low
- Heat 4/10 Moderate 7 d/yr ≥88°F today · 17 d/yr by 30 yrs out
- Wind 6/10 Major 66% chance of damaging wind over 30 yrs
- Air quality 2/10 Low 1 unhealthy d/yr today · 1 by 30 yrs out
Nearby sold comps map
Loading sold comps map…
Walkable amenities ~0.75 mi
Loading nearby amenities…
Taxation est. · year 1
- Rental income
- $53,897
- − Mortgage interest
- −$67,163
- − Property taxes
- −$10,187
- − Insurance
- −$5,995
- − Repairs & maintenance
- −$4,312
- − Management
- −$4,312
- − Depreciation
- −$34,880
- Taxable loss
- −$72,951
- Est. tax savings @ 24.0%
- +$17,508
- After-tax cash flow
- $-31,547/yr
For passive investors: Depreciation is non-cash, so a rental often shows a tax loss while cash-flowing — sheltering income. Rental losses are passive: they offset passive income freely, and up to $25,000/yr can offset ordinary (W-2) income if you actively participate and your MAGI is under $100k (phasing out to $0 by $150k); unused losses carry forward. On sale, claimed depreciation is recaptured at up to 25%, and gains may owe capital-gains tax (a 1031 exchange can defer both). Figures are a year-1 estimate at your 24.0% rate — not tax advice; consult a CPA.
Schools (NCES district)
- District
- RSU 21
- NCES district ID
- 2314773
- Math proficiency
- 91% ▲ 34.00%
- Reading proficiency
- 94% ▲ 20.00%
- Median HH income
- $68,462
- Composite
- 79.78/100
- National rank
- #55
- State rank
- #13 of 112 in ME
Livability — Kennebunk
- Score
- 79/100
- State rank
- #20
- US rank
- #2049
Category grades
Schools grade is shown separately in the Schools card above.
Census & demographics
- Census place
- Kennebunk, ME
- Population (ZIP)
- 11,692
Population outlook (York County) Hauer SSP2
- Today (2025)
- 209,961 people
- By 2030
- 212,816 · +1.4%
- By 2040
- 214,360 · +2.1%
- By 2050
- 210,350 · +0.2%
- By 2075
- 201,686 · -3.9%
- By 2100
- 183,392 · -12.7%
Race, ethnicity, and origin ACS 2023
- Neighborhood character
- Predominantly White (94%)
- Race & ethnicity
- White 94% Hispanic / Latino 3% Two or more races 2% Asian 2%
- Common ancestry
- Lithuanian 8% Slovak 5% Serbian 3%
- Foreign-born
- 8% · Canada, Vietnam
- Languages at home
- 95% English-only · French/Haitian/Cajun 2% Spanish 2% German/W. Germanic 1%
Political lean MEDSL · York
- 2024 margin
- D (+10.5) · D 54.3% · R 43.8% · Other 1.9%
- 2008→2024 swing
- -10.1pp toward R · 2008: 20.5pp · 2024: 10.5pp
- All cycles
- 2024: D+10.5 2020: D+12.6 2016: D+4.8 2012: D+16.4 2008: D+20.5
Not yet ingested
- Civics
- —
Market trends
- HPI YoY
- ▼ -108.54%
- Current HPI
- 398.495
- Rent YoY
- —
- Metro
- —
- State GDP YoY
- —
- F500 in state
- 0
Price history
5 events — show timeline
- 2026-06-05 Pending — MREIS
- 2026-05-22 Contingent — MREIS
- 2026-05-18 Relisted — MREIS
- 2026-05-05 Contingent — MREIS
- 2026-05-01 Listed $1,199,000 MREIS
Property tax history
+5.1%/yrLatest (2025): $10,187 · +13.9% YoY. Source: county tax records.
Cash-flow waterfall
monthlySold comps — $/sqft
last 12 mo · ≤1 miLoading sold comps…