 Duplex
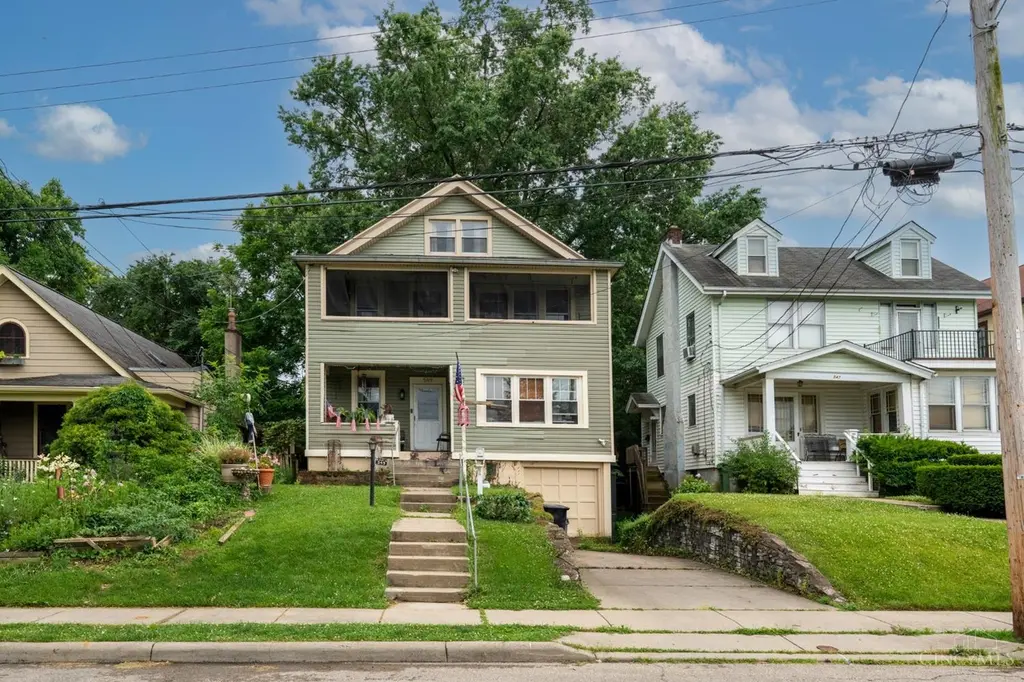
549 Church St · St. Bernard, OH
Flood risk 1/10 · Minimal
- FEMA flood zone
- X (unshaded)
- Chance of flooding over 30 yrs
- 0.0%
- Est. flood insurance / yr
- $473 – $860
Fire risk 1/10 · Minimal
- Est. fire insurance / yr
- $713 – $1,323
Heat risk 5/10 · Moderate
- Hot days now (above 103°F)
- 7 days/yr
- Hot days in 30 yrs
- 19 days/yr
Wind risk 2/10 · Minimal
- Chance of severe wind over 30 yrs
- 1.0%
Air-quality risk 3/10 · Minor
- Unhealthy air days now
- 2 days/yr
- Unhealthy air days in 30 yrs
- 3 days/yr
Risk factors via First Street. Map © Google.
Why this score? — see what drove the B- grade
The composite is a weighted blend of 9 inputs, each scored 0–100. Each bar is that input's sub-score; the figure is the points it added to the 100-point composite (weight × sub-score).
- Cash flow +27.8/30.0
- DSCR +9.8/10.0
- ARV discount +9.2/15.0
- 1% rule +7.6/10.0
- Schools +3.5/10.0
- Rent growth +2.5/5.0
- Livability +2.5/5.0
- Condition / age +2.5/5.0
- Appreciation +0.0/10.0
$210,000
🖨 Deal sheet 📄 Offer letter ✓ Due diligence
Multi-family units
County records classify this as Multi-Family (2-4 Unit). Listing-text estimate: 2 units. confirmed
Listing remarks MLS
Large duplex, desirable floor plan. Laundry area in each unit. Separate entrances and utilities. Porches & balcony. 2nd floor unit has 2 bedrooms and additional living space. This building has tremendous cash flow potential. Great location, convenient to retail, schools and interstate.
Key facts
- Flexible floor plans
- 4,792 sq ft lot
- Built 1925
Tags
Property features AI
Finance
- Other: Lot is approximately 0.11 acres
- Financial info: Semi-annual taxes reported
Exterior
- Parking: Oversized built-in garage; Driveway
- Utilities: Public water; Public sewer; Natural gas
- Home design: Duplex; Three or more levels; Single building on the lot
- Construction: Block foundation
- Exterior features: Block construction; Vinyl and wood windows; Shingle roof
Interior
- Bedrooms: Two units: one 1-bedroom unit and one 2-bedroom unit
- Bathrooms: Each unit has one full bathroom
- Heating & cooling: Forced air heating; Window unit cooling
- Interior features: Full basement; Porch and enclosed porch
Neighborhood map
What this means for you Summary
Snapshot
- This is a 2 × 3-bed/2.0-bath units multifamily listed at $210k.
Deal economics
- At list price, monthly cash flow is $641 ($8k/yr) — positive. Per door: $321/mo.
- The deal already cash-flows at list — no discount required.
- Meets the 1% rule at list price ($3k rent vs $210k).
- Cap rate 10.0% vs local median 4.4% in St. Bernard — top-decile yield for the area; either an underpriced asset or a hidden risk that comps aren't pricing in. Stress-test before assuming the spread holds.
Location & tenants
- Location reads: area grade B — affects rentability + tenant quality, not the cash-flow math above.
- St Bernard-Elmwood Place City (suburban): math 36% / reading 48% proficiency, ranked #529 of 656 in OH (top 81%) — families likely to look elsewhere, expect single-tenant / working-renter base with shorter leases; 69% free/reduced lunch — lower-income household profile, screen leases tightly.
- Market conditions: 29 active listings in the ZIP; 8 comparable units currently listed for rent nearby; rentals leasing fast (median 13d on market — plan ~1-2 weeks tenant-placement turnaround); 801 units permitted in Hamilton County in 2024 (190 in 5+ unit buildings).
- At $2,651/mo this rent would consume 51% of the median local household income ($62k/yr) (locally 388% of renters already pay >50% of income on rent) — very limited rent-growth headroom before tenants either downsize or default.
Forward outlook
- Local home prices are declining (-3.0%/yr); year-one equity from $1k of loan paydown is wiped out by about $6k of value loss. Plan a longer hold.
- At projected returns (-3.0% appreciation + 3.0% rent growth), your $59k cash investment doubles in ~9 years — after that, you're playing with house money.
Negotiation context
- Only 1 days on market — expect competitive offers; lowballing is unlikely to land.
- 4 sale attempts since 7y ago with the ask held roughly flat each time — persistent listings suggest the price (not the market) is what's stuck; bring a comps-based counter.
- Current owner paid $55k; list at $210k implies a 282% gain — meaningful room to come down on a strong offer.
Risks & watch-outs
- Watch-outs: built in 1925 — expect roof / HVAC / electrical / plumbing capex.
- Climate carrying-cost: extreme-heat days projected 7→19/yr by 2055 (HVAC capex compounding) — expect insurance premiums to compound above CPI over the hold.
Questions for the listing agent
- Can we see the unit-by-unit rent roll, current vacancy, and any below-market leases? What's the average tenancy length?
- What capital expenditures (roof, boiler, parking lot, exteriors) have been made in the last 5 years, and what's planned in the next 2?
- Built in 1925 — when were the roof, HVAC, electrical panel, plumbing, and water heater last replaced?
- Is there a deadline driving the sale (1031 exchange, divorce, estate, relocation)? That informs how much negotiation room exists.
- What's the average days-on-market for RENTAL listings here right now (not sales)? A rising rental-DOM trend means longer vacancies and softer asking-rent achievability than the comps imply.
- What's the recent tenant-quality profile in this submarket — average credit score on applications, eviction rate, late-payment / NSF rate, and stable-employment percentage? A property-management company in the area should have these aggregated.
- How much new apartment / multifamily construction is in the pipeline within 1–3 miles? Heavy new supply (>2% of stock underway) typically softens rents 12–24 months out; light construction supports rent growth.
Investment metrics
- 1% rule
- 1.26% ✓
- Cap rate
- 9.96%
- Cash-on-cash
- 13.08%
- DSCR
- 1.58
- GRM
- 6.6
CMA / ARV
- ARV (on-the-fly)
- $218,218
- Comps found
- 6
Show comp detail 6 sales within ~0.75 mi
| Address | Dist | Beds/Ba | Sqft | Sold | Price | $/sf | Match |
|---|---|---|---|---|---|---|---|
| 538 E Mitchell Ave | 0.22mi | 4/2.0 | 2,070 (+3%) | 6mo | $117,500 | $57 | 79 |
| 212 Mcclelland Ave | 0.42mi | 4/2.0 | 2,023 (+1%) | 14mo | $164,105 | $81 | 67 |
| 712 E Ross Ave | 0.47mi | 4/2.0 | 1,972 (-2%) | 13mo | $208,500 | $106 | 65 |
| 322 E Ross Ave | 0.46mi | 4/2.0 | 2,128 (+6%) | 11mo | $250,000 | $117 | 58 |
| 208 Delmar Ave | 0.29mi | 5/3.0 (+1) | 1,968 (-2%) | 23mo | $290,000 | $147 | 56 |
| 4338 Vine St | 0.65mi | 4/2.0 | 1,792 (-10%) | 5mo | $195,000 | $109 | 48 |
Match score weights: distance 35% · size 25% · config 20% · recency 20%. Top-matched comps best support the ARV.
Projected returns pro-forma
-3.0% appreciation · 3.0% rent growth · sell at horizon
- IRR
- 3.0%
- Equity multiple
- 1.12×
- Total profit
- $6,839
- Equity at exit
- $31,312
- IRR
- 12.6%
- Equity multiple
- 2.00×
- Total profit
- $58,695
- Equity at exit
- $18,157
Cash invested: $58,800 (down + closing). Projections, not guarantees.
Landlord ↔ Tenant lean methodology
- Overall (STATE)
- 73 Landlord-Friendly
- State Ohio
- 73 Landlord-Friendly · R+6
- County
- — inherits STATE
- City
- — inherits STATE
ZIP-level market 45217
- Home prices YoY
- -31.9%
- Active inventory
- 29
- Price-to-rent
- 13.2×
Monthly cashflow live
- Estimated rent
- $2,651 high interval (Pro) →
- Mortgage (P&I)
- −$1,101
- Tax from tax record
- −$265 /mo · $3,174/yr
- Insurance
- −$88
- HOA
- −$0
- Vacancy / Maint / Mgmt
- −$557
- Net cashflow
- $641
Break-even live
2-unit breakdown (identical units grouped — click to expand)
| Units | Beds | Baths | Est. rent |
|---|---|---|---|
| 2× units | 3 | 2 | $2,650 |
| #1 | 3 | 2 | $1,325 |
| #2 | 3 | 2 | $1,325 |
| Total (2 units) | $2,651 | ||
UW: 25.0% down · 7.5% · 30yr · 1.5% tax · 5.0% vac · 8.0% maint · 8.0% mgmt
Financing live
Cash to close
- Down payment
- $52,500
- Closing costs
- $6,300
- Reserves months
- —
- Total cash needed
- —
Loan-product check · same deal, 3 products live
Conventional
25% down · 7.5% · 30yr
- Down + closing
- —
- Monthly P&I
- —
- Monthly cashflow
- —
- DSCR
- —
- Eligible?
- —
Personal DTI + credit; lowest rate.
DSCR
20% down · 8.5% · 30yr
- Down + closing
- —
- Monthly P&I
- —
- Monthly cashflow
- —
- DSCR
- —
- Eligible?
- —
No personal income docs; deal must DSCR.
Hard money
10% down · 12.0% · 12mo
- Down + closing
- —
- Monthly P&I
- —
- Monthly cashflow
- —
- DSCR
- —
- Eligible?
- —
Short-term bridge; refi at stabilization.
Rent comps 8 comps
| Address | Beds | Baths | Sqft | Rent | $/sqft | DOM | Units | Dist |
|---|---|---|---|---|---|---|---|---|
| 15 Bertus St Cincinnati, OH | 3.0 | 2.0 | 1520 | $1,895 | $1.25 | 14d | 1 | 0.57mi |
| 1607 Asmann Ave Cincinnati, OH | 1.0–4.0 | 1.0–1.5 | 1069 | $1,695 | $1.58 | 12d | 6 | 0.95mi |
| 979 Burton Ave Cincinnati, OH | 3.0 | 1.0 | 1725 | $1,595 | $0.92 | 3d | 1 | 1.08mi |
| 3564 Estes Pl Unit 2 Cincinnati, OH | 3.0 | 1.0 | 1662 | $1,500 | $0.90 | 1d | 1 | 1.18mi |
| 1709 Sherman Ave Unit 2 Cincinnati, OH | 4.0 | 2.0 | 1500 | $2,300 | $1.53 | 1d | 1 | 1.25mi |
| 870 Rockdale Ave Cincinnati, OH | 4.0 | 2.0 | 1749 | $1,800 | $1.03 | 23d | 1 | 1.39mi |
| 570 Flatt Ter Cincinnati, OH | 3.0 | 2.0 | 1651 | $1,795 | $1.09 | 23d | 1 | 1.41mi |
| 434 Northern Ave Cincinnati, OH | 3.0 | 2.5 | 1518 | $2,700 | $1.78 | 4d | 1 | 1.45mi |
Listing history 2 events
-
2026-06-19remarks 632-char remark
-
2026-06-19$210,000 Active 1 DOM
ⓘ Source: listings_history table (triggers on properties + properties_extension) + one-shot
backfill from property_details.listing_events for pre-trigger history.
Tax reassessment forecast OH · Partial reset (capped growth)
- Current annual tax
- $3,174 · $265/mo
- Projected year-2 tax
- $3,225 · $269/mo
- Expected delta
- +$51/yr (+$4/mo · 1.6%)
ⓘ Screening estimate from a state-policy table — verify with the county assessor before closing.
Climate risk First Street
- Flood 1/10 Low FEMA zone X (unshaded) · 0% chance over 30 yrs
- Wildfire 1/10 Low
- Heat 5/10 Major 7 d/yr ≥103°F today · 19 d/yr by 30 yrs out
- Wind 2/10 Low 100% chance of damaging wind over 30 yrs
- Air quality 3/10 Moderate 2 unhealthy d/yr today · 3 by 30 yrs out
Nearby sold comps map
Loading sold comps map…
Walkable amenities ~0.75 mi
Loading nearby amenities…
Taxation est. · year 1
- Rental income
- $31,812
- − Mortgage interest
- −$11,763
- − Property taxes
- −$3,174
- − Insurance
- −$1,050
- − Repairs & maintenance
- −$2,545
- − Management
- −$2,545
- − Depreciation
- −$6,109
- Taxable income
- $4,626
- Est. tax owed @ 24.0%
- −$1,110
- After-tax cash flow
- $6,582/yr
For passive investors: Depreciation is non-cash, so a rental often shows a tax loss while cash-flowing — sheltering income. Rental losses are passive: they offset passive income freely, and up to $25,000/yr can offset ordinary (W-2) income if you actively participate and your MAGI is under $100k (phasing out to $0 by $150k); unused losses carry forward. On sale, claimed depreciation is recaptured at up to 25%, and gains may owe capital-gains tax (a 1031 exchange can defer both). Figures are a year-1 estimate at your 24.0% rate — not tax advice; consult a CPA.
Schools (NCES district)
- District
- St Bernard-Elmwood Place City
- NCES district ID
- 3904471
- Math proficiency
- 36% ▼ -11.00%
- Reading proficiency
- 48% ▼ -9.00%
- Median HH income
- $41,587
- Composite
- 35.3/100
- National rank
- #4966
- State rank
- #529 of 656 in OH
Livability — St. Bernard
No livability data for this city. (Only ~50 U.S. cities are tracked.)
Census & demographics
- Census place
- St. Bernard, OH
- County
- Hamilton County · 701,295 people
- City population
- 5,437
- Metro
- Cincinnati, OH-KY-IN
- Population (ZIP)
- 6,454
- Household income
- $62,200
- Rent vs Own
- Severe rent burden
- 388.0
Population outlook (Hamilton County) Hauer SSP2
- Today (2025)
- 826,054 people
- By 2030
- 830,947 · +0.6%
- By 2040
- 832,319 · +0.8%
- By 2050
- 822,428 · -0.4%
- By 2075
- 788,688 · -4.5%
- By 2100
- 710,674 · -14.0%
Race, ethnicity, and origin ACS 2023
- Neighborhood character
- Majority White (64%)
- Race & ethnicity
- White 64% Black 28% Hispanic / Latino 4% Two or more races 3% Asian 1%
- Common ancestry
- Iranian 2% Italian 1% Lithuanian 1%
- Foreign-born
- 3%
- Languages at home
- 96% English-only · Russian/Polish/Slavic 1% Spanish 1% Other Indo-European 1%
Political lean MEDSL · Hamilton
- 2024 margin
- D (+14.9) · D 57.0% · R 42.1%
- 2008→2024 swing
- +7.9pp toward D · 2008: 7.0pp · 2024: 14.9pp
- All cycles
- 2024: D+14.9 2020: D+15.9 2016: D+9.5 2012: D+4.9 2008: D+7.0
Not yet ingested
- Civics
- —
Market trends
- HPI YoY
- ▼ -100.98%
- Current HPI
- 215.4479
- Rent YoY
- —
- Metro
- Cincinnati, OH-KY-IN
- State GDP YoY
- ▲ 1.98%
- F500 in state
- 48
Industry mix (Fortune 500 HQ in OH)
| Industry | F500 HQs | Revenue |
|---|---|---|
| Insurance | 3 | $145B |
|
||
| Industrial Machinery | 3 | $49B |
|
||
| Financial Services | 3 | $24B |
|
||
| Consumer Goods | 2 | $93B |
|
||
| Aerospace / Defense | 2 | $47B |
|
||
| Utilities | 2 | $33B |
|
||
Price history
+162.8% since first listed9 events — show timeline
- 2026-06-18 Listed $210,000 Cincy MLS
- 2019-08-01 Sold (MLS) $55,000 Cincy MLS
- 2019-07-27 Contingent — Cincy MLS
- 2019-06-20 Price Changed $64,900 Cincy MLS
- 2019-05-08 Relisted — Cincy MLS
- 2019-04-18 Contingent — Cincy MLS
- 2019-03-29 Listing Removed — Cincy MLS
- 2019-03-28 Listed $69,900 Cincy MLS
- 2019-02-05 Listed $79,900 Cincy MLS
Property tax history
+7.6%/yrLatest (2025): $3,174 · -1.7% YoY. Source: county tax records.
Cash-flow waterfall
monthlySold comps — $/sqft
last 12 mo · ≤1 miLoading sold comps…