9459 State Route 335 · Beaver, OH
Flood risk 9/10 · Severe
- FEMA flood zone
- X (unshaded)
- Chance of flooding over 30 yrs
- 0.99%
- Est. flood insurance / yr
- $507 – $1,088
Fire risk 4/10 · Minor
- Est. fire insurance / yr
- $713 – $1,323
Heat risk 3/10 · Minor
- Hot days now (above 101°F)
- 7 days/yr
- Hot days in 30 yrs
- 18 days/yr
Wind risk 2/10 · Minimal
- Chance of severe wind over 30 yrs
- 1.0%
Air-quality risk 2/10 · Minimal
- Unhealthy air days now
- 0 days/yr
- Unhealthy air days in 30 yrs
- 1 days/yr
Risk factors via First Street. Map © Google.
Why this score? — see what drove the B+ grade
The composite is a weighted blend of 9 inputs, each scored 0–100. Each bar is that input's sub-score; the figure is the points it added to the 100-point composite (weight × sub-score).
- Cash flow +30.0/30.0
- 1% rule +10.0/10.0
- DSCR +10.0/10.0
- ARV discount +7.5/15.0
- Appreciation +5.5/10.0
- Schools +4.4/10.0
- Livability +2.9/5.0
- Rent growth +2.5/5.0
- Condition / age +2.5/5.0
$49,500
🖨 Deal sheet 📄 Offer letter ✓ Due diligence
Listing remarks
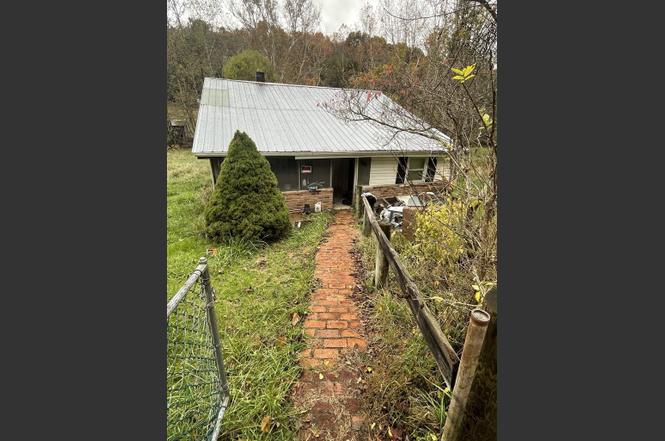
Investor’s special! This 3-bedroom, 1-bath, two-story home in Beaver, OH offers great potential for those ready to roll up their sleeves. Featuring a front porch, storage shed, and a spacious lot, this property is in need of some TLC but could make a great investment or renovation project. Bring your vision and make it shine!
Key facts
- Front porch
- Storage shed
- Spacious lot
Tags
Property features AI
Exterior
- Parking: No designated parking
- Home design: Single-family residence; 2 stories; Residential property
- Construction: Vinyl siding; Metal roof
- Exterior features: Front porch; Fenced yard; Stream on the property; Shed on the property; Level topography
Interior
- Bathrooms: 1 full bathroom
- Heating & cooling: Window unit cooling
- Interior features: 7 total rooms
Neighborhood map
What this means for you Summary
Snapshot
- This is a 2-bed/1.0-bath single-family listed at $50k.
Deal economics
- At list price, monthly cash flow is $446 ($5k/yr) — positive.
- The deal already cash-flows at list — no discount required.
- Meets the 1% rule at list price ($1k rent vs $50k).
- Recommended offer: $44k (12.0% below list) — sets the bar for market timing.
Location & tenants
- Location reads 58/100 on livability (#1,069 in OH) — a working-class tenant base; expect higher turnover. Strengths: cost of living A+; Watch: health & safety C-, schools D+, crime D+.
- Eastern Local School District (rural): math 48% / reading 57% proficiency, ranked #415 of 656 in OH (top 63%) — acceptable for families but not a draw, mixed tenant base, ~2y average lease.
- Market conditions: 11 active listings in the ZIP; lower-income renter base — watch delinquency; 45 units permitted in Pike County in 2024 (0 in 5+ unit buildings).
- This rent runs 35% of the median local income ($37k/yr) — at the standard rent-burdened threshold; future hikes will face affordability resistance.
Forward outlook
- In year one you build about $832 of equity ($342 loan paydown + $490 appreciation (1.0% local appreciation)).
- Pike County population projected at -21% by 2050 — secular population decline; favor cash flow + early exit over multi-decade hold.
- At projected returns (1.0% appreciation + 3.0% rent growth), your $14k cash investment doubles in ~3 years — after that, you're playing with house money.
Negotiation context
- It's been on market 216 days — a 12% lower offer ($44k) is reasonable based on typical stale-listing flexibility.
- 3 sale attempts; this cycle's ask has dropped $10k (18%) from the opening price — seller is motivated, your offer sets the floor, not the list.
- Current owner paid $35k; 41% above their basis — modest negotiation headroom, anchor on the comps not their cost.
Risks & watch-outs
- Watch-outs: flood insurance adds $66/mo.
- Climate carrying-cost: severe flood risk — expect insurance premiums to compound above CPI over the hold.
Questions for the listing agent
- It's been on market 216 days. Have you received any prior offers? Is the seller open to a 12% concession, seller financing, or rate buy-down credit?
- Built in 1963 — when were the roof, HVAC, electrical panel, plumbing, and water heater last replaced?
- What's the actual annual flood-insurance premium (NFIP or private), and is the property in a SFHA with mandatory coverage?
- Why hasn't it sold? Are there any deal-killer items the seller is aware of (foundation, flood, title, zoning, code violations)?
- Is there a deadline driving the sale (1031 exchange, divorce, estate, relocation)? That informs how much negotiation room exists.
- Schools are D-rated, which usually means shorter tenancies and higher turnover. Who's the typical renter profile here, and what's been the actual vacancy rate?
- Crime grade is D in this area — have there been break-ins, vandalism, or insurance claims at this property in the last 3 years? What carrier currently insures it and at what premium?
- What's the average days-on-market for RENTAL listings here right now (not sales)? A rising rental-DOM trend means longer vacancies and softer asking-rent achievability than the comps imply.
- What's the recent tenant-quality profile in this submarket — average credit score on applications, eviction rate, late-payment / NSF rate, and stable-employment percentage? A property-management company in the area should have these aggregated.
- How much new for-sale + rental construction is in the pipeline within 1–3 miles? Heavy new supply typically softens prices + rents 12–24 months out; constrained supply supports both.
Investment metrics
- 1% rule
- 2.16% ✓
- Cap rate
- 18.73%
- Cash-on-cash
- 44.40%
- DSCR
- 2.98
- GRM
- 3.9
CMA / ARV
No comps found within radius.
Projected returns pro-forma
0.99% appreciation · 3.0% rent growth · sell at horizon
- IRR
- 41.2%
- Equity multiple
- 3.12×
- Total profit
- $29,387
- Equity at exit
- $16,875
- IRR
- 43.2%
- Equity multiple
- 6.17×
- Total profit
- $71,678
- Equity at exit
- $22,406
Cash invested: $13,860 (down + closing). Projections, not guarantees.
Landlord ↔ Tenant lean methodology
- Overall (STATE)
- 73 Landlord-Friendly
- State Ohio
- 73 Landlord-Friendly · R+6
- County
- — inherits STATE
- City
- — inherits STATE
ZIP-level market 45613
- Home prices YoY
- 0.5%
- Active inventory
- 11
- Price-to-rent
- 3.9×
Monthly cashflow live
- Estimated rent
- $1,071 medium interval (Pro) →
- Mortgage (P&I)
- −$260
- Tax from tax record
- −$53 /mo · $633/yr
- Insurance
- −$21
- Flood insurance flood zone
- −$66 /mo · $798/yr
- HOA
- −$0
- Vacancy / Maint / Mgmt
- −$225
- Net cashflow
- $446
Break-even live
UW: 25.0% down · 7.5% · 30yr · 1.5% tax · 5.0% vac · 8.0% maint · 8.0% mgmt
Financing live
Cash to close
- Down payment
- $12,375
- Closing costs
- $1,485
- Reserves months
- —
- Total cash needed
- —
Loan-product check · same deal, 3 products live
Conventional
25% down · 7.5% · 30yr
- Down + closing
- —
- Monthly P&I
- —
- Monthly cashflow
- —
- DSCR
- —
- Eligible?
- —
Personal DTI + credit; lowest rate.
DSCR
20% down · 8.5% · 30yr
- Down + closing
- —
- Monthly P&I
- —
- Monthly cashflow
- —
- DSCR
- —
- Eligible?
- —
No personal income docs; deal must DSCR.
Hard money
10% down · 12.0% · 12mo
- Down + closing
- —
- Monthly P&I
- —
- Monthly cashflow
- —
- DSCR
- —
- Eligible?
- —
Short-term bridge; refi at stabilization.
Listing history 10 events
-
2026-06-18days on market $49,500 Active 216 DOM
-
2026-06-17days on market $49,500 Active 215 DOM
-
2026-06-16days on market $49,500 Active 214 DOM
-
2026-06-15days on market $49,500 Active 213 DOM
-
2026-06-13days on market $49,500 Active 211 DOM
-
2026-06-12days on market $49,500 Active 210 DOM
-
2026-06-09days on market $49,500 Active 207 DOM
-
2026-06-08days on market $49,500 Active 206 DOM
-
2026-06-08remarks 327-char remark
-
2026-06-08$49,500 Active 205 DOM
ⓘ Source: listings_history table (triggers on properties + properties_extension) + one-shot
backfill from property_details.listing_events for pre-trigger history.
Tax reassessment forecast OH · Partial reset (capped growth)
- Current annual tax
- $633 · $53/mo
- Projected year-2 tax
- $702 · $59/mo
- Expected delta
- +$70/yr (+$6/mo · 11.0%)
ⓘ Screening estimate from a state-policy table — verify with the county assessor before closing.
Climate risk First Street
- Flood 9/10 Extreme FEMA zone X (unshaded) · 99% chance over 30 yrs
- Wildfire 4/10 Moderate
- Heat 3/10 Moderate 7 d/yr ≥101°F today · 18 d/yr by 30 yrs out
- Wind 2/10 Low 100% chance of damaging wind over 30 yrs
- Air quality 2/10 Low 0 unhealthy d/yr today · 1 by 30 yrs out
Nearby sold comps map
Loading sold comps map…
Walkable amenities ~0.75 mi
Loading nearby amenities…
Taxation est. · year 1
- Rental income
- $12,848
- − Mortgage interest
- −$2,773
- − Property taxes
- −$633
- − Insurance
- −$1,045
- − Repairs & maintenance
- −$1,028
- − Management
- −$1,028
- − Depreciation
- −$1,440
- Taxable income
- $4,902
- Est. tax owed @ 24.0%
- −$1,176
- After-tax cash flow
- $4,181/yr
For passive investors: Depreciation is non-cash, so a rental often shows a tax loss while cash-flowing — sheltering income. Rental losses are passive: they offset passive income freely, and up to $25,000/yr can offset ordinary (W-2) income if you actively participate and your MAGI is under $100k (phasing out to $0 by $150k); unused losses carry forward. On sale, claimed depreciation is recaptured at up to 25%, and gains may owe capital-gains tax (a 1031 exchange can defer both). Figures are a year-1 estimate at your 24.0% rate — not tax advice; consult a CPA.
Schools (NCES district)
- District
- Eastern Local School District
- NCES district ID
- 3904912
- Math proficiency
- 48% ▼ -10.00%
- Reading proficiency
- 57% ▼ -3.00%
- Median HH income
- $42,279
- Composite
- 44.09/100
- National rank
- #2873
- State rank
- #415 of 656 in OH
Livability — Beaver
- Score
- 58/100
- State rank
- #1069
- US rank
- #21333
Category grades
Schools grade is shown separately in the Schools card above.
Census & demographics
- County
- Pike · 24,348 people
- Population (ZIP)
- 3,331
- Household income
- $36,855
- Rent vs Own
- Severe rent burden
- 19.5
Population outlook (Pike County) Hauer SSP2
- Today (2025)
- 26,762 people
- By 2030
- 25,744 · -3.8%
- By 2040
- 23,509 · -12.2%
- By 2050
- 21,090 · -21.2%
- By 2075
- 15,765 · -41.1%
- By 2100
- 11,361 · -57.5%
Race, ethnicity, and origin ACS 2023
- Neighborhood character
- Predominantly White (93%)
- Race & ethnicity
- White 93% Two or more races 4% Hispanic / Latino 2% Asian 2%
- Common ancestry
- Scottish 4% Slovak 1% Italian 1%
- Foreign-born
- 1%
- Languages at home
- 97% English-only · German/W. Germanic 1% Other Asian/Pacific 1% Korean 1%
Political lean MEDSL · Pike
- 2024 margin
- Solid R (+53.7) · D 22.9% · R 76.5%
- 2008→2024 swing
- -52.6pp toward R · 2008: -1.0pp · 2024: -53.7pp
- All cycles
- 2024: R+53.7 2020: R+48.7 2016: R+36.7 2012: R+0.4 2008: R+1.0
Not yet ingested
- Civics
- —
Market trends
- HPI YoY
- ▲ 0.99%
- Current HPI
- 199.2226
- Rent YoY
- —
- Metro
- —
- State GDP YoY
- ▲ 1.98%
- F500 in state
- 48
Industry mix (Fortune 500 HQ in OH)
| Industry | F500 HQs | Revenue |
|---|---|---|
| Insurance | 3 | $145B |
|
||
| Industrial Machinery | 3 | $49B |
|
||
| Financial Services | 3 | $24B |
|
||
| Consumer Goods | 2 | $93B |
|
||
| Aerospace / Defense | 2 | $47B |
|
||
| Utilities | 2 | $33B |
|
||
Price history
+41.4% since first listed6 events — show timeline
- 2026-05-11 Relisted — AABOR
- 2026-05-11 Price Changed $49,500 AABOR
- 2026-02-06 Relisted — AABOR
- 2025-12-10 Price Changed $56,900 AABOR
- 2025-11-05 Listed $60,000 AABOR
- 2017-06-09 Sold (Public Records) $35,000 Public Records
Property tax history
+13.1%/yrLatest (2025): $633 · +114.7% YoY. Source: county tax records.
Cash-flow waterfall
monthlySold comps — $/sqft
last 12 mo · ≤1 miLoading sold comps…