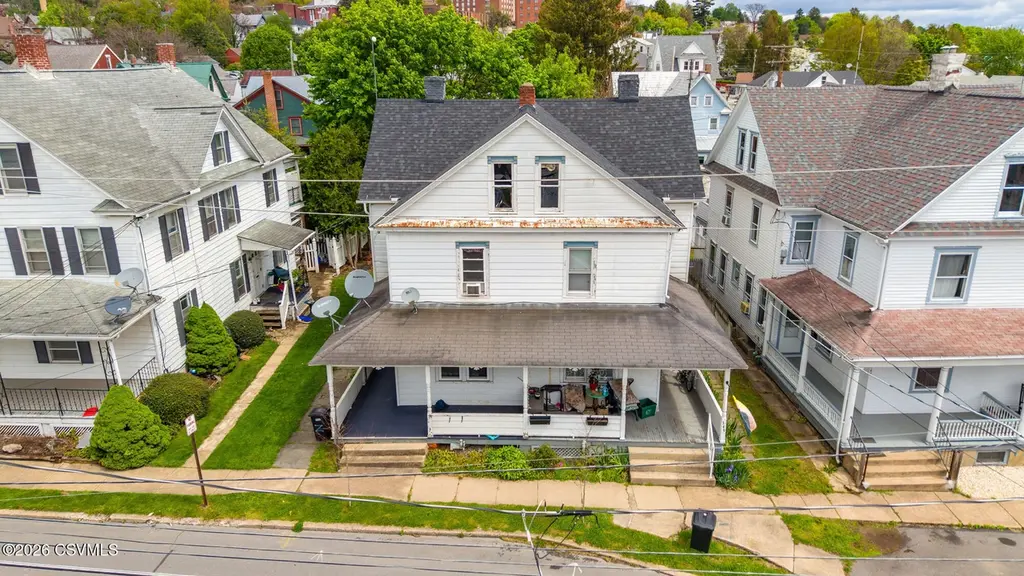
339-343 Catherine St · Bloomsburg, PA
Flood risk 1/10 · Minimal
- FEMA flood zone
- X (unshaded)
- Chance of flooding over 30 yrs
- 0.0%
- Est. flood insurance / yr
- $473 – $860
Fire risk 1/10 · Minimal
- Est. fire insurance / yr
- $511 – $949
Heat risk 4/10 · Minor
- Hot days now (above 98°F)
- 7 days/yr
- Hot days in 30 yrs
- 16 days/yr
Wind risk 2/10 · Minimal
- Chance of severe wind over 30 yrs
- 4.0%
Air-quality risk 2/10 · Minimal
- Unhealthy air days now
- 1 days/yr
- Unhealthy air days in 30 yrs
- 2 days/yr
Risk factors via First Street. Map © Google.
Why this score? — see what drove the C grade
The composite is a weighted blend of 9 inputs, each scored 0–100. Each bar is that input's sub-score; the figure is the points it added to the 100-point composite (weight × sub-score).
- Cash flow +18.8/30.0
- ARV discount +15.0/15.0
- DSCR +5.9/10.0
- 1% rule +5.1/10.0
- Rent growth +4.2/5.0
- Livability +4.1/5.0
- Schools +3.7/10.0
- Condition / age +2.5/5.0
- Appreciation +0.0/10.0
$174,000
🖨 Deal sheet 📄 Offer letter ✓ Due diligence
Listing remarks
Income-producing multi-unit in a convenient Bloomsburg location with steady cash flow in place. Situated just minutes from downtown Bloomsburg, this property offers easy access to shops, restaurants, Bloomsburg University, and Geisinger, making it an appealing spot for tenants. It has been maintained over the years and includes a new roof in 2024 along with replacement windows. Each unit offers a functional layout with good usable space, supporting consistent occupancy. A solid opportunity for investors looking to grow their portfolio with a dependable, income-producing property in a location that continues to see strong rental demand. Call Mike or Samantha Capita to schedule a private tour
Key facts
- Bloomsburg location
- Easy access to shops
- New roof
Tags
Property features AI
Finance
- Other: Zoning: RU
Exterior
- Parking: No parking
- Utilities: Public water; Public sewer
- Home design: Residential income property; Multi-unit
- Construction: Aluminum siding; Wood siding; Frame construction; No foundation details provided
- Exterior features: Shingle roof; Sidewalks
Interior
- Kitchen: Range
- Bathrooms: 3 full bathrooms; 1 three-quarter bathroom
- Heating & cooling: Heating present
- Interior features: Range; Water heater; Has heating
Neighborhood map
What this means for you Summary
Snapshot
- This is a 6-bed/3.9-bath other listed at $174k.
Deal economics
- At list price, monthly cash flow is $176 ($2k/yr) — positive.
- The deal already cash-flows at list — no discount required.
- Meets the 1% rule at list price ($2k rent vs $174k).
- Recommended offer: $169k (3.0% below list) — sets the bar for market timing.
- Cap rate 7.5% vs local median 3.8% in Bloomsburg — top-decile yield for the area; either an underpriced asset or a hidden risk that comps aren't pricing in. Stress-test before assuming the spread holds.
Location & tenants
- Location reads 82/100 on livability (#147 in PA, #1,183 nationally) — a professional / high-income tenant draw. Strengths: amenities A+, cost of living A+, housing A+; Watch: employment D, commute F.
- Bloomsburg Area SD (urban): math 33% / reading 57% proficiency, ranked #289 of 539 in PA (top 54%) — families likely to look elsewhere, expect single-tenant / working-renter base with shorter leases.
- Market conditions: Rents rising fast (+6.8%/yr); 121 active listings in the ZIP; 82 units permitted in Columbia County in 2024 (0 in 5+ unit buildings).
- This rent runs 31% of the median local income ($68k/yr) — at the standard rent-burdened threshold; future hikes will face affordability resistance.
Forward outlook
- Local home prices are declining (-3.0%/yr); year-one equity from $1k of loan paydown is wiped out by about $5k of value loss. Plan a longer hold.
- Columbia County population projected at -12% by 2050 — secular population decline; favor cash flow + early exit over multi-decade hold.
- At projected returns (-3.0% appreciation + 6.8% rent growth), your $49k cash investment doubles in ~10 years — after that, you're playing with house money.
Negotiation context
- It's been on market 49 days — a 3% lower offer ($169k) is reasonable based on typical stale-listing flexibility.
- 2 sale attempts since 7y ago with the ask held roughly flat each time — persistent listings suggest the price (not the market) is what's stuck; bring a comps-based counter.
- Current owner paid $120k; 45% above their basis — modest negotiation headroom, anchor on the comps not their cost.
Risks & watch-outs
- Watch-outs: built in 1900 — expect roof / HVAC / electrical / plumbing capex.
Questions for the listing agent
- It's been on market 49 days. Have you received any prior offers? Is the seller open to a 3% concession, seller financing, or rate buy-down credit?
- Built in 1900 — when were the roof, HVAC, electrical panel, plumbing, and water heater last replaced?
- Is there a deadline driving the sale (1031 exchange, divorce, estate, relocation)? That informs how much negotiation room exists.
- Schools are B-rated — typically a magnet for longer-tenancy family renters. What's the average tenant stay here, and is there a school-zone premium baked into asking?
- What's the average days-on-market for RENTAL listings here right now (not sales)? A rising rental-DOM trend means longer vacancies and softer asking-rent achievability than the comps imply.
- What's the recent tenant-quality profile in this submarket — average credit score on applications, eviction rate, late-payment / NSF rate, and stable-employment percentage? A property-management company in the area should have these aggregated.
- How much new for-sale + rental construction is in the pipeline within 1–3 miles? Heavy new supply typically softens prices + rents 12–24 months out; constrained supply supports both.
Investment metrics
- 1% rule
- 1.01% ✓
- Cap rate
- 7.51%
- Cash-on-cash
- 4.34%
- DSCR
- 1.19
- GRM
- 8.2
CMA / ARV
- ARV (median comp)
- $261,203
- List price
- $174,000
- Delta
- -33.39%
- Verdict
- UNDERPRICED
- Comps
- 20 within 1.0 mi
Projected returns pro-forma
-3.0% appreciation · 6.8% rent growth · sell at horizon
- IRR
- -5.3%
- Equity multiple
- 0.80×
- Total profit
- $-9,954
- Equity at exit
- $25,944
- IRR
- 8.5%
- Equity multiple
- 1.76×
- Total profit
- $36,909
- Equity at exit
- $15,044
Cash invested: $48,720 (down + closing). Projections, not guarantees.
Landlord ↔ Tenant lean methodology
- Overall (STATE)
- 62 Landlord-Friendly
- State Pennsylvania
- 62 Landlord-Friendly · EVEN
- County
- — inherits STATE
- City
- — inherits STATE
ZIP-level market 17815
- Home prices YoY
- -33.0%
- Rents YoY
- 6.8%
- Active inventory
- 121
- Price-to-rent
- 8.2×
Monthly cashflow live
- Estimated rent
- $1,759 medium interval (Pro) →
- Mortgage (P&I)
- −$912
- Tax from tax record
- −$228 /mo · $2,740/yr
- Insurance
- −$72
- HOA
- −$0
- Vacancy / Maint / Mgmt
- −$369
- Net cashflow
- $176
Break-even live
UW: 25.0% down · 7.5% · 30yr · 1.5% tax · 5.0% vac · 8.0% maint · 8.0% mgmt
Financing live
Cash to close
- Down payment
- $43,500
- Closing costs
- $5,220
- Reserves months
- —
- Total cash needed
- —
Loan-product check · same deal, 3 products live
Conventional
25% down · 7.5% · 30yr
- Down + closing
- —
- Monthly P&I
- —
- Monthly cashflow
- —
- DSCR
- —
- Eligible?
- —
Personal DTI + credit; lowest rate.
DSCR
20% down · 8.5% · 30yr
- Down + closing
- —
- Monthly P&I
- —
- Monthly cashflow
- —
- DSCR
- —
- Eligible?
- —
No personal income docs; deal must DSCR.
Hard money
10% down · 12.0% · 12mo
- Down + closing
- —
- Monthly P&I
- —
- Monthly cashflow
- —
- DSCR
- —
- Eligible?
- —
Short-term bridge; refi at stabilization.
Listing history 19 events
-
2026-06-19days on market $174,000 Active 49 DOM
-
2026-06-18days on market $174,000 Active 48 DOM
-
2026-06-17days on market $174,000 Active 47 DOM
-
2026-06-16days on market $174,000 Active 46 DOM
-
2026-06-15days on market $174,000 Active 45 DOM
-
2026-06-14days on market $174,000 Active 43 DOM
-
2026-06-12days on market $174,000 Active 42 DOM
-
2026-06-09days on market $174,000 Active 39 DOM
-
2026-06-08days on market $174,000 Active 38 DOM
-
2026-06-07days on market $174,000 Active 37 DOM
-
2026-06-05pricedays on market $174,000 Active 34 DOM
-
2026-06-02days on market $179,000 Active 32 DOM
-
2026-06-01days on market $179,000 Active 31 DOM
-
2026-05-31days on market $179,000 Active 30 DOM
-
2026-05-30days on market $179,000 Active 29 DOM
-
2026-05-01$179,000 Active 700-char remark
-
2019-05-20$119,000
-
2007-09-04soldstatus $120,000
-
2005-01-05soldstatus $63,000
ⓘ Source: listings_history table (triggers on properties + properties_extension) + one-shot
backfill from property_details.listing_events for pre-trigger history.
Tax reassessment forecast PA · Partial reset (capped growth)
- Current annual tax
- $2,740 · $228/mo
- Projected year-2 tax
- $2,745 · $229/mo
- Expected delta
- +$5/yr ($0/mo · 0.2%)
ⓘ Screening estimate from a state-policy table — verify with the county assessor before closing.
Climate risk First Street
- Flood 1/10 Low FEMA zone X (unshaded) · 0% chance over 30 yrs
- Wildfire 1/10 Low
- Heat 4/10 Moderate 7 d/yr ≥98°F today · 16 d/yr by 30 yrs out
- Wind 2/10 Low 4% chance of damaging wind over 30 yrs
- Air quality 2/10 Low 1 unhealthy d/yr today · 2 by 30 yrs out
Nearby sold comps map
Loading sold comps map…
Walkable amenities ~0.75 mi
Loading nearby amenities…
Taxation est. · year 1
- Rental income
- $21,108
- − Mortgage interest
- −$9,747
- − Property taxes
- −$2,740
- − Insurance
- −$870
- − Repairs & maintenance
- −$1,689
- − Management
- −$1,689
- − Depreciation
- −$5,062
- Taxable loss
- −$688
- Est. tax savings @ 24.0%
- +$165
- After-tax cash flow
- $2,280/yr
For passive investors: Depreciation is non-cash, so a rental often shows a tax loss while cash-flowing — sheltering income. Rental losses are passive: they offset passive income freely, and up to $25,000/yr can offset ordinary (W-2) income if you actively participate and your MAGI is under $100k (phasing out to $0 by $150k); unused losses carry forward. On sale, claimed depreciation is recaptured at up to 25%, and gains may owe capital-gains tax (a 1031 exchange can defer both). Figures are a year-1 estimate at your 24.0% rate — not tax advice; consult a CPA.
Schools (NCES district)
- District
- Bloomsburg Area SD
- NCES district ID
- 4203840
- Math proficiency
- 33% ▼ -11.00%
- Reading proficiency
- 57% ▼ -8.00%
- Median HH income
- $37,973
- Composite
- 37.39/100
- National rank
- #4428
- State rank
- #289 of 539 in PA
Livability — Bloomsburg
- Score
- 82/100
- State rank
- #147
- US rank
- #1183
Category grades
Schools grade is shown separately in the Schools card above.
Census & demographics
- Census place
- Bloomsburg, PA
- County
- Columbia County · 29,790 people
- City population
- 29,790
- Metro
- Bloomsburg-Berwick, PA
- Population (ZIP)
- 29,790
- Household income
- $67,510
- Rent vs Own
- Severe rent burden
- 801.0
Population outlook (Columbia County) Hauer SSP2
- Today (2025)
- 65,170 people
- By 2030
- 64,054 · -1.7%
- By 2040
- 61,131 · -6.2%
- By 2050
- 57,526 · -11.7%
- By 2075
- 50,259 · -22.9%
- By 2100
- 44,756 · -31.3%
Race, ethnicity, and origin ACS 2023
- Neighborhood character
- Predominantly White (89%)
- Race & ethnicity
- White 89% Hispanic / Latino 5% Two or more races 4% Black 2% Asian 2%
- Common ancestry
- Romanian 5% Iranian 2% Polish 2%
- Foreign-born
- 3% · Canada, China
- Languages at home
- 97% English-only · Spanish 1% Other Indo-European 1% German/W. Germanic 1%
Political lean MEDSL · Columbia
- 2024 margin
- Solid R (+31.0) · D 34.0% · R 65.0%
- 2008→2024 swing
- -26.6pp toward R · 2008: -4.5pp · 2024: -31.0pp
- All cycles
- 2024: R+31.0 2020: R+30.7 2016: R+32.8 2012: R+12.4 2008: R+4.5
Not yet ingested
- Civics
- —
Market trends
- HPI YoY
- ▼ -108.98%
- Current HPI
- 220.8076
- Rent YoY
- ▲ 6.80%
- Metro
- Bloomsburg-Berwick, PA
- State GDP YoY
- ▲ 1.68%
- F500 in state
- 34
Industry mix (Fortune 500 HQ in PA)
| Industry | F500 HQs | Revenue |
|---|---|---|
| Healthcare | 2 | $309B |
|
||
| Insurance | 2 | $27B |
|
||
| Telecommunications / Media | 1 | $124B |
|
||
| Industrial Distribution | 1 | $22B |
|
||
| Financial Services | 1 | $20B |
|
||
| Chemicals / Materials | 1 | $18B |
|
||
Price history
+176.2% since first listed5 events — show timeline
- 2026-06-03 Price Changed $174,000 CSVBR
- 2026-05-01 Listed $179,000 CSVBR
- 2019-05-20 Listed $119,000 CSVBR
- 2007-09-04 Sold (Public Records) $120,000 Public Records
- 2005-01-05 Sold (Public Records) $63,000 Public Records
Property tax history
+4.2%/yrLatest (2026): $2,740 · +6.1% YoY. Source: county tax records.
Cash-flow waterfall
monthlySold comps — $/sqft
last 12 mo · ≤1 miLoading sold comps…