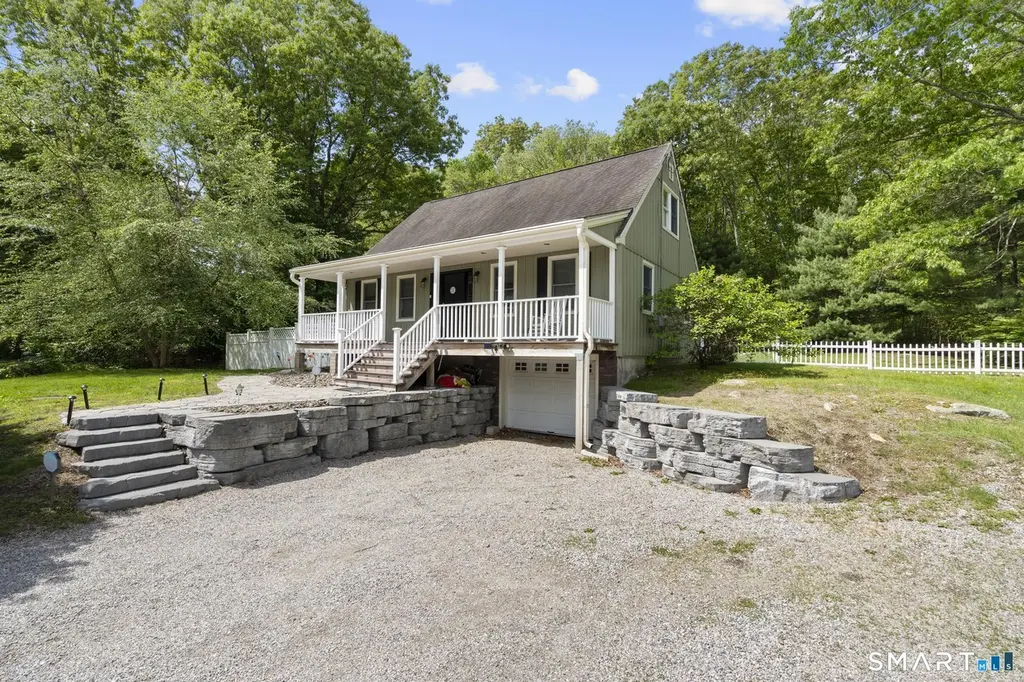
13 Christy Hill Rd · Gales Ferry, CT
Flood risk 1/10 · Minimal
- FEMA flood zone
- X (unshaded)
- Chance of flooding over 30 yrs
- 0.0%
- Est. flood insurance / yr
- $507 – $1,088
Fire risk 3/10 · Minor
- Est. fire insurance / yr
- $829 – $1,539
Heat risk 5/10 · Moderate
- Hot days now (above 96°F)
- 7 days/yr
- Hot days in 30 yrs
- 16 days/yr
Wind risk 8/10 · Major
- Chance of severe wind over 30 yrs
- 80.0%
Air-quality risk 3/10 · Minor
- Unhealthy air days now
- 3 days/yr
- Unhealthy air days in 30 yrs
- 4 days/yr
Risk factors via First Street. Map © Google.
Why this score? — see what drove the C grade
The composite is a weighted blend of 9 inputs, each scored 0–100. Each bar is that input's sub-score; the figure is the points it added to the 100-point composite (weight × sub-score).
- Cash flow +21.6/30.0
- ARV discount +9.9/15.0
- DSCR +6.9/10.0
- 1% rule +5.5/10.0
- Schools +3.9/10.0
- Livability +3.9/5.0
- Rent growth +2.5/5.0
- Condition / age +2.5/5.0
- Appreciation +0.0/10.0
$369,990
🖨 Deal sheet 📄 Offer letter ✓ Due diligence
Listing remarks
UPDATE: OPEN TOUR HAS BEEN CANCELLED, OFFER HAS BEEN ACCEPTED ||| Welcome to 13 Christy Hill Rd! This home offers the perfect blend of peace of mind and modern comfort. This beautifully renovated 4-bedroom, 1-bath home has already had all the major updates taken care of - including a newer roof, well pump, septic system, electric dog fence, and siding - making it truly move-in ready. All warranties transferable with sale! The home also features a partial basement offering plenty of storage space, along with an attached garage for added convenience. Nestled in the desirable Gales Ferry area, you'll enjoy a quiet neighborhood setting while staying conveniently close to major employers like El
Key facts
- Attached garage
- Newer roof
- Well pump
Tags
Property features AI
Exterior
- Parking: Attached garage; Paved surfaces with off-street parking; Two total parking spaces (one garage)
- Utilities: Private well; Septic (and public sewer in street); Oil fuel tank located in basement
- Home design: Single-family home
- Construction: Frame construction; Concrete foundation
- Exterior features: Lightly wooded, level lot; Vinyl siding; Asphalt shingle roof
Interior
- Kitchen: Cooktop; Refrigerator; Dishwasher
- Bedrooms: Four bedrooms
- Bathrooms: One full bathroom
- Heating & cooling: Hot water heating; Oil-fired heat; Thermopane windows (energy efficient)
- Interior features: Six total rooms; Partial, unfinished basement
- Laundry & utility: Washer; Dryer; 30-gallon oil hot water tank
Neighborhood map
What this means for you Summary
Snapshot
- This is a 4-bed/1.0-bath single-family listed at $370k.
Deal economics
- At list price, monthly cash flow is $561 ($7k/yr) — positive.
- The deal already cash-flows at list — no discount required.
- Meets the 1% rule at list price ($4k rent vs $370k).
- Cap rate 8.1% vs local median 5.1% in Gales Ferry — top-decile yield for the area; either an underpriced asset or a hidden risk that comps aren't pricing in. Stress-test before assuming the spread holds.
Location & tenants
- Location reads 78/100 on livability (#40 in CT, #2,751 nationally) — a middle-class / working-renter tenant base. Strengths: crime A+, employment A+, housing A+; Watch: cost of living D+, amenities F, commute F.
- Ledyard School District (rural): math 34% / reading 49% proficiency, ranked #92 of 153 in CT (top 60%) — families likely to look elsewhere, expect single-tenant / working-renter base with shorter leases; only 15% free/reduced lunch — higher-income household profile.
- Market conditions: 31 active listings in the ZIP; 1 comparable units currently listed for rent nearby; 487 units permitted in Southeastern Connecticut Planning Region in 2024 (244 in 5+ unit buildings).
Forward outlook
- Local home prices are declining (-3.0%/yr); year-one equity from $3k of loan paydown is wiped out by about $11k of value loss. Plan a longer hold.
Negotiation context
- Only 4 days on market — expect competitive offers; lowballing is unlikely to land.
- 3 sale attempts since 7y ago with the ask held roughly flat each time — persistent listings suggest the price (not the market) is what's stuck; bring a comps-based counter.
- Current owner paid $200k; list at $370k implies a 85% gain — meaningful room to come down on a strong offer.
Risks & watch-outs
- Climate carrying-cost: severe wind risk, 80% chance of damaging wind over 30y; extreme-heat days projected 7→16/yr by 2055 (HVAC capex compounding) — expect insurance premiums to compound above CPI over the hold.
Questions for the listing agent
- Built in 1960 — when were the roof, HVAC, electrical panel, plumbing, and water heater last replaced?
- Is there a deadline driving the sale (1031 exchange, divorce, estate, relocation)? That informs how much negotiation room exists.
- Schools are B-rated — typically a magnet for longer-tenancy family renters. What's the average tenant stay here, and is there a school-zone premium baked into asking?
- What's the average days-on-market for RENTAL listings here right now (not sales)? A rising rental-DOM trend means longer vacancies and softer asking-rent achievability than the comps imply.
- What's the recent tenant-quality profile in this submarket — average credit score on applications, eviction rate, late-payment / NSF rate, and stable-employment percentage? A property-management company in the area should have these aggregated.
- How much new for-sale + rental construction is in the pipeline within 1–3 miles? Heavy new supply typically softens prices + rents 12–24 months out; constrained supply supports both.
Investment metrics
- 1% rule
- 1.05% ✓
- Cap rate
- 8.11%
- Cash-on-cash
- 6.49%
- DSCR
- 1.29
- GRM
- 7.9
CMA / ARV
- ARV (on-the-fly)
- $390,944
- Comps found
- 6
Show comp detail 6 sales within ~0.75 mi
| Address | Dist | Beds/Ba | Sqft | Sold | Price | $/sf | Match |
|---|---|---|---|---|---|---|---|
| 13 Hillside Dr | 0.31mi | 3/2.0 (-1) | 1,248 (-3%) | 1mo | $425,000 | $341 | 71 |
| 5 Christy Hill Rd | 0.07mi | 3/1.0 (-1) | 1,118 (-13%) | 16mo | $340,000 | $304 | 57 |
| 9 West Dr | 0.43mi | 4/1.5 | 1,130 (-12%) | 4mo | $409,900 | $363 | 54 |
| 11 Ledgewood Dr | 0.39mi | 3/1.5 (-1) | 1,450 (+13%) | 10mo | $330,750 | $228 | 45 |
| 28 Laurel Leaf Dr | 0.34mi | 3/2.0 (-1) | 1,438 (+12%) | 17mo | $280,000 | $195 | 41 |
| 844 Long Cove Rd | 0.28mi | 3/2.0 (-1) | 1,432 (+11%) | 22mo | $398,000 | $278 | 41 |
Match score weights: distance 35% · size 25% · config 20% · recency 20%. Top-matched comps best support the ARV.
Projected returns pro-forma
-3.0% appreciation · 3.0% rent growth · sell at horizon
- IRR
- -6.3%
- Equity multiple
- 0.77×
- Total profit
- $-24,215
- Equity at exit
- $55,167
- IRR
- 3.3%
- Equity multiple
- 1.24×
- Total profit
- $25,035
- Equity at exit
- $31,990
Cash invested: $103,597 (down + closing). Projections, not guarantees.
Landlord ↔ Tenant lean methodology
- Overall (STATE)
- 27 Tenant-Leaning
- State Connecticut
- 27 Tenant-Leaning · D+7
- County
- — inherits STATE
- City
- — inherits STATE
ZIP-level market 06335
- Home prices YoY
- -22.0%
- Active inventory
- 31
- Price-to-rent
- 7.9×
Monthly cashflow live
- Estimated rent
- $3,900 medium interval (Pro) →
- Mortgage (P&I)
- −$1,940
- Tax from tax record
- −$426 /mo · $5,112/yr
- Insurance
- −$154
- HOA
- −$0
- Vacancy / Maint / Mgmt
- −$819
- Net cashflow
- $561
Break-even live
UW: 25.0% down · 7.5% · 30yr · 1.5% tax · 5.0% vac · 8.0% maint · 8.0% mgmt
Financing live
Cash to close
- Down payment
- $92,498
- Closing costs
- $11,100
- Reserves months
- —
- Total cash needed
- —
Loan-product check · same deal, 3 products live
Conventional
25% down · 7.5% · 30yr
- Down + closing
- —
- Monthly P&I
- —
- Monthly cashflow
- —
- DSCR
- —
- Eligible?
- —
Personal DTI + credit; lowest rate.
DSCR
20% down · 8.5% · 30yr
- Down + closing
- —
- Monthly P&I
- —
- Monthly cashflow
- —
- DSCR
- —
- Eligible?
- —
No personal income docs; deal must DSCR.
Hard money
10% down · 12.0% · 12mo
- Down + closing
- —
- Monthly P&I
- —
- Monthly cashflow
- —
- DSCR
- —
- Eligible?
- —
Short-term bridge; refi at stabilization.
Rent comps 1 comps
| Address | Beds | Baths | Sqft | Rent | $/sqft | DOM | Units | Dist |
|---|---|---|---|---|---|---|---|---|
| 30 Terry Rd Gales Ferry, CT | 4.0 | 3.0 | 1818 | $3,900 | $2.15 | 13d | 1 | 0.82mi |
Listing history 10 events
-
2026-05-24$369,990 Active
-
2020-07-16soldstatus $200,000
-
2019-11-15historical
-
2019-11-14price $199,900
-
2019-11-01price $209,900
-
2019-10-03status Active
-
2019-09-20historical Under Contract - Continue to Show
-
2019-09-09$214,900 Active
-
2016-11-07soldstatus $200,000
-
1997-12-30soldstatus $96,000
ⓘ Source: listings_history table (triggers on properties + properties_extension) + one-shot
backfill from property_details.listing_events for pre-trigger history.
Tax reassessment forecast CT · Partial reset (capped growth)
- Current annual tax
- $5,112 · $426/mo
- Projected year-2 tax
- $6,515 · $543/mo
- Expected delta
- +$1,403/yr (+$117/mo · 27.4%)
ⓘ Screening estimate from a state-policy table — verify with the county assessor before closing.
Climate risk First Street
- Flood 1/10 Low FEMA zone X (unshaded) · 0% chance over 30 yrs
- Wildfire 3/10 Moderate
- Heat 5/10 Major 7 d/yr ≥96°F today · 16 d/yr by 30 yrs out
- Wind 8/10 Severe 80% chance of damaging wind over 30 yrs
- Air quality 3/10 Moderate 3 unhealthy d/yr today · 4 by 30 yrs out
Nearby sold comps map
Loading sold comps map…
Walkable amenities ~0.75 mi
Loading nearby amenities…
Taxation est. · year 1
- Rental income
- $46,800
- − Mortgage interest
- −$20,725
- − Property taxes
- −$5,112
- − Insurance
- −$1,850
- − Repairs & maintenance
- −$3,744
- − Management
- −$3,744
- − Depreciation
- −$10,763
- Taxable income
- $862
- Est. tax owed @ 24.0%
- −$207
- After-tax cash flow
- $6,520/yr
For passive investors: Depreciation is non-cash, so a rental often shows a tax loss while cash-flowing — sheltering income. Rental losses are passive: they offset passive income freely, and up to $25,000/yr can offset ordinary (W-2) income if you actively participate and your MAGI is under $100k (phasing out to $0 by $150k); unused losses carry forward. On sale, claimed depreciation is recaptured at up to 25%, and gains may owe capital-gains tax (a 1031 exchange can defer both). Figures are a year-1 estimate at your 24.0% rate — not tax advice; consult a CPA.
Schools (NCES district)
- District
- Ledyard School District
- NCES district ID
- 0902160
- Math proficiency
- 34% ▼ -12.00%
- Reading proficiency
- 49% ▼ -6.00%
- Median HH income
- $84,854
- Composite
- 39.02/100
- National rank
- #4064
- State rank
- #92 of 153 in CT
Livability — Gales Ferry
- Score
- 78/100
- State rank
- #40
- US rank
- #2751
Category grades
Schools grade is shown separately in the Schools card above.
Census & demographics
- Population (ZIP)
- 6,100
Population outlook (Southeastern Connecticut County) Hauer SSP2
- By 2040
- 293,442
Race, ethnicity, and origin ACS 2023
- Neighborhood character
- Predominantly White (75%)
- Race & ethnicity
- White 75% Two or more races 11% Hispanic / Latino 8% Black 4% Asian 3%
- Hispanic origin (detail)
- Puerto Rican 4%
- Common ancestry
- Romanian 9% Lithuanian 7% Serbian 4%
- Foreign-born
- 5% · Canada, China, Jamaica
- Languages at home
- 94% English-only · Spanish 3% Chinese 1% French/Haitian/Cajun 1%
Political lean MEDSL · Southeastern Connecticut
- 2024 margin
- D (+13.0) · D 55.6% · R 42.6% · Other 1.8%
- All cycles
- 2024: D+13.0
Not yet ingested
- Civics
- —
Market trends
- HPI YoY
- ▼ -67.79%
- Current HPI
- 240.7698
- Rent YoY
- —
- Metro
- —
- State GDP YoY
- ▲ 1.06%
- F500 in state
- 38
Industry mix (Fortune 500 HQ in CT)
| Industry | F500 HQs | Revenue |
|---|---|---|
| Industrial Machinery | 4 | $38B |
|
||
| Insurance | 3 | $71B |
|
||
| Financial Services | 2 | $25B |
|
||
| Transportation / Logistics | 2 | $18B |
|
||
| Healthcare | 1 | $247B |
|
||
| Telecommunications | 1 | $55B |
|
||
Price history
+285.4% since first listed10 events — show timeline
- 2026-05-24 Listed $369,990 Smart MLS
- 2020-07-16 Sold (Public Records) $200,000 Public Records
- 2019-11-15 Listing Removed — Smart MLS
- 2019-11-14 Price Changed $199,900 Smart MLS
- 2019-11-01 Price Changed $209,900 Smart MLS
- 2019-10-03 Relisted — Smart MLS
- 2019-09-20 Contingent — Smart MLS
- 2019-09-09 Listed $214,900 Smart MLS
- 2016-11-07 Sold (Public Records) $200,000 Public Records
- 1997-12-30 Sold (Public Records) $96,000 Public Records
Property tax history
+2.2%/yrLatest (2023): $5,112 · +2.2% YoY. Source: county tax records.
Cash-flow waterfall
monthlySold comps — $/sqft
last 12 mo · ≤1 miLoading sold comps…