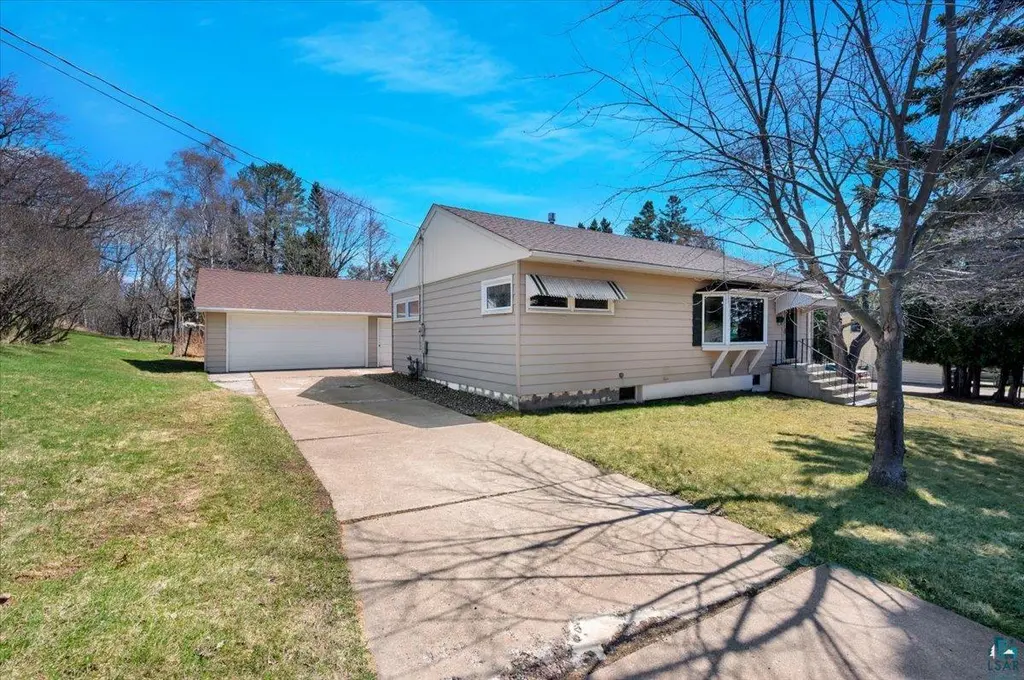
526 N 60th Ave E · Duluth, MN
Flood risk 1/10 · Minimal
- FEMA flood zone
- X
- Chance of flooding over 30 yrs
- 0.0%
- Est. flood insurance / yr
- $473 – $860
Fire risk 3/10 · Minor
- Est. fire insurance / yr
- $888 – $1,650
Heat risk 1/10 · Minimal
- Hot days now (above 90°F)
- 7 days/yr
- Hot days in 30 yrs
- 13 days/yr
Wind risk 1/10 · Minimal
- Chance of severe wind over 30 yrs
- —
Air-quality risk 2/10 · Minimal
- Unhealthy air days now
- 0 days/yr
- Unhealthy air days in 30 yrs
- 1 days/yr
Risk factors via First Street. Map © Google.
Why this score? — see what drove the D grade
The composite is a weighted blend of 9 inputs, each scored 0–100. Each bar is that input's sub-score; the figure is the points it added to the 100-point composite (weight × sub-score).
- Cash flow +13.1/30.0
- ARV discount +11.3/15.0
- Schools +4.2/10.0
- Livability +4.1/5.0
- DSCR +3.9/10.0
- 1% rule +3.0/10.0
- Rent growth +2.5/5.0
- Condition / age +2.5/5.0
- Appreciation +0.0/10.0
$275,000
🖨 Deal sheet (PDF) 📄 Offer letter ✓ Due diligence
Listing remarks
This well-loved 3-bedroom, 1.75-bath bungalow has been in the same family since it was built in 1956—and now it’s ready for its next chapter. Located in the highly desirable Lester Park neighborhood, this home offers solid bones, key updates, and the perfect opportunity to add your personal touch. The main floor features three bedrooms, a full bath, beautiful hardwood floors, and a bright eat-in kitchen. Major mechanical updates include a newer gas forced-air furnace and central air, giving you peace of mind right from the start. The full basement offers additional space along with a ¾ bath and has had extensive work completed by Northern States Basement Systems, with a t
Key facts
- Newer roof
- Full basement
- Central air
Tags
Property features AI
Finance
- Other: Residential property listed by RE/MAX Results
Exterior
- Parking: Detached garage with 2 spaces; Concrete driveway; Off-street parking; Garage door opener
- Utilities: Public water; Public sewer
- Home design: Single family detached residence; One story
- Construction: Asphalt shingle roof; Basement: full, partially finished
- Exterior features: Outdoor lighting; City street frontage; Lot approximately 79 x 87 (0.16 acres)
Interior
- Kitchen: Dishwasher; Range; Refrigerator
- Bedrooms: Primary bedroom located on the main level
- Flooring: Hardwood
- Bathrooms: 1 full bathroom; 1 three-quarter bathroom
- Heating & cooling: Forced air heating (natural gas); Central air conditioning
- Interior features: Eat-in kitchen; Primary bedroom on main level
- Laundry & utility: Washer; Dryer
Neighborhood map
What this means for you Summary
Snapshot
- This is a 3-bed/2.0-bath single-family listed at $275k.
Deal economics
- At list price, monthly cash flow is $-11 ($-136/yr) — negative.
- To cash-flow at today's rent, offer at most $273k (0.7% below list).
- To meet the 1% rule (rent ≥ 1% of price), the offer needs to be $220k (19.9% below list).
- Recommended offer: $220k (19.9% below list) — sets the bar for 1% rule.
- Cap rate 6.2% vs local median 4.9% in Duluth — meaningfully above typical; check what's discounted (condition, days-on-market, listing class) to confirm the premium yield is real.
Location & tenants
- Location reads 82/100 on livability (#36 in MN, #1,060 nationally) — a professional / high-income tenant draw. Strengths: commute A+, cost of living A+, housing A+; Watch: amenities F.
- Duluth Public School District (urban): math 44% / reading 55% proficiency, ranked #132 of 301 in MN (top 44%) — families likely to look elsewhere, expect single-tenant / working-renter base with shorter leases.
- Zoned schools: Lester Park Elementary (math 73% / reading 77%, grade A, #31 of 857 statewide, top 4%, 575 students, 20% FRL); Ordean East Middle School (math 45% / reading 61%, grade C+, #53 of 258 statewide, top 22%, 989 students, 26% FRL); East High School (math 42% / reading 73%, grade C, #59 of 471 statewide, top 13%, 1,494 students, 23% FRL) — zoned schools average 23% FRL vs 39% district-wide (16 pts lower); this property's tenant base skews higher-income than the district average.
- Zoned-school proficiency averages 62% at this address vs 50% district-wide (+12 pts) — the actual schools serving this property are materially stronger than the Duluth Public School District average implies; a family-tenant draw the district grade alone would hide.
- Market conditions: 100 active listings in the ZIP; 2 comparable units currently listed for rent nearby; 639 units permitted in St. Louis County in 2024 (338 in 5+ unit buildings).
Forward outlook
- Local home prices are declining (-3.0%/yr); year-one equity from $2k of loan paydown is wiped out by about $8k of value loss. Plan a longer hold.
Negotiation context
- Only 4 days on market — expect competitive offers; lowballing is unlikely to land.
Risks & watch-outs
- Watch-outs: built in 1956 — expect roof / HVAC / electrical / plumbing capex.
Questions for the listing agent
- What do current leases actually rent for vs. the listed asking? Can we see a recent rent roll and the last 12 months of T-12 income?
- Built in 1956 — when were the roof, HVAC, electrical panel, plumbing, and water heater last replaced?
- Is there a deadline driving the sale (1031 exchange, divorce, estate, relocation)? That informs how much negotiation room exists.
- Schools are B-rated — typically a magnet for longer-tenancy family renters. What's the average tenant stay here, and is there a school-zone premium baked into asking?
- The area grade is low — what's the realistic commute time and amenity access for the typical tenant pool here? Any planned neighborhood developments (good or bad) we should know about?
- What's the average days-on-market for RENTAL listings here right now (not sales)? A rising rental-DOM trend means longer vacancies and softer asking-rent achievability than the comps imply.
- What's the recent tenant-quality profile in this submarket — average credit score on applications, eviction rate, late-payment / NSF rate, and stable-employment percentage? A property-management company in the area should have these aggregated.
- How much new for-sale + rental construction is in the pipeline within 1–3 miles? Heavy new supply typically softens prices + rents 12–24 months out; constrained supply supports both.
Investment metrics
- 1% rule
- 0.80% ✗
- Cap rate
- 6.24%
- Cash-on-cash
- -0.18%
- DSCR
- 0.99
- GRM
- 10.4
CMA / ARV
- ARV (median comp)
- $300,175
- List price
- $275,000
- Delta
- -8.39%
- Verdict
- FAIR
- Comps
- 20 within 1.0 mi
Show comp detail 10 sales within ~0.75 mi
| Address | Dist | Beds/Ba | Sqft | Sold | Price | $/sf | Match |
|---|---|---|---|---|---|---|---|
| 5211 Avondale St | 0.35mi | 3/1.5 | 1,068 (+3%) | 4mo | $175,000 | $164 | 74 |
| 5840 Tioga St | 0.31mi | 3/1.0 | 1,085 (+4%) | 9mo | $290,000 | $267 | 67 |
| 5122 Glenwood St | 0.46mi | 2/1.5 (-1) | 999 (-4%) | 1mo | $290,000 | $290 | 64 |
| 5402 Juniata St | 0.23mi | 2/1.0 (-1) | 1,108 (+6%) | 8mo | $277,000 | $250 | 63 |
| 828 N 54th Ave Ave E | 0.22mi | 2/1.5 (-1) | 1,081 (+4%) | 22mo | $305,000 | $282 | 58 |
| 21 S 55th Ave E | 0.58mi | 2/1.5 (-1) | 1,080 (+4%) | 3mo | $250,000 | $231 | 57 |
| 4930 Oneida St | 0.63mi | 3/1.5 | 1,030 (-1%) | 19mo | $165,000 | $160 | 51 |
| 4831 Oneida St | 0.70mi | 3/2.0 | 1,118 (+8%) | 8mo | $296,900 | $266 | 48 |
| 4911 Glenwood St | 0.61mi | 2/2.0 (-1) | 1,056 (+2%) | 22mo | $240,000 | $227 | 45 |
| 4931 Wyoming St | 0.57mi | 2/1.0 (-1) | 936 (-10%) | 6mo | $249,000 | $266 | 42 |
Match score weights: distance 35% · size 25% · config 20% · recency 20%. Top-matched comps best support the ARV.
Projected returns pro-forma
-3.0% appreciation · 3.0% rent growth · sell at horizon
- IRR
- -16.6%
- Equity multiple
- 0.41×
- Total profit
- $-45,344
- Equity at exit
- $41,003
- IRR
- -8.5%
- Equity multiple
- 0.47×
- Total profit
- $-40,654
- Equity at exit
- $23,777
Cash invested: $77,000 (down + closing). Projections, not guarantees.
Landlord ↔ Tenant lean methodology
- Overall (STATE)
- 46 Balanced
- State Minnesota
- 46 Balanced · D+2
- County
- — inherits STATE
- City
- — inherits STATE
ZIP-level market 55804
- Active inventory
- 100
- Price-to-rent
- 10.4×
Monthly cashflow live
- Estimated rent
- $2,202 medium interval (Pro) →
- Mortgage (P&I)
- −$1,442
- Tax from tax record
- −$194 /mo · $2,334/yr
- Insurance
- −$115
- HOA
- −$0
- Vacancy / Maint / Mgmt
- −$462
- Net cashflow
- $-11
Break-even live
Sensitivity live
| Price | -10% $144 | -5% $66 | +0% $-11 | +5% $-89 | +10% $-167 |
|---|---|---|---|---|---|
| Rent | -10% $-185 | -5% $-98 | +0% $-11 | +5% $76 | +10% $163 |
| Rate | -1.0pp $127 | -0.5pp $59 | base $-11 | +0.5pp $-83 | +1.0pp $-155 |
UW: 25.0% down · 7.5% · 30yr · 1.5% tax · 5.0% vac · 8.0% maint · 8.0% mgmt
Financing live
Cash to close
- Down payment
- $68,750
- Closing costs
- $8,250
- Reserves months
- —
- Total cash needed
- —
Loan-product check · same deal, 3 products live
Conventional
25% down · 7.5% · 30yr
- Down + closing
- —
- Monthly P&I
- —
- Monthly cashflow
- —
- DSCR
- —
- Eligible?
- —
Personal DTI + credit; lowest rate.
DSCR
20% down · 8.5% · 30yr
- Down + closing
- —
- Monthly P&I
- —
- Monthly cashflow
- —
- DSCR
- —
- Eligible?
- —
No personal income docs; deal must DSCR.
Hard money
10% down · 12.0% · 12mo
- Down + closing
- —
- Monthly P&I
- —
- Monthly cashflow
- —
- DSCR
- —
- Eligible?
- —
Short-term bridge; refi at stabilization.
Rent comps 2 comps
| Address | Beds | Baths | Sqft | Rent | $/sqft | DOM | Units | Dist |
|---|---|---|---|---|---|---|---|---|
| 5231 Wyoming St Duluth, MN | 3.0 | 1.0 | 1500 | $2,250 | $1.50 | 23d | 1 | 0.30mi |
| 5090 London Rd Unit 1 Duluth, MN | 2.0 | 2.0 | 959 | $2,100 | $2.19 | 15d | 1 | 0.86mi |
Listing history 2 events
-
2026-05-05status Pending 1196-char remark
-
2026-04-30$275,000 Active 1196-char remark
ⓘ Source: listings_history table (triggers on properties + properties_extension) + one-shot
backfill from property_details.listing_events for pre-trigger history.
Tax reassessment forecast MN · Partial reset (capped growth)
- Current annual tax
- $2,334 · $194/mo
- Projected year-2 tax
- $2,707 · $226/mo
- Expected delta
- +$373/yr (+$31/mo · 16.0%)
ⓘ Screening estimate from a state-policy table — verify with the county assessor before closing.
Climate risk First Street
- Flood 1/10 Low FEMA zone X · 0% chance over 30 yrs
- Wildfire 3/10 Moderate
- Heat 1/10 Low 7 d/yr ≥90°F today · 13 d/yr by 30 yrs out
- Wind 1/10 Low
- Air quality 2/10 Low 0 unhealthy d/yr today · 1 by 30 yrs out
Nearby sold comps map
Loading sold comps map…
Walkable amenities ~0.75 mi
Loading nearby amenities…
Taxation est. · year 1
- Rental income
- $26,428
- − Mortgage interest
- −$15,404
- − Property taxes
- −$2,334
- − Insurance
- −$1,375
- − Repairs & maintenance
- −$2,114
- − Management
- −$2,114
- − Depreciation
- −$8,000
- Taxable loss
- −$4,914
- Est. tax savings @ 24.0%
- +$1,179
- After-tax cash flow
- $1,043/yr
For passive investors: Depreciation is non-cash, so a rental often shows a tax loss while cash-flowing — sheltering income. Rental losses are passive: they offset passive income freely, and up to $25,000/yr can offset ordinary (W-2) income if you actively participate and your MAGI is under $100k (phasing out to $0 by $150k); unused losses carry forward. On sale, claimed depreciation is recaptured at up to 25%, and gains may owe capital-gains tax (a 1031 exchange can defer both). Figures are a year-1 estimate at your 24.0% rate — not tax advice; consult a CPA.
Schools (NCES district)
- District
- Duluth Public School District
- NCES district ID
- 2711040
- Math proficiency
- 44% ▼ -10.00%
- Reading proficiency
- 55% ▼ -6.00%
- Median HH income
- $45,692
- Composite
- 41.92/100
- National rank
- #3360
- State rank
- #132 of 301 in MN
Livability — Duluth
- Score
- 82/100
- State rank
- #36
- US rank
- #1060
Category grades
Schools grade is shown separately in the Schools card above.
Census & demographics
- Census place
- Duluth, MN
- City population
- 71,097
- Population (ZIP)
- 16,018
Population outlook (St. Louis County) Hauer SSP2
- Today (2025)
- 202,411 people
- By 2030
- 203,234 · +0.4%
- By 2040
- 202,520 · +0.1%
- By 2050
- 200,853 · -0.8%
- By 2075
- 200,943 · -0.7%
- By 2100
- 192,058 · -5.1%
Race, ethnicity, and origin ACS 2023
- Neighborhood character
- Predominantly White (92%)
- Race & ethnicity
- White 92% Two or more races 5% Hispanic / Latino 1% Asian 1%
- Common ancestry
- Portuguese 14% Scottish 4% Romanian 4%
- Foreign-born
- 3% · Canada
- Languages at home
- 96% English-only · Spanish 1%
Political lean MEDSL · St. Louis
- 2024 margin
- D (+13.7) · D 55.9% · R 42.2% · Other 1.8%
- 2008→2024 swing
- -18.8pp toward R · 2008: 32.5pp · 2024: 13.7pp
- All cycles
- 2024: D+13.7 2020: D+15.6 2016: D+11.8 2012: D+29.6 2008: D+32.5
Not yet ingested
- Civics
- —
Market trends
- HPI YoY
- ▼ -253.94%
- Current HPI
- 199.4064
- Rent YoY
- —
- Metro
- —
- State GDP YoY
- ▲ 2.41%
- F500 in state
- 34
Industry mix (Fortune 500 HQ in MN)
| Industry | F500 HQs | Revenue |
|---|---|---|
| Healthcare | 2 | $407B |
|
||
| Retail | 2 | $150B |
|
||
| Consumer Goods | 2 | $32B |
|
||
| Industrial Machinery | 2 | $6B |
|
||
| Agriculture | 1 | $40B |
|
||
| Healthcare / Medical Devices | 1 | $32B |
|
||
Price history
+6.9% since first listed3 events — show timeline
- 2026-06-17 Sold (MLS) $294,000 LSAR
- 2026-05-05 Pending — LSAR
- 2026-04-30 Listed $275,000 LSAR
Property tax history
+2.3%/yrLatest (2026): $2,334 · +8.1% YoY. Source: county tax records.
Cash-flow waterfall
monthlySold comps — $/sqft
last 12 mo · ≤1 miLoading sold comps…