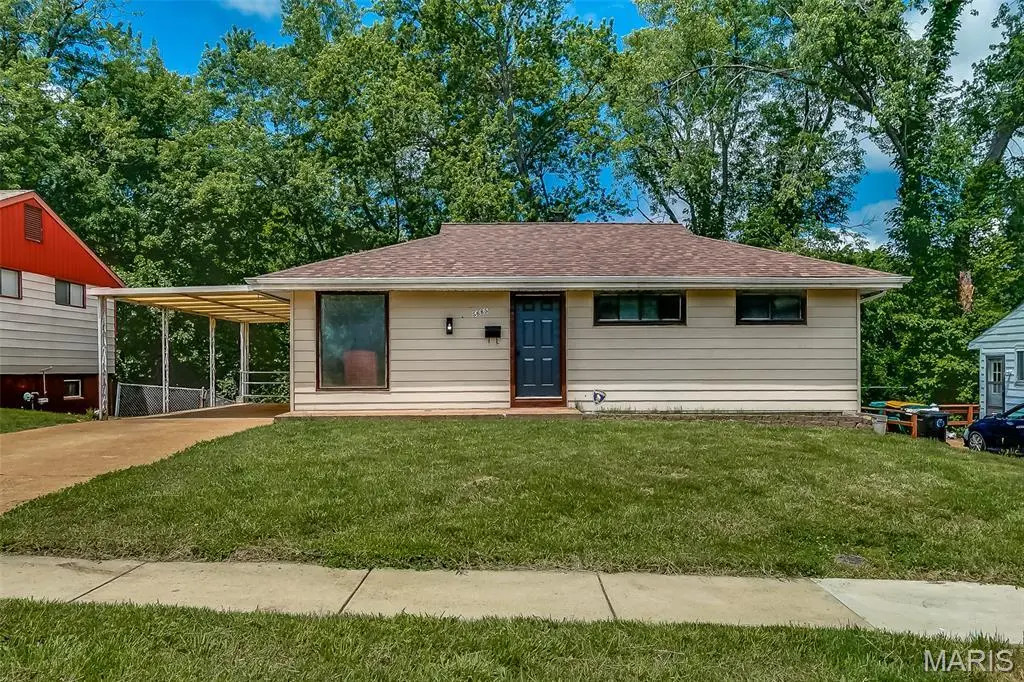
5685 Parchester Dr · Normandy, MO
Flood risk 1/10 · Minimal
- FEMA flood zone
- X (unshaded)
- Chance of flooding over 30 yrs
- 0.0%
- Est. flood insurance / yr
- $473 – $860
Fire risk 1/10 · Minimal
- Est. fire insurance / yr
- $1,054 – $1,958
Heat risk 4/10 · Minor
- Hot days now (above 107°F)
- 7 days/yr
- Hot days in 30 yrs
- 19 days/yr
Wind risk 2/10 · Minimal
- Chance of severe wind over 30 yrs
- 1.0%
Air-quality risk 4/10 · Minor
- Unhealthy air days now
- 4 days/yr
- Unhealthy air days in 30 yrs
- 5 days/yr
Risk factors via First Street. Map © Google.
Why this score? — see what drove the C- grade
The composite is a weighted blend of 9 inputs, each scored 0–100. Each bar is that input's sub-score; the figure is the points it added to the 100-point composite (weight × sub-score).
- Cash flow +21.4/30.0
- ARV discount +7.5/15.0
- DSCR +6.8/10.0
- 1% rule +4.8/10.0
- Rent growth +3.8/5.0
- Livability +3.2/5.0
- Condition / age +2.5/5.0
- Schools +1.2/10.0
- Appreciation +0.0/10.0
$125,000
🖨 Deal sheet (PDF) 📄 Offer letter ✓ Due diligence
Listing remarks
Welcome Home to 5685 Parchester Dr! This beautiful home has been meticulously renovated to offer an exquisite blend of style, comfort and modern convenience. This home offers 3 bedrooms and 1 bath!. As you step inside you will be greeted by a warm and inviting interior featuring beautiful hardwood flooring You will love the open floor plan!! This home features a new warm tone paint color and dramatic dark doors. The kitchen has beautiful cabinetry, stainless steel appliances, granite countertops and plenty of space for a kitchen table! The bathroom has a new custom vanity, beautiful wood trim and a shower unit!. The lower level is finished, has a walk out door to the back yard and offers p
Key facts
- Hardwood flooring
- Open floor plan
- Custom vanity
Tags
Property features AI
Exterior
- Parking: Has carport (1 space)
- Utilities: Public water; Public sewer; Electricity connected (Ameren)
- Home design: Single-family residential; One level
- Construction: Wood siding construction
- Exterior features: Front yard; Level lot
Interior
- Kitchen: Stainless steel appliances
- Bedrooms: Three bedrooms on the main level
- Bathrooms: One full bathroom on the main level
- Heating & cooling: Forced air heating; Central air conditioning
- Interior features: Stainless steel appliances; Partially finished basement with 8+ ft poured walls
Neighborhood map
What this means for you Summary
Snapshot
- This is a 3-bed/1.0-bath single-family listed at $125k.
Deal economics
- At list price, monthly cash flow is $184 ($2k/yr) — positive.
- The deal already cash-flows at list — no discount required.
- To meet the 1% rule (rent ≥ 1% of price), the offer needs to be $123k (1.9% below list).
- Recommended offer: $123k (1.9% below list) — sets the bar for 1% rule.
Location & tenants
- Location reads 65/100 on livability (#290 in MO) — a middle-class / working-renter tenant base. Strengths: commute A+, cost of living A+, housing A+; Watch: employment C-, schools F, crime F.
- Ferguson-Florissant R-II (suburban): math 7% / reading 20% proficiency, ranked #311 of 324 in MO (top 96%) — low school quality limits family demand, transient renter base, plan for 1-2y turnover; 70% free/reduced lunch — lower-income household profile, screen leases tightly.
- Market conditions: Rents rising fast (+5.2%/yr); 23 active listings in the ZIP; 40 comparable units currently listed for rent nearby; rentals at typical pace (median 25d on market — plan ~3-4 weeks tenant-placement turnaround); 45% of comp listings sitting > 30 days — soft ceiling on asking rent; lower-income renter base — watch delinquency; 920 units permitted in St. Louis County in 2024 (250 in 5+ unit buildings).
- This rent runs 34% of the median local income ($43k/yr) — at the standard rent-burdened threshold; future hikes will face affordability resistance.
Forward outlook
- Local home prices are declining (-3.0%/yr); year-one equity from $864 of loan paydown is wiped out by about $4k of value loss. Plan a longer hold.
Negotiation context
- Only 5 days on market — expect competitive offers; lowballing is unlikely to land.
Risks & watch-outs
- Watch-outs: built in 1954 — expect roof / HVAC / electrical / plumbing capex.
Questions for the listing agent
- Built in 1954 — when were the roof, HVAC, electrical panel, plumbing, and water heater last replaced?
- Is there a deadline driving the sale (1031 exchange, divorce, estate, relocation)? That informs how much negotiation room exists.
- Schools are F-rated, which usually means shorter tenancies and higher turnover. Who's the typical renter profile here, and what's been the actual vacancy rate?
- Crime grade is F in this area — have there been break-ins, vandalism, or insurance claims at this property in the last 3 years? What carrier currently insures it and at what premium?
- What's the average days-on-market for RENTAL listings here right now (not sales)? A rising rental-DOM trend means longer vacancies and softer asking-rent achievability than the comps imply.
- What's the recent tenant-quality profile in this submarket — average credit score on applications, eviction rate, late-payment / NSF rate, and stable-employment percentage? A property-management company in the area should have these aggregated.
- How much new for-sale + rental construction is in the pipeline within 1–3 miles? Heavy new supply typically softens prices + rents 12–24 months out; constrained supply supports both.
Investment metrics
- 1% rule
- 0.98% ✗
- Cap rate
- 8.06%
- Cash-on-cash
- 6.32%
- DSCR
- 1.28
- GRM
- 8.5
CMA / ARV
- ARV (on-the-fly)
- $79,488
- Comps found
- 12
Show comp detail 12 sales within ~0.75 mi
| Address | Dist | Beds/Ba | Sqft | Sold | Price | $/sf | Match |
|---|---|---|---|---|---|---|---|
| 7775 Paddington Dr | 0.11mi | 3/1.0 | 864 (0%) | 8mo | $84,000 | $97 | 89 |
| 5633 Parchester Dr | 0.13mi | 3/1.0 | 864 (0%) | 7mo | $79,900 | $92 | 88 |
| 5300 Bermuda Dr | 0.55mi | 2/1.0 (-1) | 875 (+1%) | 5mo | $45,000 | $51 | 63 |
| 809 Thomas Ave | 0.74mi | 3/1.0 | 864 (0%) | 4mo | $59,900 | $69 | 62 |
| 8350 Hill Ave | 0.67mi | 3/1.0 | 912 (+6%) | 1mo | $94,900 | $104 | 59 |
| 721 Beardsley Ct | 0.69mi | 2/1.0 (-1) | 820 (-5%) | 4mo | $89,900 | $110 | 51 |
| 5316 Colton Dr | 0.55mi | 2/1.0 (-1) | 792 (-8%) | 6mo | $99,900 | $126 | 50 |
| 7501 Blanding Dr | 0.48mi | 2/1.0 (-1) | 768 (-11%) | 7mo | $65,000 | $85 | 48 |
| 4723 N Hills Ln | 0.61mi | 3/2.0 | 965 (+12%) | 1mo | $85,000 | $88 | 47 |
| 8319 Hawkesbury Dr | 0.66mi | 2/1.0 (-1) | 938 (+9%) | 6mo | $79,900 | $85 | 45 |
| 6188 Dupree Ave | 0.65mi | 3/1.5 | 972 (+12%) | 4mo | $75,000 | $77 | 43 |
| 4815 Barbara Dr | 0.68mi | 3/1.5 | 988 (+14%) | 6mo | $98,500 | $100 | 38 |
Match score weights: distance 35% · size 25% · config 20% · recency 20%. Top-matched comps best support the ARV.
Projected returns pro-forma
-3.0% appreciation · 5.21% rent growth · sell at horizon
- IRR
- -4.3%
- Equity multiple
- 0.84×
- Total profit
- $-5,750
- Equity at exit
- $18,638
- IRR
- 7.6%
- Equity multiple
- 1.63×
- Total profit
- $21,963
- Equity at exit
- $10,808
Cash invested: $35,000 (down + closing). Projections, not guarantees.
Landlord ↔ Tenant lean methodology
- Overall (STATE)
- 81 Strongly Landlord-Friendly
- State Missouri
- 81 Strongly Landlord-Friendly · R+10
- County
- — inherits STATE
- City
- — inherits STATE
ZIP-level market 63121
- Rents YoY
- 5.2%
- Active inventory
- 23
- Price-to-rent
- 8.5×
Monthly cashflow live
- Estimated rent
- $1,226 high interval (Pro) →
- Mortgage (P&I)
- −$656
- Tax from tax record
- −$77 /mo · $919/yr
- Insurance
- −$52
- HOA
- −$0
- Vacancy / Maint / Mgmt
- −$257
- Net cashflow
- $184
Break-even live
Sensitivity live
| Price | -10% $255 | -5% $220 | +0% $184 | +5% $149 | +10% $114 |
|---|---|---|---|---|---|
| Rent | -10% $88 | -5% $136 | +0% $184 | +5% $233 | +10% $281 |
| Rate | -1.0pp $247 | -0.5pp $216 | base $184 | +0.5pp $152 | +1.0pp $119 |
UW: 25.0% down · 7.5% · 30yr · 1.5% tax · 5.0% vac · 8.0% maint · 8.0% mgmt
Financing live
Cash to close
- Down payment
- $31,250
- Closing costs
- $3,750
- Reserves months
- —
- Total cash needed
- —
Loan-product check · same deal, 3 products live
Conventional
25% down · 7.5% · 30yr
- Down + closing
- —
- Monthly P&I
- —
- Monthly cashflow
- —
- DSCR
- —
- Eligible?
- —
Personal DTI + credit; lowest rate.
DSCR
20% down · 8.5% · 30yr
- Down + closing
- —
- Monthly P&I
- —
- Monthly cashflow
- —
- DSCR
- —
- Eligible?
- —
No personal income docs; deal must DSCR.
Hard money
10% down · 12.0% · 12mo
- Down + closing
- —
- Monthly P&I
- —
- Monthly cashflow
- —
- DSCR
- —
- Eligible?
- —
Short-term bridge; refi at stabilization.
Rent comps 40 comps
| Address | Beds | Baths | Sqft | Rent | $/sqft | DOM | Units | Dist |
|---|---|---|---|---|---|---|---|---|
| 5925 Brand Ave Saint Louis, MO | 3.0 | 1.0 | 951 | $1,200 | $1.26 | 44d | 1 | 0.11mi |
| 5900 Sheriton Dr Saint Louis, MO | 3.0 | 1.0 | 864 | $1,050 | $1.22 | 24d | 1 | 0.12mi |
| 7816 Dartmoor Dr Saint Louis, MO | 3.0 | 1.0 | 950 | $1,195 | $1.26 | 44d | 1 | 0.12mi |
| 5830 Bermuda Dr Unit 30B St. Louis, MO | 2.0 | 1.0 | 900 | $895 | $0.99 | 24d | 1 | 0.26mi |
| 5830 Bermuda Dr Unit 34C St. Louis, MO | 2.0 | 1.0 | 850 | $895 | $1.05 | 44d | 1 | 0.26mi |
| 7733 Brand Ave Saint Louis, MO | 2.0 | 1.0 | 656 | $1,090 | $1.66 | 24d | 1 | 0.32mi |
| 204 Hawkesbury Dr Saint Louis, MO | 2.0 | 1.0 | 849 | $1,250 | $1.47 | 5d | 1 | 0.45mi |
| 6180 Emerald Ave Saint Louis, MO | 2.0 | 1.0 | 729 | $1,300 | $1.78 | 44d | 1 | 0.62mi |
| 6188 Dupree Ave Saint Louis, MO | 3.0 | 1.5 | 972 | $1,300 | $1.34 | 44d | 1 | 0.63mi |
| 26 Arbor Village Ct Ferguson, MO | 1.0–2.0 | 1.0 | 714 | $950 | $1.33 | 24d | 1 | 0.69mi |
| 8408 Hill Ave Saint Louis, MO | 3.0 | 2.0 | 1040 | $1,550 | $1.49 | 24d | 1 | 0.69mi |
| 801 Thomas Ave Saint Louis, MO | 3.0 | 1.0 | 864 | $1,350 | $1.56 | 44d | 1 | 0.74mi |
| 617 Tesmore Pl Saint Louis, MO | 2.0 | 1.0 | 877 | $1,200 | $1.37 | 44d | 1 | 0.75mi |
| 223 Wiegel Dr Saint Louis, MO | 3.0 | 1.0 | 864 | $1,560 | $1.81 | 13d | 1 | 0.78mi |
| 12 Lee Ave Saint Louis, MO | 2.0 | 1.0 | 832 | $1,080 | $1.30 | 8d | 1 | 0.79mi |
| 806 Marvin Ave Saint Louis, MO | 2.0 | 1.0 | 726 | $1,100 | $1.52 | 44d | 1 | 0.83mi |
| 5300 Grove Ave Saint Louis, MO | 3.0 | 1.0 | 840 | $1,295 | $1.54 | 24d | 1 | 0.85mi |
| 110 Paul Ave Saint Louis, MO | 3.0 | 1.0 | 875 | $1,050 | $1.20 | 8d | 1 | 0.87mi |
| 419 S Florissant Rd Ferguson, MO | 2.0 | 1.0 | 1100 | $1,200 | $1.09 | 44d | 1 | 0.92mi |
| 222 Randolph Ave Saint Louis, MO | 2.0 | 1.0 | 964 | $1,400 | $1.45 | 8d | 1 | 0.97mi |
| 296 Meadowcrest Dr Saint Louis, MO | 3.0 | 1.0 | 960 | $1,550 | $1.61 | 15d | 1 | 1.03mi |
| 246 Louisa Ave Saint Louis, MO | 3.0 | 1.0 | 1036 | $1,600 | $1.54 | 44d | 1 | 1.04mi |
| 709 Suburban Ave Saint Louis, MO | 2.0 | 1.0 | 975 | $1,400 | $1.44 | 44d | 1 | 1.06mi |
| 249 S Hartnett Ave Saint Louis, MO | 3.0 | 1.0 | 960 | $1,220 | $1.27 | 24d | 1 | 1.09mi |
| 360 S Harvey Ave Saint Louis, MO | 2.0 | 1.0 | 936 | $925 | $0.99 | 44d | 1 | 1.10mi |
| 450 S Dade Ave Saint Louis, MO | 2.0 | 1.0 | 1040 | $1,200 | $1.15 | 24d | 1 | 1.11mi |
| 519 Graf Ave Saint Louis, MO | 3.0 | 2.0 | 887 | $1,297 | $1.46 | 21d | 1 | 1.12mi |
| 227 Meadowcrest Dr Saint Louis, MO | 3.0 | 1.0 | 960 | $1,500 | $1.56 | 44d | 1 | 1.18mi |
| 422 Plaza Ave Saint Louis, MO | 3.0 | 1.0 | 792 | $1,000 | $1.26 | 8d | 1 | 1.20mi |
| 5600 Gatesworth Ave Saint Louis, MO | 2.0 | 1.0 | 672 | $1,095 | $1.63 | 5d | 1 | 1.22mi |
| 5500 Mable Ave Unit 5518 B4 St. Louis, MO | 2.0 | 1.0 | 750 | $835 | $1.11 | 44d | 1 | 1.23mi |
| 5500 Mable Ave Unit 5530 B1 St. Louis, MO | 3.0 | 1.0 | 850 | $915 | $1.08 | 44d | 1 | 1.23mi |
| 945 Edgehill Dr Saint Louis, MO | 3.0 | 1.0 | 1110 | $1,575 | $1.42 | 44d | 1 | 1.24mi |
| 7420 Pleaseway Dr Saint Louis, MO | 2.0 | 1.0 | 952 | $1,250 | $1.31 | 22d | 1 | 1.26mi |
| 7414 Pleaseway Dr Saint Louis, MO | 2.0 | 1.0 | 768 | $1,100 | $1.43 | 44d | 1 | 1.27mi |
| 5613 Statler Ave Saint Louis, MO | 2.0 | 1.0 | 864 | $1,300 | $1.50 | 5d | 1 | 1.31mi |
| 7431 Esterbrook Dr Saint Louis, MO | 2.0 | 1.0 | 792 | $1,350 | $1.70 | 44d | 1 | 1.31mi |
| 7441 Calvin Ave Saint Louis, MO | 3.0 | 1.0 | 1068 | $1,350 | $1.26 | 13d | 1 | 1.37mi |
| 7426 Calvin Ave Saint Louis, MO | 2.0 | 1.0 | 1100 | $1,125 | $1.02 | 18d | 1 | 1.39mi |
| 104 Fenwick Dr Saint Louis, MO | 3.0 | 1.0 | 960 | $1,250 | $1.30 | 24d | 1 | 1.44mi |
Listing history 4 events
-
2026-05-31status $125,000 Pending 5 DOM
-
2026-05-31days on market $125,000 Active 5 DOM
-
2026-05-26$125,000 Active
-
1969-09-05soldstatus
ⓘ Source: listings_history table (triggers on properties + properties_extension) + one-shot
backfill from property_details.listing_events for pre-trigger history.
Tax reassessment forecast MO · Resets to sale price
- Current annual tax
- $919 · $77/mo
- Projected year-2 tax
- $1,212 · $101/mo
- Expected delta
- +$293/yr (+$24/mo · 31.9%)
ⓘ Screening estimate from a state-policy table — verify with the county assessor before closing.
Climate risk First Street
- Flood 1/10 Low FEMA zone X (unshaded) · 0% chance over 30 yrs
- Wildfire 1/10 Low
- Heat 4/10 Moderate 7 d/yr ≥107°F today · 19 d/yr by 30 yrs out
- Wind 2/10 Low 100% chance of damaging wind over 30 yrs
- Air quality 4/10 Moderate 4 unhealthy d/yr today · 5 by 30 yrs out
Nearby sold comps map
Loading sold comps map…
Walkable amenities ~0.75 mi
Loading nearby amenities…
Taxation est. · year 1
- Rental income
- $14,714
- − Mortgage interest
- −$7,002
- − Property taxes
- −$919
- − Insurance
- −$625
- − Repairs & maintenance
- −$1,177
- − Management
- −$1,177
- − Depreciation
- −$3,636
- Taxable income
- $177
- Est. tax owed @ 24.0%
- −$43
- After-tax cash flow
- $2,171/yr
For passive investors: Depreciation is non-cash, so a rental often shows a tax loss while cash-flowing — sheltering income. Rental losses are passive: they offset passive income freely, and up to $25,000/yr can offset ordinary (W-2) income if you actively participate and your MAGI is under $100k (phasing out to $0 by $150k); unused losses carry forward. On sale, claimed depreciation is recaptured at up to 25%, and gains may owe capital-gains tax (a 1031 exchange can defer both). Figures are a year-1 estimate at your 24.0% rate — not tax advice; consult a CPA.
Schools (NCES district)
- District
- Ferguson-Florissant R-II
- NCES district ID
- 2912010
- Math proficiency
- 7% ▼ -9.00%
- Reading proficiency
- 20% ▼ -6.00%
- Median HH income
- $44,610
- Composite
- 11.96/100
- National rank
- #9666
- State rank
- #311 of 324 in MO
Livability — Normandy
- Score
- 65/100
- State rank
- #290
- US rank
- #13498
Category grades
Schools grade is shown separately in the Schools card above.
Census & demographics
- Census place
- Normandy, MO
- County
- Saint Louis County · 888,823 people
- City population
- 25,008
- Metro
- St. Louis, MO-IL
- Population (ZIP)
- 25,008
- Household income
- $42,701
- Rent vs Own
- Severe rent burden
- 1611.0
Population outlook (St. Louis County) Hauer SSP2
- Today (2025)
- 1,025,227 people
- By 2030
- 1,028,023 · +0.3%
- By 2040
- 1,020,940 · -0.4%
- By 2050
- 1,007,280 · -1.8%
- By 2075
- 987,277 · -3.7%
- By 2100
- 921,984 · -10.1%
Race, ethnicity, and origin ACS 2023
- Neighborhood character
- Predominantly Black (80%)
- Race & ethnicity
- Black 80% White 14% Two or more races 4% Hispanic / Latino 2% Asian 2%
- Common ancestry
- Lithuanian 1%
- Foreign-born
- 2% · Canada
- Languages at home
- 96% English-only · Spanish 2% Other Indo-European 1%
Political lean MEDSL · St. Louis
- 2024 margin
- Strong D (+23.4) · D 60.8% · R 37.4% · Other 1.7%
- 2008→2024 swing
- +3.5pp toward D · 2008: 19.9pp · 2024: 23.4pp
- All cycles
- 2024: D+23.4 2020: D+24.0 2016: D+16.2 2012: D+13.7 2008: D+19.9
Not yet ingested
- Civics
- —
Market trends
- HPI YoY
- ▼ -177.84%
- Current HPI
- 100.4494
- Rent YoY
- ▲ 5.21%
- Metro
- St. Louis, MO-IL
- State GDP YoY
- ▲ 1.84%
- F500 in state
- 20
Industry mix (Fortune 500 HQ in MO)
| Industry | F500 HQs | Revenue |
|---|---|---|
| Healthcare | 1 | $163B |
|
||
| Insurance | 1 | $21B |
|
||
| Industrial Technology | 1 | $17B |
|
||
| Retail | 1 | $16B |
|
||
| Industrial Distribution | 1 | $10B |
|
||
| Utilities | 1 | $9B |
|
||
Price history
2 events — show timeline
- 2026-05-26 Listed $125,000 MARIS as Distributed by MLS Grid
- 1969-09-05 Sold (Public Records) — Public Records
Property tax history
-2.3%/yrLatest (2022): $919 · +0.3% YoY. Source: county tax records.
Cash-flow waterfall
monthlySold comps — $/sqft
last 12 mo · ≤1 miLoading sold comps…