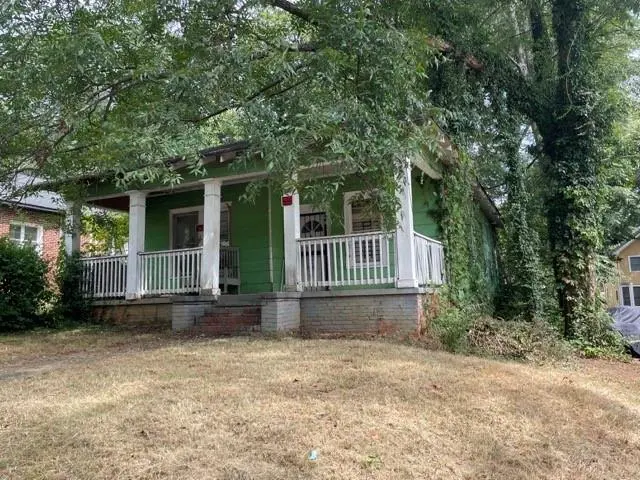
998 Linam Ave SE · Atlanta, GA
Flood risk 1/10 · Minimal
- FEMA flood zone
- X (unshaded)
- Chance of flooding over 30 yrs
- 0.0%
- Est. flood insurance / yr
- $473 – $860
Fire risk 1/10 · Minimal
- Est. fire insurance / yr
- $963 – $1,789
Heat risk 5/10 · Moderate
- Hot days now (above 105°F)
- 7 days/yr
- Hot days in 30 yrs
- 18 days/yr
Wind risk 4/10 · Minor
- Chance of severe wind over 30 yrs
- 22.0%
Air-quality risk 4/10 · Minor
- Unhealthy air days now
- 4 days/yr
- Unhealthy air days in 30 yrs
- 6 days/yr
Risk factors via First Street. Map © Google.
Why this score? — see what drove the C grade
The composite is a weighted blend of 9 inputs, each scored 0–100. Each bar is that input's sub-score; the figure is the points it added to the 100-point composite (weight × sub-score).
- Cash flow +19.0/30.0
- ARV discount +15.0/15.0
- DSCR +6.0/10.0
- 1% rule +5.8/10.0
- Livability +4.2/5.0
- Rent growth +3.3/5.0
- Schools +2.7/10.0
- Condition / age +2.5/5.0
- Appreciation +0.0/10.0
$200,000
🖨 Deal sheet (PDF) 📄 Offer letter ✓ Due diligence
Listing remarks MLS
ESTATE PROPERTY SOLD AS IS WITH NO SELLER'S PROPERTY DISCLOSURE STATEMENT. Location, Location, Location . . . Peoplestown is one of Atlanta's hottest neighborhoods. Just a short stroll to DH Stanton Park & Beltline Entrance, The Beacon, Grant Park, Zoo Atlanta, Centre Parc Stadium (former Braves Stadium), and the GSU Convocation Center (Basketball Arena). This original 1930's bungalow that needs a lot of LOVE or perfect location for a new build. 3 Bedrooms 1 Bathrooms on a level lot with easy access to shopping, interstates, downtown Atlanta and Hartsfield International Airport.
Key facts
- Level lot
- 5,998 sq ft lot
- Built 1930
Tags
Property features AI
Finance
- HOA & community: Near Beltline
Exterior
- Parking: Driveway; Open parking available
- Utilities: Public water; Public sewer; 110-volt electric
- Home design: One-level home; Resale property
- Construction: Composition roof; Block foundation; Construction materials: Other
- Exterior features: Front porch
Interior
- Kitchen: Kitchen features: Other; Appliances: Other
- Bedrooms: Three main-level bedrooms; Other bedroom features
- Flooring: Wood flooring
- Bathrooms: One full bathroom (main level); Master bath: Other features
- Heating & cooling: Heating: Other; Cooling: Other
- Interior features: No shared/common walls; Other interior features
- Laundry & utility: Laundry features: Other
Neighborhood map
What this means for you Summary
Snapshot
- This is a 3-bed/1.0-bath single-family listed at $200k.
Deal economics
- At list price, monthly cash flow is $208 ($2k/yr) — positive.
- The deal already cash-flows at list — no discount required.
- Meets the 1% rule at list price ($2k rent vs $200k).
- Recommended offer: $197k (1.5% below list) — sets the bar for market timing.
- Cap rate 7.5% vs local median 3.1% in Atlanta — top-decile yield for the area; either an underpriced asset or a hidden risk that comps aren't pricing in. Stress-test before assuming the spread holds.
Location & tenants
- Location reads 83/100 on livability (#6 in GA, #919 nationally) — a professional / high-income tenant draw. Strengths: amenities A+, commute A+, housing A+; Watch: cost of living C-.
- Atlanta Public Schools (urban): math 28% / reading 35% proficiency, ranked #80 of 174 in GA (top 46%) — families likely to look elsewhere, expect single-tenant / working-renter base with shorter leases; 71% free/reduced lunch — lower-income household profile, screen leases tightly.
- Zoned schools: Barack And Michelle Obama Academy (math 8% / reading 8%, grade F, #1,125 of 1,228 statewide, top 93%, 258 students, 100% FRL); Martin L. King Jr. Middle School (math 16% / reading 23%, grade F, #356 of 470 statewide, top 78%, 818 students, 100% FRL); Maynard Jackson High School (math 30% / reading 24%, grade F, #160 of 424 statewide, top 38%, 1,474 students, 44% FRL).
- Zoned-school proficiency averages 18% at this address vs 32% district-wide (-13 pts) — the specific schools serving this property underperform the Atlanta Public Schools average; the district grade overstates school quality for this exact location.
- Market conditions: Rents rising (+3.2%/yr); 391 active listings in the ZIP; 40 comparable units currently listed for rent nearby; rentals at typical pace (median 17d on market — plan ~3-4 weeks tenant-placement turnaround); 11,565 units permitted in Fulton County in 2024 (8,159 in 5+ unit buildings).
- At $2,157/mo this rent would consume 51% of the median local household income ($51k/yr) (locally 2962% of renters already pay >50% of income on rent) — very limited rent-growth headroom before tenants either downsize or default.
Forward outlook
- Local home prices are declining (-3.0%/yr); year-one equity from $1k of loan paydown is wiped out by about $6k of value loss. Plan a longer hold.
- Fulton County population projected at +38% by 2050 — long-run rental-demand tailwind backs the buy-and-hold thesis.
Negotiation context
- It's been on market 29 days — a 2% lower offer ($197k) is reasonable based on typical stale-listing flexibility.
- 6 sale attempts since 2y ago with the ask held roughly flat each time — persistent listings suggest the price (not the market) is what's stuck; bring a comps-based counter.
Risks & watch-outs
- Watch-outs: built in 1930 — expect roof / HVAC / electrical / plumbing capex.
- Climate carrying-cost: extreme-heat days projected 7→18/yr by 2055 (HVAC capex compounding) — expect insurance premiums to compound above CPI over the hold.
Questions for the listing agent
- Built in 1930 — when were the roof, HVAC, electrical panel, plumbing, and water heater last replaced?
- Is there a deadline driving the sale (1031 exchange, divorce, estate, relocation)? That informs how much negotiation room exists.
- What's the average days-on-market for RENTAL listings here right now (not sales)? A rising rental-DOM trend means longer vacancies and softer asking-rent achievability than the comps imply.
- What's the recent tenant-quality profile in this submarket — average credit score on applications, eviction rate, late-payment / NSF rate, and stable-employment percentage? A property-management company in the area should have these aggregated.
- How much new for-sale + rental construction is in the pipeline within 1–3 miles? Heavy new supply typically softens prices + rents 12–24 months out; constrained supply supports both.
Investment metrics
- 1% rule
- 1.08% ✓
- Cap rate
- 7.54%
- Cash-on-cash
- 4.45%
- DSCR
- 1.20
- GRM
- 7.7
CMA / ARV
- ARV (median comp)
- $367,177
- List price
- $200,000
- Delta
- -45.53%
- Verdict
- UNDERPRICED
- Comps
- 20 within 1.0 mi
Show comp detail 12 sales within ~0.75 mi
| Address | Dist | Beds/Ba | Sqft | Sold | Price | $/sf | Match |
|---|---|---|---|---|---|---|---|
| 972 Fern Ave SE | 0.07mi | 3/2.0 | 1,200 (+3%) | 9mo | $259,000 | $216 | 80 |
| 1079 Grant Way SE | 0.35mi | 3/2.0 | 1,148 (-2%) | 2mo | $340,000 | $296 | 75 |
| 73 Haygood Ave SE | 0.07mi | 3/1.0 | 1,323 (+14%) | 1mo | $164,000 | $124 | 73 |
| 1058 Grant Ter SE | 0.38mi | 3/2.0 | 1,148 (-2%) | 4mo | $309,500 | $270 | 72 |
| 946 Crew St SW | 0.23mi | 2/1.0 (-1) | 1,218 (+4%) | 8mo | $208,000 | $171 | 70 |
| 1078 Grant Ter SE | 0.40mi | 4/2.0 (+1) | 1,148 (-2%) | 5mo | $303,500 | $264 | 65 |
| 1000 Washington St | 0.28mi | 4/1.0 (+1) | 1,040 (-11%) | 1mo | $165,000 | $159 | 63 |
| 970 Washington St SW | 0.29mi | 3/1.0 | 1,288 (+10%) | 10mo | $185,250 | $144 | 60 |
| 1227 Hill St | 0.58mi | 3/2.0 | 1,210 (+4%) | 8mo | $475,000 | $393 | 56 |
| 1388 Lansing St | 0.73mi | 3/2.0 | 1,152 (-1%) | 7mo | $380,000 | $330 | 54 |
| 43 Gammon Ave SE | 0.65mi | 3/1.0 | 1,296 (+11%) | 6mo | $165,000 | $127 | 46 |
| 1057 Fortress Ave SW | 0.52mi | 3/2.0 | 1,300 (+12%) | 10mo | $262,000 | $202 | 45 |
Match score weights: distance 35% · size 25% · config 20% · recency 20%. Top-matched comps best support the ARV.
Projected returns pro-forma
-3.0% appreciation · 3.23% rent growth · sell at horizon
- IRR
- -9.0%
- Equity multiple
- 0.67×
- Total profit
- $-18,567
- Equity at exit
- $29,821
- IRR
- 0.8%
- Equity multiple
- 1.06×
- Total profit
- $3,358
- Equity at exit
- $17,292
Cash invested: $56,000 (down + closing). Projections, not guarantees.
Landlord ↔ Tenant lean methodology
- Overall (STATE)
- 90 Strongly Landlord-Friendly
- State Georgia
- 90 Strongly Landlord-Friendly · R+3
- County
- — inherits STATE
- City
- — inherits STATE
ZIP-level market 30315
- Rents YoY
- 3.2%
- Active inventory
- 391
- Price-to-rent
- 7.7×
Monthly cashflow live
- Estimated rent
- $2,157 high interval (Pro) →
- Mortgage (P&I)
- −$1,049
- Tax from tax record
- −$364 /mo · $4,366/yr
- Insurance
- −$83
- HOA
- −$0
- Vacancy / Maint / Mgmt
- −$453
- Net cashflow
- $208
Break-even live
Sensitivity live
| Price | -10% $321 | -5% $264 | +0% $208 | +5% $151 | +10% $95 |
|---|---|---|---|---|---|
| Rent | -10% $37 | -5% $123 | +0% $208 | +5% $293 | +10% $378 |
| Rate | -1.0pp $309 | -0.5pp $259 | base $208 | +0.5pp $156 | +1.0pp $103 |
UW: 25.0% down · 7.5% · 30yr · 1.5% tax · 5.0% vac · 8.0% maint · 8.0% mgmt
Financing live
Cash to close
- Down payment
- $50,000
- Closing costs
- $6,000
- Reserves months
- —
- Total cash needed
- —
Loan-product check · same deal, 3 products live
Conventional
25% down · 7.5% · 30yr
- Down + closing
- —
- Monthly P&I
- —
- Monthly cashflow
- —
- DSCR
- —
- Eligible?
- —
Personal DTI + credit; lowest rate.
DSCR
20% down · 8.5% · 30yr
- Down + closing
- —
- Monthly P&I
- —
- Monthly cashflow
- —
- DSCR
- —
- Eligible?
- —
No personal income docs; deal must DSCR.
Hard money
10% down · 12.0% · 12mo
- Down + closing
- —
- Monthly P&I
- —
- Monthly cashflow
- —
- DSCR
- —
- Eligible?
- —
Short-term bridge; refi at stabilization.
Rent comps 40 comps
| Address | Beds | Baths | Sqft | Rent | $/sqft | DOM | Units | Dist |
|---|---|---|---|---|---|---|---|---|
| 1054 Atlanta, GA | 3.0–4.0 | 2.0 | 1295 | $1,974 | $1.52 | 21d | 2 | 0.10mi |
| 1056 Hank Aaron Dr SW Atlanta, GA | 1.0–2.0 | 1.0 | 753 | $1,139 | $1.51 | 8d | 6 | 0.13mi |
| 967 Martin St SE Atlanta, GA | 3.0 | 2.0 | 1162 | $1,950 | $1.68 | 25d | 1 | 0.16mi |
| 72 Milton Ave SE Atlanta, GA | 2.0 | 1.0–2.0 | 818 | $2,050 | $2.50 | 0d | 18 | 0.17mi |
| 45 Boynton Ave SE Atlanta, GA | 2.0–4.0 | 2.5–4.0 | 1452 | $2,938 | $2.02 | 0d | 14 | 0.17mi |
| 940 Martin St SE Atlanta, GA | 3.0 | 3.0 | 1364 | $2,495 | $1.83 | 25d | 1 | 0.21mi |
| 875 Hank Aaron Dr SW Atlanta, GA | 1.0–3.0 | 1.0–2.0 | 916 | $1,688 | $1.84 | 25d | 1 | 0.28mi |
| 222 Tuskegee St SE Atlanta, GA | 2.0–3.0 | 1.0–2.0 | 1202 | $1,525 | $1.27 | 25d | 6 | 0.34mi |
| 125 Milton Ave SE Atlanta, GA | 2.0 | 1.0–2.0 | 965 | $2,494 | $2.58 | 0d | 31 | 0.38mi |
| 51 Little St SE Atlanta, GA | 3.0 | 2.5 | 1478 | $2,995 | $2.03 | 25d | 1 | 0.41mi |
| 979 Hill St SE Atlanta, GA | 3.0 | 2.0 | 1380 | $3,000 | $2.17 | 23d | 1 | 0.42mi |
| 1000 Hill St SE Unit A Atlanta, GA | 2.0 | 1.0 | 1500 | $2,323 | $1.55 | 8d | 1 | 0.44mi |
| 207 South Ave SE Atlanta, GA | 2.0 | 1.0 | 750 | $1,977 | $2.64 | 25d | 1 | 0.45mi |
| 767 Terry St SE Unit B Atlanta, GA | 3.0 | 2.0 | 1330 | $2,600 | $1.95 | 25d | 1 | 0.46mi |
| 825 Hank Aaron Dr SW Atlanta, GA | 2.0 | 2.0 | 861 | $1,470 | $1.71 | 25d | 1 | 0.52mi |
| 60 Adore Ct SE Atlanta, GA | 2.0 | 2.0 | 1139 | $2,200 | $1.93 | 16d | 1 | 0.52mi |
| 720 Hank Aaron Dr SE Atlanta, GA | 2.0 | 1.0–2.0 | 891 | $2,234 | $2.51 | 0d | 27 | 0.56mi |
| 691 Concrete Aly SE Atlanta, GA | 2.0 | 2.0 | 1171 | $4,521 | $3.86 | 19d | 1 | 0.61mi |
| 141 McDonough Blvd SE Atlanta, GA | 3.0 | 2.0 | 1242 | $2,250 | $1.81 | 25d | 1 | 0.62mi |
| 679 Arcos Way SE Atlanta, GA | 2.0 | 2.5 | 1500 | $2,650 | $1.77 | 17d | 1 | 0.64mi |
| 1093 West Ave SW Atlanta, GA | 2.0 | 1.0–2.0 | 770 | $1,414 | $1.84 | 0d | 6 | 0.65mi |
| 795 Grant St SE Atlanta, GA | 3.0 | 2.0 | 1474 | $5,200 | $3.53 | 3d | 1 | 0.66mi |
| 235 Dodd Ave SW Atlanta, GA | 2.0 | 2.0 | 1120 | $1,595 | $1.42 | 0d | 1 | 0.72mi |
| 430 Englewood Ave SE Atlanta, GA | 3.0 | 1.0–2.0 | 938 | $3,605 | $3.84 | 2d | 28 | 0.74mi |
| 1048 Garibaldi St SW Atlanta, GA | 2.0 | 2.0 | 1280 | $2,150 | $1.68 | 25d | 1 | 0.76mi |
| 565 Hank Aaron Dr SW Atlanta, GA | 1.0–3.0 | 1.0–2.0 | 1139 | $3,064 | $2.69 | 0d | 22 | 0.78mi |
| 117 Thayer Ave SE Atlanta, GA | 3.0 | 1.0 | 1241 | $1,666 | $1.34 | 15d | 1 | 0.79mi |
| 174 Moury Ave SW Atlanta, GA | 1.0–3.0 | 1.0–2.0 | 926 | $1,728 | $1.87 | 4d | 6 | 0.81mi |
| 1175 Garibaldi St SW Atlanta, GA | 3.0 | 2.5 | 1364 | $2,295 | $1.68 | 0d | 1 | 0.83mi |
| 1040 Smith St SW Atlanta, GA | 3.0 | 2.5 | 1500 | $1,595 | $1.06 | 25d | 1 | 0.84mi |
| 1455 Jonesboro Rd SE Atlanta, GA | 2.0 | 1.0 | 700 | $2,000 | $2.86 | 25d | 1 | 0.86mi |
| 95 Thirkield Ave SE Atlanta, GA | 3.0 | 2.0 | 1096 | $1,850 | $1.69 | 17d | 1 | 0.87mi |
| 95 Thirkield Ave SE Atlanta, GA | 3.0 | 2.0 | 1096 | $1,850 | $1.69 | 0d | 1 | 0.87mi |
| 91 Thirkield Ave SE Atlanta, GA | 2.0 | 1.0 | 1092 | $1,995 | $1.83 | 25d | 1 | 0.87mi |
| 356 Georgia Ave SE Atlanta, GA | 4.0 | 2.0 | 1472 | $3,195 | $2.17 | 17d | 1 | 0.89mi |
| 840 Smith St SW Unit A Atlanta, GA | 2.0 | 1.5 | 910 | $1,550 | $1.70 | 17d | 1 | 0.92mi |
| 1015 Boulevard SE Atlanta, GA | 2.0 | 1.0–2.0 | 933 | $2,707 | $2.90 | 0d | 17 | 0.95mi |
| 1099 Boulevard SE Atlanta, GA | 2.0 | 1.0–2.0 | 928 | $2,206 | $2.38 | 0d | 34 | 0.96mi |
| 1187 McDaniel St SW Unit B Atlanta, GA | 2.0 | 1.0 | 1038 | $1,025 | $0.99 | 13d | 1 | 0.97mi |
| 547 Atlanta Ave SE Atlanta, GA | 2.0 | 1.0 | 1000 | $1,850 | $1.85 | 25d | 1 | 0.98mi |
Listing history 11 events
-
2026-04-27$200,000 New 592-char remark
Show marketing remark (592 chars)
ESTATE PROPERTY SOLD AS IS WITH NO SELLER'S PROPERTY DISCLOSURE STATEMENT. Location, Location, Location . . . Peoplestown is one of Atlanta's hottest neighborhoods. Just a short stroll to DH Stanton Park & Beltline Entrance, The Beacon, Grant Park, Zoo Atlanta, Centre Parc Stadium (former Braves Stadium), and the GSU Convocation Center (Basketball Arena). This original 1930's bungalow that needs a lot of LOVE or perfect location for a new build. 3 Bedrooms 1 Bathrooms on a level lot with easy access to shopping, interstates, downtown Atlanta and Hartsfield International Airport.
-
2026-04-27$200,000 Active 592-char remark
Show marketing remark (592 chars)
ESTATE PROPERTY SOLD AS IS WITH NO SELLER'S PROPERTY DISCLOSURE STATEMENT. Location, Location, Location . . . Peoplestown is one of Atlanta's hottest neighborhoods. Just a short stroll to DH Stanton Park & Beltline Entrance, The Beacon, Grant Park, Zoo Atlanta, Centre Parc Stadium (former Braves Stadium), and the GSU Convocation Center (Basketball Arena). This original 1930's bungalow that needs a lot of LOVE or perfect location for a new build. 3 Bedrooms 1 Bathrooms on a level lot with easy access to shopping, interstates, downtown Atlanta and Hartsfield International Airport.
-
2024-10-10status Active
-
2024-10-10status Back On Market
-
2024-10-10historical
-
2024-10-10historical
-
2024-09-24status Pending
-
2024-09-20status Under Contract
-
2024-09-20historical Active Under Contract
-
2024-09-06$200,000 Active
-
2024-09-06$200,000 New
ⓘ Source: listings_history table (triggers on properties + properties_extension) + one-shot
backfill from property_details.listing_events for pre-trigger history.
Tax reassessment forecast GA · Resets to sale price
- Current annual tax
- $4,366 · $364/mo
- Projected year-2 tax
- $4,366 · $364/mo
- Expected delta
- $0/yr ($0/mo · 0.0%)
ⓘ Screening estimate from a state-policy table — verify with the county assessor before closing.
Climate risk First Street
- Flood 1/10 Low FEMA zone X (unshaded) · 0% chance over 30 yrs
- Wildfire 1/10 Low
- Heat 5/10 Major 7 d/yr ≥105°F today · 18 d/yr by 30 yrs out
- Wind 4/10 Moderate 22% chance of damaging wind over 30 yrs
- Air quality 4/10 Moderate 4 unhealthy d/yr today · 6 by 30 yrs out
Nearby sold comps map
Loading sold comps map…
Walkable amenities ~0.75 mi
Loading nearby amenities…
Taxation est. · year 1
- Rental income
- $25,881
- − Mortgage interest
- −$11,203
- − Property taxes
- −$4,366
- − Insurance
- −$1,000
- − Repairs & maintenance
- −$2,070
- − Management
- −$2,070
- − Depreciation
- −$5,818
- Taxable loss
- −$647
- Est. tax savings @ 24.0%
- +$155
- After-tax cash flow
- $2,650/yr
For passive investors: Depreciation is non-cash, so a rental often shows a tax loss while cash-flowing — sheltering income. Rental losses are passive: they offset passive income freely, and up to $25,000/yr can offset ordinary (W-2) income if you actively participate and your MAGI is under $100k (phasing out to $0 by $150k); unused losses carry forward. On sale, claimed depreciation is recaptured at up to 25%, and gains may owe capital-gains tax (a 1031 exchange can defer both). Figures are a year-1 estimate at your 24.0% rate — not tax advice; consult a CPA.
Schools (NCES district)
- District
- Atlanta Public Schools
- NCES district ID
- 1300120
- Math proficiency
- 28% ▼ -6.00%
- Reading proficiency
- 35% ▼ -2.00%
- Median HH income
- $48,306
- Composite
- 27.27/100
- National rank
- #7006
- State rank
- #80 of 174 in GA
Livability — Atlanta
- Score
- 83/100
- State rank
- #6
- US rank
- #919
Category grades
Schools grade is shown separately in the Schools card above.
Census & demographics
- Census place
- Atlanta, GA
- County
- Fulton County · 1,094,430 people
- City population
- 629,525
- Metro
- Atlanta-Sandy Springs-Alpharetta, GA
- Population (ZIP)
- 34,264
- Household income
- $50,822
- Rent vs Own
- Severe rent burden
- 2962.0
Population outlook (Fulton County) Hauer SSP2
- Today (2025)
- 1,203,707 people
- By 2030
- 1,299,706 · +8.0%
- By 2040
- 1,488,256 · +23.6%
- By 2050
- 1,664,580 · +38.3%
- By 2075
- 2,036,072 · +69.2%
- By 2100
- 2,222,402 · +84.6%
Race, ethnicity, and origin ACS 2023
- Neighborhood character
- Predominantly Black (72%)
- Race & ethnicity
- Black 72% White 14% Hispanic / Latino 10% Two or more races 4%
- Hispanic origin (detail)
- Mexican 4%
- Common ancestry
- Romanian 1% Italian 1% Lithuanian 1%
- Foreign-born
- 5% · Canada
- Languages at home
- 90% English-only · Spanish 9% French/Haitian/Cajun 1%
Political lean MEDSL · Fulton
- 2024 margin
- Solid D (+44.9) · D 71.9% · R 27.0% · Other 1.1%
- 2008→2024 swing
- +9.8pp toward D · 2008: 35.0pp · 2024: 44.9pp
- All cycles
- 2024: D+44.9 2020: D+46.4 2016: D+42.1 2012: D+29.6 2008: D+35.0
Not yet ingested
- Civics
- —
Market trends
- HPI YoY
- ▼ -281.87%
- Current HPI
- 176.673
- Rent YoY
- ▲ 3.23%
- Metro
- Atlanta-Sandy Springs-Alpharetta, GA
- State GDP YoY
- ▲ 2.66%
- F500 in state
- 28
Industry mix (Fortune 500 HQ in GA)
| Industry | F500 HQs | Revenue |
|---|---|---|
| Paper / Packaging | 2 | $29B |
|
||
| Retail | 1 | $160B |
|
||
| Transportation / Logistics | 1 | $91B |
|
||
| Airlines | 1 | $62B |
|
||
| Consumer Goods | 1 | $47B |
|
||
| Utilities | 1 | $25B |
|
||
Price history
+0.0% since first listed14 events — show timeline
- 2026-05-27 Pending — FMLS
- 2026-05-19 Pending — GAMLS
- 2026-05-19 Contingent — FMLS
- 2026-04-27 Listed $200,000 GAMLS
- 2026-04-27 Listed $200,000 FMLS
- 2024-10-10 Relisted — FMLS
- 2024-10-10 Relisted — GAMLS
- 2024-10-10 Listing Removed — GAMLS
- 2024-10-10 Listing Removed — FMLS
- 2024-09-24 Pending — FMLS
- 2024-09-20 Pending — GAMLS
- 2024-09-20 Contingent — FMLS
- 2024-09-06 Listed $200,000 GAMLS
- 2024-09-06 Listed $200,000 FMLS
Property tax history
+5.2%/yrLatest (2025): $4,366 · +4.7% YoY. Source: county tax records.
Cash-flow waterfall
monthlySold comps — $/sqft
last 12 mo · ≤1 miLoading sold comps…