90 Gold St Unit 18N · New York, NY
Flood risk 7/10 · Major
- FEMA flood zone
- X (unshaded)
- Chance of flooding over 30 yrs
- 0.77%
- Est. flood insurance / yr
- $507 – $1,088
Fire risk 1/10 · Minimal
- Est. fire insurance / yr
- $691 – $1,283
Heat risk 7/10 · Major
- Hot days now (above 99°F)
- 7 days/yr
- Hot days in 30 yrs
- 15 days/yr
Wind risk 6/10 · Moderate
- Chance of severe wind over 30 yrs
- 27.0%
Air-quality risk 4/10 · Minor
- Unhealthy air days now
- 5 days/yr
- Unhealthy air days in 30 yrs
- 7 days/yr
Risk factors via First Street. Map © Google.
Why this score? — see what drove the D grade
The composite is a weighted blend of 9 inputs, each scored 0–100. Each bar is that input's sub-score; the figure is the points it added to the 100-point composite (weight × sub-score).
- Cash flow +7.9/30.0
- ARV discount +7.5/15.0
- Appreciation +5.0/10.0
- Schools +5.0/10.0
- 1% rule +4.0/10.0
- Condition / age +4.0/5.0
- Livability +3.8/5.0
- Rent growth +3.6/5.0
- DSCR +2.0/10.0
$680,000
🖨 Deal sheet 📄 Offer letter ✓ Due diligence
Listing remarks
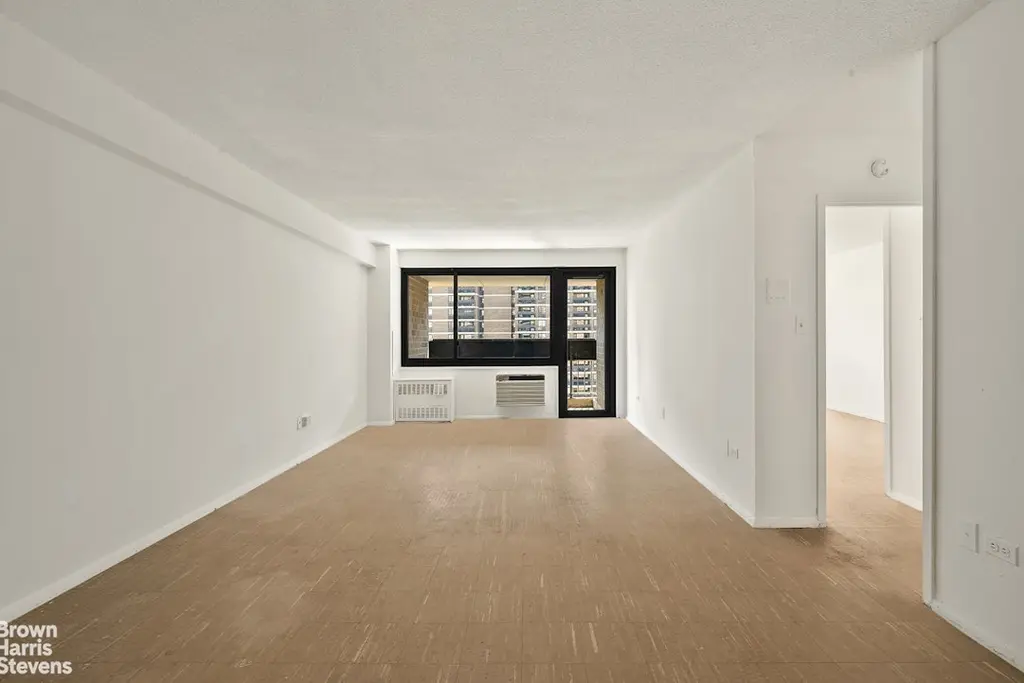
Sunlit South-Facing One Bedroom with Dramatic Water Views and Incredibly Low Maintenance-Electricity Included! Step into this calm, well-proportioned one-bedroom home perched high within the sought-after Southbridge Towers community. South-facing windows line the living space, drawing in beautiful natural light and framing dramatic open views stretching out over the water. The roomy living and dining area comfortably fits a full seating layout while still leaving space for a proper dining setup. The generously sized kitchen is a blank canvas, ready to become the chef's kitchen you've always wanted. The king-sized bedroom shares those same bright, open views and easy natural light, and th
Key facts
- Dramatic water views
- King-sized bedroom
- $875 HOA
Tags
Property features AI
Finance
- Other: Building offers elevator(s) and storage; Pets allowed in building (policies vary)
- HOA & community: Monthly association fee of $875
Exterior
- Parking: Has garage
- Home design: Located in a 6-story building; Building name: SOUTHBRIDGE TOWERS; Entry on level 18
- Exterior features: Building courtyard; Balcony; Private outdoor space under 60 sqft; Has a view
Interior
- Bathrooms: 1 full bathroom
- Interior features: Total of 3 rooms; Basement present (other type)
- Laundry & utility: Building laundry
Neighborhood map
What this means for you Summary
Snapshot
- This is a 1-bed/1.0-bath condo listed at $680k. Condition is rated good.
Deal economics
- At list price, monthly cash flow is $-786 ($-9k/yr) — negative.
- To cash-flow at today's rent, offer at most $566k (16.7% below list).
- To meet the 1% rule (rent ≥ 1% of price), the offer needs to be $615k (9.6% below list).
- Recommended offer: $566k (16.7% below list) — sets the bar for cash-flow.
- Cap rate 5.0% vs local median 2.6% in New York — top-decile yield for the area; either an underpriced asset or a hidden risk that comps aren't pricing in. Stress-test before assuming the spread holds.
Location & tenants
- Location reads 75/100 on livability (#268 in NY, #4,188 nationally) — a middle-class / working-renter tenant base. Strengths: amenities A+, commute A+, health & safety A; Watch: crime F, cost of living F.
- Market conditions: Rents rising fast (+4.3%/yr); 112 active listings in the ZIP; 31 comparable units currently listed for rent nearby; rentals leasing fast (median 8d on market — plan ~1-2 weeks tenant-placement turnaround); solid renter incomes; 4,467 units permitted in New York County in 2024 (4,463 in 5+ unit buildings).
- At $6,145/mo this rent would consume 70% of the median local household income ($105k/yr) (locally 1501% of renters already pay >50% of income on rent) — very limited rent-growth headroom before tenants either downsize or default.
Forward outlook
- In year one you build about $25k of equity ($5k loan paydown + $20k appreciation (3.0% local appreciation)).
- New York County population projected at +21% by 2050 — long-run rental-demand tailwind backs the buy-and-hold thesis.
- By year 2, paydown + projected appreciation supports a ~$41k cash-out refi (75% LTV) — recoverable capital for the next deal without selling this one.
Negotiation context
- Only 13 days on market — expect competitive offers; lowballing is unlikely to land.
Risks & watch-outs
- Watch-outs: flood insurance adds $66/mo.
- Climate carrying-cost: major flood risk; major wind risk, 27% chance of damaging wind over 30y; extreme-heat days projected 7→15/yr by 2055 (HVAC capex compounding) — expect insurance premiums to compound above CPI over the hold.
Questions for the listing agent
- What do current leases actually rent for vs. the listed asking? Can we see a recent rent roll and the last 12 months of T-12 income?
- Built in 1971 — when were the roof, HVAC, electrical panel, plumbing, and water heater last replaced?
- What's the actual annual flood-insurance premium (NFIP or private), and is the property in a SFHA with mandatory coverage?
- What does the HOA fee cover, when was the last increase, and are there any pending special assessments or reserve-fund shortfalls?
- Any open or pending special assessments — roof, HVAC, plumbing, elevator, façade? What's the per-unit balance and payoff schedule, and is the seller paying it off at close or rolling it to the buyer?
- Is there a deadline driving the sale (1031 exchange, divorce, estate, relocation)? That informs how much negotiation room exists.
- Schools are B-rated — typically a magnet for longer-tenancy family renters. What's the average tenant stay here, and is there a school-zone premium baked into asking?
- Crime grade is F in this area — have there been break-ins, vandalism, or insurance claims at this property in the last 3 years? What carrier currently insures it and at what premium?
- The area grade is low — what's the realistic commute time and amenity access for the typical tenant pool here? Any planned neighborhood developments (good or bad) we should know about?
- What's the average days-on-market for RENTAL listings here right now (not sales)? A rising rental-DOM trend means longer vacancies and softer asking-rent achievability than the comps imply.
- What's the recent tenant-quality profile in this submarket — average credit score on applications, eviction rate, late-payment / NSF rate, and stable-employment percentage? A property-management company in the area should have these aggregated.
- How much new apartment / multifamily construction is in the pipeline within 1–3 miles? Heavy new supply (>2% of stock underway) typically softens rents 12–24 months out; light construction supports rent growth.
Investment metrics
- 1% rule
- 0.90% ✗
- Cap rate
- 5.02%
- Cash-on-cash
- -4.54%
- DSCR
- 0.80
- GRM
- 9.2
CMA / ARV
No comps found within radius.
Projected returns pro-forma
3.0% appreciation · 4.28% rent growth · sell at horizon
- IRR
- 3.7%
- Equity multiple
- 1.21×
- Total profit
- $40,535
- Equity at exit
- $305,757
- IRR
- 7.7%
- Equity multiple
- 2.20×
- Total profit
- $227,702
- Equity at exit
- $471,209
Cash invested: $190,400 (down + closing). Projections, not guarantees.
Landlord ↔ Tenant lean methodology
- Overall (CITY)
- 0 Strongly Tenant-Friendly
- State New York
- 15 Strongly Tenant-Friendly · D+10
- County
- — inherits STATE
- City New York
- 0 Strongly Tenant-Friendly · D+34
ZIP-level market 10038
- Rents YoY
- 4.3%
- Active inventory
- 112
- Price-to-rent
- 9.2×
Monthly cashflow live
- Estimated rent
- $6,145 high interval (Pro) →
- Mortgage (P&I)
- −$3,566
- Tax est. 1.5%
- −$850 /mo · $10,200/yr
- Insurance
- −$283
- Flood insurance flood zone
- −$66 /mo · $798/yr
- HOA
- −$875
- Vacancy / Maint / Mgmt
- −$1,290
- Net cashflow
- $-786
Break-even live
UW: 25.0% down · 7.5% · 30yr · 1.5% tax · 5.0% vac · 8.0% maint · 8.0% mgmt
Financing live
Cash to close
- Down payment
- $170,000
- Closing costs
- $20,400
- Reserves months
- —
- Total cash needed
- —
Loan-product check · same deal, 3 products live
Conventional
25% down · 7.5% · 30yr
- Down + closing
- —
- Monthly P&I
- —
- Monthly cashflow
- —
- DSCR
- —
- Eligible?
- —
Personal DTI + credit; lowest rate.
DSCR
20% down · 8.5% · 30yr
- Down + closing
- —
- Monthly P&I
- —
- Monthly cashflow
- —
- DSCR
- —
- Eligible?
- —
No personal income docs; deal must DSCR.
Hard money
10% down · 12.0% · 12mo
- Down + closing
- —
- Monthly P&I
- —
- Monthly cashflow
- —
- DSCR
- —
- Eligible?
- —
Short-term bridge; refi at stabilization.
Rent comps 31 comps
| Address | Beds | Baths | Sqft | Rent | $/sqft | DOM | Units | Dist |
|---|---|---|---|---|---|---|---|---|
| 180 Water St #537 New York, NY | 1.0–2.0 | 1.0–2.0 | 728 | $8,040 | $11.04 | 2d | 2 | 0.22mi |
| 140 Broadway Unit 1298277P New York, NY | 1.0 | 1.0 | 699 | $9,406 | $13.46 | 22d | 1 | 0.34mi |
| 63 Wall St #1971 New York, NY | — | 1.0 | 489 | $5,190 | $10.61 | 20d | 1 | 0.38mi |
| 67 Wall St #13 New York, NY | 1.0–2.0 | 1.0 | 636 | $5,750 | $9.03 | 2d | 2 | 0.38mi |
| 75 Wall St Unit 251 New York, NY | 1.0 | 1.5 | 653 | $6,580 | $10.08 | 24d | 1 | 0.39mi |
| 75 Wall St New York, NY | 3.0 | 1.0–3.0 | 452 | $7,598 | $16.81 | 15d | 16 | 0.39mi |
| 95 Wall St New York, NY | 2.0 | 1.0–2.0 | 733 | $5,862 | $8.00 | 1d | 39 | 0.41mi |
| 105 Duane St #183 New York, NY | 2.0 | 1.0–2.0 | 821 | $9,000 | $10.96 | 2d | 3 | 0.41mi |
| 111 Worth St New York, NY | 1.0–2.0 | 1.0–2.0 | 747 | $6,077 | $8.14 | 7d | 7 | 0.42mi |
| 10 Hanover Sq New York, NY | 2.0 | 1.0–2.0 | 790 | $5,948 | $7.53 | 2d | 25 | 0.45mi |
| 3 Hanover Sq New York, NY | 3.0 | 1.0–2.0 | 600 | $4,534 | $7.56 | 24d | 5 | 0.46mi |
| 88 Leonard St New York, NY | 1.0 | 1.0 | 598 | $7,966 | $13.32 | 7d | 13 | 0.49mi |
| 25 Water St Apt 706 New York, NY | — | 1.0 | 550 | $3,990 | $7.25 | 24d | 1 | 0.62mi |
| 25 Water St Unit 707 New York, NY | — | 1.0 | 550 | $3,950 | $7.18 | 24d | 1 | 0.62mi |
| 120 Mulberry St Unit 1257050P New York, NY | 2.0 | 1.0 | 645 | $12,372 | $19.18 | 24d | 1 | 0.62mi |
| 389 S End Ave New York, NY | 3.0 | 1.0–2.0 | 1080 | $6,685 | $6.19 | 1d | 36 | 0.70mi |
| 1 West St #546 New York, NY | 1.0 | 1.0 | 700 | $5,770 | $8.24 | 20d | 1 | 0.71mi |
| 400 Chambers St #587 New York, NY | 2.0 | 1.0–1.5 | 675 | $7,370 | $10.91 | 7d | 3 | 0.79mi |
| 107 Columbia Hts #1757 Brooklyn, NY | 1.0–2.0 | 1.0–2.0 | 708 | $5,710 | $8.06 | 2d | 2 | 0.86mi |
| 125 Delancey St #1523 New York, NY | 1.0–2.0 | 1.0–2.0 | 850 | $7,860 | $9.25 | 2d | 2 | 1.02mi |
| 180 Broome St #1521 New York, NY | 1.0–2.0 | 1.0–2.0 | 850 | $7,970 | $9.38 | 2d | 2 | 1.05mi |
| 160 Front St Brooklyn, NY | 1.0 | 1.0 | 597 | $5,191 | $8.70 | 2d | 2 | 1.08mi |
| 229 Chrystie St New York, NY | 1.0–2.0 | 1.0–2.0 | 810 | $6,120 | $7.56 | 4d | 3 | 1.13mi |
| 11 E 1st St New York, NY | 2.0 | 1.0–2.0 | 1060 | $8,078 | $7.62 | 1d | 1 | 1.18mi |
| 68 Gold St New York, NY | 1.0–2.0 | 1.0 | 700 | $3,610 | $5.16 | 24d | 2 | 1.19mi |
| 171 Suffolk St #1265 New York, NY | 1.0–2.0 | 1.0 | 650 | $6,950 | $10.69 | 7d | 2 | 1.26mi |
| 180 Montague St Brooklyn, NY | 3.0 | 1.0–2.0 | 901 | $5,327 | $5.91 | 1d | 13 | 1.27mi |
| 141 Joralemon St #819 Brooklyn, NY | 1.0–3.0 | 1.0–2.0 | 750 | $5,820 | $7.76 | 2d | 3 | 1.29mi |
| 200 Montague St #1516 Brooklyn, NY | 1.0 | 1.0 | 600 | $7,500 | $12.50 | 20d | 1 | 1.31mi |
| 10 Downing St #131 New York, NY | 1.0 | 1.0 | 731 | $9,050 | $12.38 | 4d | 2 | 1.33mi |
| 104 MacDougal St Unit 1056263P New York, NY | 2.0 | 1.0 | 441 | $9,375 | $21.26 | 22d | 1 | 1.35mi |
HOA detail condo
- Monthly dues
- $875 · $10,500/yr
- Likely covers
- waterelectric
- Assessments
- None detected in remarks — confirm with the listing agent.
Listing history 9 events
-
2026-06-18days on market $680,000 Active 13 DOM
-
2026-06-17days on market $680,000 Active 12 DOM
-
2026-06-16days on market $680,000 Active 11 DOM
-
2026-06-15days on market $680,000 Active 10 DOM
-
2026-06-13days on market $680,000 Active 8 DOM
-
2026-06-09days on market $680,000 Active 4 DOM
-
2026-06-08days on market $680,000 Active 3 DOM
-
2026-06-07remarks 699-char remark
-
2026-06-07$680,000 Active 2 DOM
ⓘ Source: listings_history table (triggers on properties + properties_extension) + one-shot
backfill from property_details.listing_events for pre-trigger history.
Climate risk First Street
- Flood 7/10 Severe FEMA zone X (unshaded) · 77% chance over 30 yrs
- Wildfire 1/10 Low
- Heat 7/10 Severe 7 d/yr ≥99°F today · 15 d/yr by 30 yrs out
- Wind 6/10 Major 27% chance of damaging wind over 30 yrs
- Air quality 4/10 Moderate 5 unhealthy d/yr today · 7 by 30 yrs out
Nearby sold comps map
Loading sold comps map…
Walkable amenities ~0.75 mi
Loading nearby amenities…
Taxation est. · year 1
- Rental income
- $73,742
- − Mortgage interest
- −$38,091
- − Property taxes
- −$10,200
- − Insurance
- −$4,198
- − Repairs & maintenance
- −$5,899
- − Management
- −$5,899
- − HOA
- −$10,500
- − Depreciation
- −$19,782
- Taxable loss
- −$20,826
- Est. tax savings @ 24.0%
- +$4,998
- After-tax cash flow
- $-4,435/yr
For passive investors: Depreciation is non-cash, so a rental often shows a tax loss while cash-flowing — sheltering income. Rental losses are passive: they offset passive income freely, and up to $25,000/yr can offset ordinary (W-2) income if you actively participate and your MAGI is under $100k (phasing out to $0 by $150k); unused losses carry forward. On sale, claimed depreciation is recaptured at up to 25%, and gains may owe capital-gains tax (a 1031 exchange can defer both). Figures are a year-1 estimate at your 24.0% rate — not tax advice; consult a CPA.
Condition & rehab AI · 9 photos
This one-bedroom condo is in good condition with a good condition score of 80. It has a good foundation, structure, and exterior, and the interior walls and paint are in good condition. The kitchen and bathroom are average, and the windows and HVAC systems are in good condition. The home has good curb appeal and is located in a desirable area with water views. The home is ready for a fresh coat of paint and updated appliances and fixtures to increase its resale value.
Value-add opportunities
- Resale Painting the interior walls and cabinets — Fresh paint can make a significant difference in the home's appearance and appeal to potential buyers.
- Resale Updating the kitchen appliances — Modern appliances can enhance the home's appeal and functionality, making it more attractive to potential buyers.
- Resale Upgrading the bathroom fixtures — New fixtures can improve the home's functionality and appeal, making it more attractive to potential buyers.
Renovation cost estimate screening
Value-add ROI direction
- Resale Painting the interior walls and cabinets — Fresh paint can make a significant difference in the home's appearance and appeal to potential buyers. ↑
- Resale Updating the kitchen appliances — Modern appliances can enhance the home's appeal and functionality, making it more attractive to potential buyers. ↑
- Resale Upgrading the bathroom fixtures — New fixtures can improve the home's functionality and appeal, making it more attractive to potential buyers. ↑
ⓘ Cost ranges are severity-bucket heuristics (US national rule-of-thumb). Get contractor quotes + a written scope before underwriting a rehab budget.
Schools (NCES district)
No district data.
Livability — New York
- Score
- 75/100
- State rank
- #268
- US rank
- #4188
Category grades
Schools grade is shown separately in the Schools card above.
Census & demographics
- Census place
- New York, NY
- County
- New York County · 1,599,927 people
- City population
- 7,731,280
- Metro
- New York-Newark-Jersey City, NY-NJ-PA
- Population (ZIP)
- 22,235
- Household income
- $105,419
- Rent vs Own
- Severe rent burden
- 1501.0
Population outlook (New York County) Hauer SSP2
- Today (2025)
- 1,825,725 people
- By 2030
- 1,904,611 · +4.3%
- By 2040
- 2,052,719 · +12.4%
- By 2050
- 2,206,601 · +20.9%
- By 2075
- 2,509,427 · +37.4%
- By 2100
- 2,702,933 · +48.0%
Race, ethnicity, and origin ACS 2023
- Neighborhood character
- Highly diverse neighborhood (Simpson 0.71)
- Race & ethnicity
- White 42% Asian 29% Hispanic / Latino 12% Black 10% Two or more races 9%
- Hispanic origin (detail)
- Mexican 2% Puerto Rican 5% Dominican 1%
- Common ancestry
- Romanian 3% Scotch-Irish 2% Italian 2%
- Foreign-born
- 27% · China, Canada, South Korea
- Languages at home
- 62% English-only · Chinese 18% Spanish 11% Russian/Polish/Slavic 2%
Political lean MEDSL · New York
- 2024 margin
- Solid D (+64.8) · D 82.4% · R 17.6%
- 2008→2024 swing
- -7.4pp toward R · 2008: 72.2pp · 2024: 64.8pp
- All cycles
- 2024: D+64.8 2020: D+74.5 2016: D+77.2 2012: D+69.6 2008: D+72.2
Not yet ingested
- Civics
- —
Market trends
- HPI YoY
- —
- Current HPI
- —
- Rent YoY
- ▲ 4.28%
- Metro
- New York-Newark-Jersey City, NY-NJ-PA
- State GDP YoY
- ▲ 2.60%
- F500 in state
- 92
Industry mix (Fortune 500 HQ in NY)
| Industry | F500 HQs | Revenue |
|---|---|---|
| Financial Services | 10 | $950B |
|
||
| Consumer Goods | 9 | $162B |
|
||
| Insurance | 4 | $225B |
|
||
| Telecommunications | 2 | $144B |
|
||
| Pharmaceuticals | 2 | $112B |
|
||
| Media / Entertainment | 2 | $69B |
|
||
Price history
1 event — show timeline
- 2026-06-05 Listed $680,000 RLS at REBNY
Cash-flow waterfall
monthlySold comps — $/sqft
last 12 mo · ≤1 miLoading sold comps…