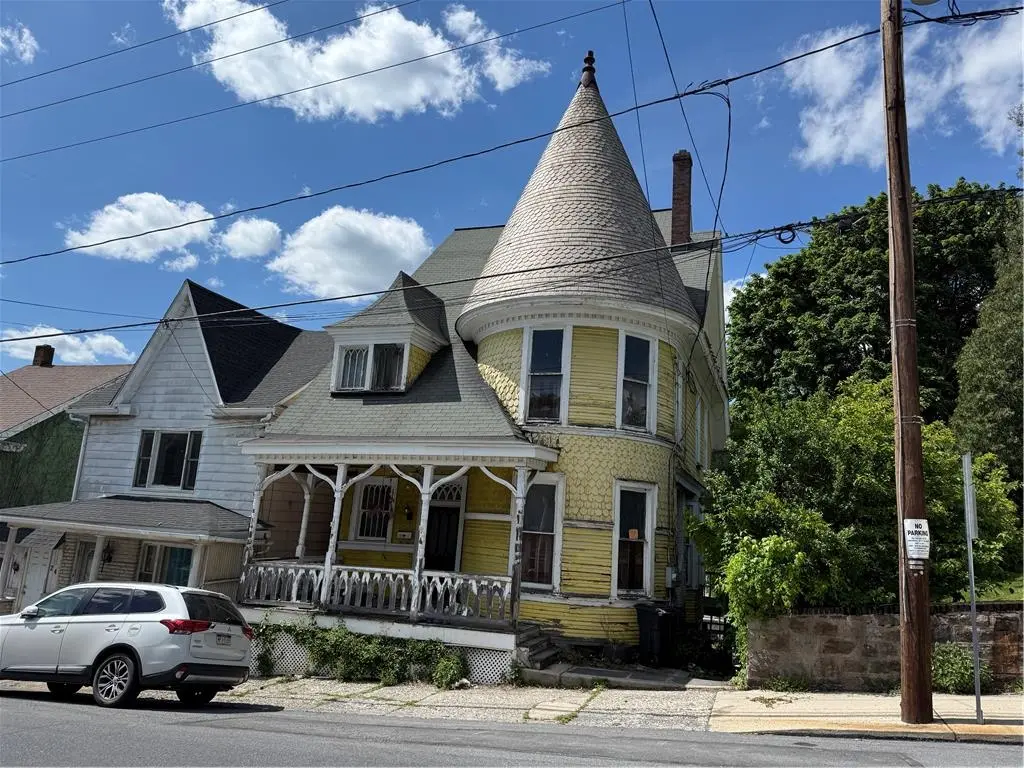
243 E Patterson St · Lansford, PA
Flood risk 1/10 · Minimal
- FEMA flood zone
- X (unshaded)
- Chance of flooding over 30 yrs
- 0.0%
- Est. flood insurance / yr
- $507 – $1,088
Fire risk 3/10 · Minor
- Est. fire insurance / yr
- $511 – $949
Heat risk 3/10 · Minor
- Hot days now (above 94°F)
- 8 days/yr
- Hot days in 30 yrs
- 17 days/yr
Wind risk 4/10 · Minor
- Chance of severe wind over 30 yrs
- 8.0%
Air-quality risk 2/10 · Minimal
- Unhealthy air days now
- 1 days/yr
- Unhealthy air days in 30 yrs
- 3 days/yr
Risk factors via First Street. Map © Google.
Why this score? — see what drove the A grade
The composite is a weighted blend of 9 inputs, each scored 0–100. Each bar is that input's sub-score; the figure is the points it added to the 100-point composite (weight × sub-score).
- Cash flow +30.0/30.0
- ARV discount +15.0/15.0
- 1% rule +10.0/10.0
- DSCR +10.0/10.0
- Appreciation +9.6/10.0
- Livability +3.6/5.0
- Rent growth +2.5/5.0
- Condition / age +2.5/5.0
- Schools +2.0/10.0
$69,000
🖨 Deal sheet 📄 Offer letter ✓ Due diligence
Listing remarks MLS
Owner called today - 5/29/07 - and said he will listen to any offer. He wants to sell now. Call office for more details.
Key facts
- 4-bedroom layout
- 2,396 sq ft lot
- Garage
Tags
Property features AI
Exterior
- Parking: On-street parking; 1-car garage
- Utilities: 200+ amp electrical service with circuit breakers; Public water; Public sewer
- Home design: 3-story building; Vinyl and wood siding exterior; Asphalt/fiberglass/slate roof
- Construction: Vinyl siding; Wood siding; Built with asphalt, fiberglass and slate roof
- Exterior features: Lot approximately 0.055 acres
Interior
- Kitchen: Kitchen on first level (approx. 10 x 12)
- Bedrooms: Bedroom on third level (approx. 14 x 14); Bedroom on second level (approx. 10 x 12); Bedroom on second level (approx. 12 x 12); Bedroom on second level (approx. 10 x 12)
- Bathrooms: One full bathroom (second level, approx. 8 x 8)
- Heating & cooling: Electric baseboard heating
- Interior features: Dining area; Separate/formal dining room; Walk-out basement access
- Laundry & utility: Electric water heater
Neighborhood map
What this means for you Summary
Snapshot
- This is a 3-bed/1.0-bath single-family listed at $69k.
Deal economics
- At list price, monthly cash flow is $548 ($7k/yr) — positive.
- The deal already cash-flows at list — no discount required.
- Meets the 1% rule at list price ($1k rent vs $69k).
- Cap rate 15.8% vs local median 9.5% in Lansford — top-decile yield for the area; either an underpriced asset or a hidden risk that comps aren't pricing in. Stress-test before assuming the spread holds.
Location & tenants
- Location reads 72/100 on livability (#605 in PA) — a middle-class / working-renter tenant base. Strengths: cost of living A+, health & safety A+, crime A-; Watch: amenities D, schools F, commute F.
- Panther Valley SD (rural): math 14% / reading 35% proficiency, ranked #477 of 539 in PA (top 88%) — low school quality limits family demand, transient renter base, plan for 1-2y turnover.
- Market conditions: 34 active listings in the ZIP; 15 comparable units currently listed for rent nearby; rentals at typical pace (median 24d on market — plan ~3-4 weeks tenant-placement turnaround); 40% of comp listings sitting > 30 days — soft ceiling on asking rent; lower-income renter base — watch delinquency; 180 units permitted in Carbon County in 2024 (10 in 5+ unit buildings).
- This rent runs 36% of the median local income ($45k/yr) — at the standard rent-burdened threshold; future hikes will face affordability resistance.
Forward outlook
- In year one you build about $7k of equity ($477 loan paydown + $6k appreciation (9.1% local appreciation)).
- Carbon County population projected at -18% by 2050 — secular population decline; favor cash flow + early exit over multi-decade hold.
- At projected returns (9.1% appreciation + 3.0% rent growth), your $19k cash investment doubles in ~2 years — after that, you're playing with house money.
- By year 5, paydown + projected appreciation supports a ~$31k cash-out refi (75% LTV) — recoverable capital for the next deal without selling this one.
Negotiation context
- Only 7 days on market — expect competitive offers; lowballing is unlikely to land.
- 2 sale attempts since 19y ago with the ask held roughly flat each time — persistent listings suggest the price (not the market) is what's stuck; bring a comps-based counter.
- Current owner paid $45k; list at $69k implies a 53% gain — meaningful room to come down on a strong offer.
Risks & watch-outs
- Watch-outs: built in 1900 — expect roof / HVAC / electrical / plumbing capex.
Questions for the listing agent
- Built in 1900 — when were the roof, HVAC, electrical panel, plumbing, and water heater last replaced?
- Is there a deadline driving the sale (1031 exchange, divorce, estate, relocation)? That informs how much negotiation room exists.
- Schools are F-rated, which usually means shorter tenancies and higher turnover. Who's the typical renter profile here, and what's been the actual vacancy rate?
- What's the average days-on-market for RENTAL listings here right now (not sales)? A rising rental-DOM trend means longer vacancies and softer asking-rent achievability than the comps imply.
- What's the recent tenant-quality profile in this submarket — average credit score on applications, eviction rate, late-payment / NSF rate, and stable-employment percentage? A property-management company in the area should have these aggregated.
- How much new for-sale + rental construction is in the pipeline within 1–3 miles? Heavy new supply typically softens prices + rents 12–24 months out; constrained supply supports both.
Investment metrics
- 1% rule
- 1.96% ✓
- Cap rate
- 15.82%
- Cash-on-cash
- 34.01%
- DSCR
- 2.51
- GRM
- 4.2
CMA / ARV
- ARV (on-the-fly)
- $113,760
- Comps found
- 12
Show comp detail 12 sales within ~0.75 mi
| Address | Dist | Beds/Ba | Sqft | Sold | Price | $/sf | Match |
|---|---|---|---|---|---|---|---|
| 212 E Kline Ave | 0.11mi | 2/1.0 (-1) | 1,283 (-11%) | 3mo | $99,500 | $78 | 69 |
| 529 Patterson St | 0.30mi | 2/1.0 (-1) | 1,400 (-3%) | 16mo | $106,000 | $76 | 63 |
| 107 W Patterson St | 0.38mi | 4/2.0 (+1) | 1,557 (+8%) | 8mo | $89,100 | $57 | 53 |
| 239 W Bertsch St | 0.56mi | 3/1.5 | 1,584 (+10%) | 5mo | $125,000 | $79 | 51 |
| 341 W Ridge St | 0.67mi | 3/1.5 | 1,384 (-4%) | 13mo | $79,000 | $57 | 49 |
| 124 E Hazard St | 0.66mi | 3/1.5 | 1,536 (+7%) | 8mo | $164,900 | $107 | 49 |
| 24 W Fell St | 0.50mi | 3/1.5 | 1,645 (+14%) | 2mo | $161,000 | $98 | 49 |
| 251 W Ludlow St | 0.67mi | 4/1.5 (+1) | 1,504 (+4%) | 8mo | $275,000 | $183 | 48 |
| 35 Sharpe St | 0.58mi | 4/1.5 (+1) | 1,552 (+8%) | 13mo | $149,900 | $97 | 42 |
| 216 Oak St | 0.61mi | 3/1.0 | 1,232 (-14%) | 10mo | $100,000 | $81 | 39 |
| 361 W Water St | 0.70mi | 2/2.0 (-1) | 1,365 (-5%) | 17mo | $65,000 | $48 | 36 |
| 338-1/2 W Abbott St | 0.66mi | 3/1.0 | 1,262 (-12%) | 16mo | $80,500 | $64 | 35 |
Match score weights: distance 35% · size 25% · config 20% · recency 20%. Top-matched comps best support the ARV.
Projected returns pro-forma
9.12% appreciation · 3.0% rent growth · sell at horizon
- IRR
- 49.0%
- Equity multiple
- 4.54×
- Total profit
- $68,373
- Equity at exit
- $57,768
- IRR
- 43.4%
- Equity multiple
- 9.96×
- Total profit
- $173,143
- Equity at exit
- $120,181
Cash invested: $19,320 (down + closing). Projections, not guarantees.
Landlord ↔ Tenant lean methodology
- Overall (STATE)
- 62 Landlord-Friendly
- State Pennsylvania
- 62 Landlord-Friendly · EVEN
- County
- — inherits STATE
- City
- — inherits STATE
ZIP-level market 18232
- Home prices YoY
- 3.6%
- Active inventory
- 34
- Price-to-rent
- 4.2×
Monthly cashflow live
- Estimated rent
- $1,355 high interval (Pro) →
- Mortgage (P&I)
- −$362
- Tax from tax record
- −$132 /mo · $1,590/yr
- Insurance
- −$29
- HOA
- −$0
- Vacancy / Maint / Mgmt
- −$285
- Net cashflow
- $548
Break-even live
UW: 25.0% down · 7.5% · 30yr · 1.5% tax · 5.0% vac · 8.0% maint · 8.0% mgmt
Financing live
Cash to close
- Down payment
- $17,250
- Closing costs
- $2,070
- Reserves months
- —
- Total cash needed
- —
Loan-product check · same deal, 3 products live
Conventional
25% down · 7.5% · 30yr
- Down + closing
- —
- Monthly P&I
- —
- Monthly cashflow
- —
- DSCR
- —
- Eligible?
- —
Personal DTI + credit; lowest rate.
DSCR
20% down · 8.5% · 30yr
- Down + closing
- —
- Monthly P&I
- —
- Monthly cashflow
- —
- DSCR
- —
- Eligible?
- —
No personal income docs; deal must DSCR.
Hard money
10% down · 12.0% · 12mo
- Down + closing
- —
- Monthly P&I
- —
- Monthly cashflow
- —
- DSCR
- —
- Eligible?
- —
Short-term bridge; refi at stabilization.
Rent comps 15 comps
| Address | Beds | Baths | Sqft | Rent | $/sqft | DOM | Units | Dist |
|---|---|---|---|---|---|---|---|---|
| 317 E Bertsch St Unit 1 Lansford, PA | 2.0 | 1.0 | 1650 | $1,400 | $0.85 | 43d | 1 | 0.11mi |
| 323 E Bertsch St Unit A-1 Lansford, PA | 2.0 | 1.0 | 1250 | $1,450 | $1.16 | 43d | 1 | 0.12mi |
| 10 Leisenring St Lansford, PA | 3.0 | 1.0 | 1422 | $1,100 | $0.77 | 43d | 1 | 0.32mi |
| 546 E Kline Ave Lansford, PA | 3.0 | 1.0 | 1000 | $900 | $0.90 | 2d | 1 | 0.34mi |
| 149 W Ridge St Unit 1A Lansford, PA | 2.0 | 1.0 | 930 | $1,350 | $1.45 | 23d | 1 | 0.44mi |
| 149 W Ridge St Unit 2b Lansford, PA | 2.0 | 1.0 | 875 | $1,325 | $1.51 | 23d | 1 | 0.44mi |
| 149 W Ridge St Unit 1B Lansford, PA | 3.0 | 1.0 | 1654 | $1,500 | $0.91 | 19d | 1 | 0.44mi |
| 149 W Ridge St Unit 3A Lansford, PA | 3.0 | 1.0 | 1550 | $1,650 | $1.06 | 43d | 1 | 0.44mi |
| 214 N Oak St Unit 2 Summit Hill, PA | 3.0 | 1.0 | 940 | $1,200 | $1.28 | 2d | 1 | 0.64mi |
| 214 N Oak St Summit Hill, PA | 3.0 | 1.0 | 940 | $1,250 | $1.33 | 2d | 1 | 0.64mi |
| 214 N Oak St Unit 2 Summit Hill, PA | 3.0 | 1.0 | 940 | $1,250 | $1.33 | 43d | 1 | 0.64mi |
| 214 N Oak St Unit 2 Summit Hill, PA | 3.0 | 1.0 | 940 | $1,250 | $1.33 | 19d | 1 | 0.64mi |
| 215 E High St Coaldale, PA | 3.0 | 1.0 | 1000 | $1,000 | $1.00 | 21d | 1 | 1.36mi |
| 151 E High St Coaldale, PA | 3.0 | 1.0 | 1312 | $1,200 | $0.91 | 43d | 1 | 1.40mi |
| 126 E High St Coaldale, PA | 4.0 | 1.5 | 1000 | $1,200 | $1.20 | 14d | 1 | 1.44mi |
Listing history 7 events
-
2026-06-18days on market $69,000 Active 7 DOM
-
2026-06-17days on market $69,000 Active 6 DOM
-
2026-06-16days on market $69,000 Active 5 DOM
-
2026-06-15days on market $69,000 Active 4 DOM
-
2026-06-14days on market $69,000 Active 2 DOM
-
2026-06-13remarks 699-char remark
-
2026-06-13$69,000 Active 1 DOM
ⓘ Source: listings_history table (triggers on properties + properties_extension) + one-shot
backfill from property_details.listing_events for pre-trigger history.
Tax reassessment forecast PA · Partial reset (capped growth)
- Current annual tax
- $1,590 · $132/mo
- Projected year-2 tax
- $1,590 · $132/mo
- Expected delta
- $0/yr ($0/mo · 0.0%)
ⓘ Screening estimate from a state-policy table — verify with the county assessor before closing.
Climate risk First Street
- Flood 1/10 Low FEMA zone X (unshaded) · 0% chance over 30 yrs
- Wildfire 3/10 Moderate
- Heat 3/10 Moderate 8 d/yr ≥94°F today · 17 d/yr by 30 yrs out
- Wind 4/10 Moderate 8% chance of damaging wind over 30 yrs
- Air quality 2/10 Low 1 unhealthy d/yr today · 3 by 30 yrs out
Nearby sold comps map
Loading sold comps map…
Walkable amenities ~0.75 mi
Loading nearby amenities…
Taxation est. · year 1
- Rental income
- $16,263
- − Mortgage interest
- −$3,865
- − Property taxes
- −$1,590
- − Insurance
- −$345
- − Repairs & maintenance
- −$1,301
- − Management
- −$1,301
- − Depreciation
- −$2,007
- Taxable income
- $5,854
- Est. tax owed @ 24.0%
- −$1,405
- After-tax cash flow
- $5,166/yr
For passive investors: Depreciation is non-cash, so a rental often shows a tax loss while cash-flowing — sheltering income. Rental losses are passive: they offset passive income freely, and up to $25,000/yr can offset ordinary (W-2) income if you actively participate and your MAGI is under $100k (phasing out to $0 by $150k); unused losses carry forward. On sale, claimed depreciation is recaptured at up to 25%, and gains may owe capital-gains tax (a 1031 exchange can defer both). Figures are a year-1 estimate at your 24.0% rate — not tax advice; consult a CPA.
Schools (NCES district)
- District
- Panther Valley SD
- NCES district ID
- 4218450
- Math proficiency
- 14% ▼ -7.00%
- Reading proficiency
- 35% ▼ -14.00%
- Median HH income
- $36,914
- Composite
- 20.31/100
- National rank
- #8613
- State rank
- #477 of 539 in PA
Livability — Lansford
- Score
- 72/100
- State rank
- #605
- US rank
- #5834
Category grades
Schools grade is shown separately in the Schools card above.
Census & demographics
- Census place
- Lansford, PA
- County
- Carbon County · 13,404 people
- City population
- 4,156
- Metro
- Allentown-Bethlehem-Easton, PA-NJ
- Population (ZIP)
- 4,156
- Household income
- $44,713
- Rent vs Own
- Severe rent burden
- 123.0
Population outlook (Carbon County) Hauer SSP2
- Today (2025)
- 61,643 people
- By 2030
- 59,840 · -2.9%
- By 2040
- 55,413 · -10.1%
- By 2050
- 50,843 · -17.5%
- By 2075
- 43,326 · -29.7%
- By 2100
- 37,126 · -39.8%
Race, ethnicity, and origin ACS 2023
- Neighborhood character
- Diverse neighborhood (Simpson 0.55)
- Race & ethnicity
- White 64% Hispanic / Latino 17% Black 11% Two or more races 11% Native American 4%
- Hispanic origin (detail)
- Puerto Rican 5%
- Common ancestry
- Romanian 4% Polish 2% Iranian 2%
- Foreign-born
- 7% · Canada, Jamaica, South Korea
- Languages at home
- 89% English-only · Spanish 10%
Political lean MEDSL · Carbon
- 2024 margin
- Solid R (+34.8) · D 32.2% · R 67.0%
- 2008→2024 swing
- -36.7pp toward R · 2008: 1.9pp · 2024: -34.8pp
- All cycles
- 2024: R+34.8 2020: R+32.0 2016: R+34.1 2012: R+6.9 2008: D+1.9
Not yet ingested
- Civics
- —
Market trends
- HPI YoY
- ▲ 9.12%
- Current HPI
- 262.3396
- Rent YoY
- —
- Metro
- Allentown-Bethlehem-Easton, PA-NJ
- State GDP YoY
- ▲ 1.68%
- F500 in state
- 34
Industry mix (Fortune 500 HQ in PA)
| Industry | F500 HQs | Revenue |
|---|---|---|
| Healthcare | 2 | $309B |
|
||
| Insurance | 2 | $27B |
|
||
| Telecommunications / Media | 1 | $124B |
|
||
| Industrial Distribution | 1 | $22B |
|
||
| Financial Services | 1 | $20B |
|
||
| Chemicals / Materials | 1 | $18B |
|
||
Price history
+15.2% since first listed4 events — show timeline
- 2026-06-11 Listed $69,000 GLVRMLS
- 2007-06-28 Sold (MLS) $45,000 GLVRMLS
- 2007-06-22 Sold (Public Records) $45,000 Public Records
- 2007-03-29 Listed $59,900 GLVRMLS
Property tax history
+1.5%/yrLatest (2026): $1,590 · +2.4% YoY. Source: county tax records.
Cash-flow waterfall
monthlySold comps — $/sqft
last 12 mo · ≤1 miLoading sold comps…