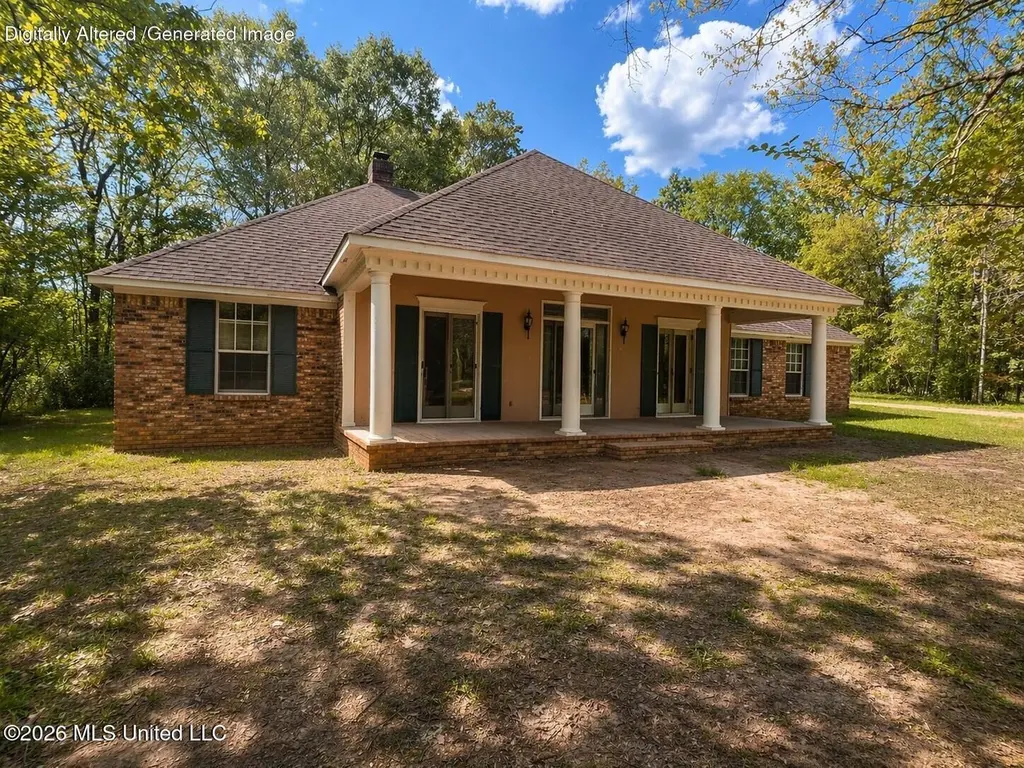
853 Longwood Pl · Pearl, MS
Flood risk 1/10 · Minimal
- FEMA flood zone
- X (unshaded)
- Chance of flooding over 30 yrs
- 0.0%
- Est. flood insurance / yr
- $507 – $1,088
Fire risk 4/10 · Minor
- Est. fire insurance / yr
- $1,241 – $2,305
Heat risk 7/10 · Major
- Hot days now (above 109°F)
- 7 days/yr
- Hot days in 30 yrs
- 20 days/yr
Wind risk 8/10 · Major
- Chance of severe wind over 30 yrs
- 80.0%
Air-quality risk 2/10 · Minimal
- Unhealthy air days now
- 1 days/yr
- Unhealthy air days in 30 yrs
- 1 days/yr
Risk factors via First Street. Map © Google.
Why this score? — see what drove the C- grade
The composite is a weighted blend of 9 inputs, each scored 0–100. Each bar is that input's sub-score; the figure is the points it added to the 100-point composite (weight × sub-score).
- Cash flow +15.0/30.0
- ARV discount +15.0/15.0
- DSCR +4.6/10.0
- Rent growth +4.1/5.0
- Livability +3.7/5.0
- Schools +3.6/10.0
- 1% rule +3.5/10.0
- Condition / age +2.5/5.0
- Appreciation +0.0/10.0
$225,100
🖨 Deal sheet 📄 Offer letter ✓ Due diligence
Listing remarks MLS
Priced below most recent appraisal! This renovation-ready property is full of potential and ready for your personal touch! Nestled on a private 2.3-acre wooded lot, this spacious home offers room to grow, design, and make it your own. Inside, you'll find a versatile layout featuring: 3 bedrooms, 2 bathrooms, a formal dining room, formal living room den with tall, beamed ceilings, bright sunroom, breakfast area and a walk-in pantry. Outside, the property continues to impress with a three-car garage plus an additional one-car carport, offering ample space for vehicles or storage. Feel miles away while staying conveniently located near Pearl, Brandon, Flowood, I-20, shopping, dining, and more. Don't miss this chance to invest in a property with great bones and endless potential! Photos have been enhanced with AI.
Key facts
- Versatile layout
- Formal dining room
- Private wooded lot
Tags
Neighborhood map
What this means for you Summary
Snapshot
- This is a 3-bed/1.0-bath single-family listed at $225k.
Deal economics
- At list price, monthly cash flow is $71 ($847/yr) — positive.
- The deal already cash-flows at list — no discount required.
- To meet the 1% rule (rent ≥ 1% of price), the offer needs to be $191k (15.3% below list).
- Recommended offer: $191k (15.3% below list) — sets the bar for 1% rule.
- Cap rate 6.7% vs local median 5.5% in Pearl — meaningfully above typical; check what's discounted (condition, days-on-market, listing class) to confirm the premium yield is real.
Location & tenants
- Location reads 73/100 on livability (#19 in MS) — a middle-class / working-renter tenant base. Strengths: cost of living A+, housing A+, health & safety A+; Watch: schools D+, amenities F, commute F.
- Pearl Public School District (suburban): math 44% / reading 42% proficiency, ranked #32 of 130 in MS (top 25%) — families likely to look elsewhere, expect single-tenant / working-renter base with shorter leases.
- Market conditions: Rents rising fast (+6.3%/yr); 265 active listings in the ZIP; 1 comparable units currently listed for rent nearby; 343 units permitted in Rankin County in 2024 (0 in 5+ unit buildings).
- This rent runs 35% of the median local income ($65k/yr) — at the standard rent-burdened threshold; future hikes will face affordability resistance.
Forward outlook
- Local home prices are declining (-3.0%/yr); year-one equity from $2k of loan paydown is wiped out by about $7k of value loss. Plan a longer hold.
- Rankin County population projected at +17% by 2050 — long-run rental-demand tailwind backs the buy-and-hold thesis.
Negotiation context
- It's been on market 35 days — a 3% lower offer ($218k) is reasonable based on typical stale-listing flexibility.
Risks & watch-outs
- Climate carrying-cost: severe wind risk, 80% chance of damaging wind over 30y; extreme-heat days projected 7→20/yr by 2055 (HVAC capex compounding) — expect insurance premiums to compound above CPI over the hold.
Questions for the listing agent
- It's been on market 35 days. Have you received any prior offers? Is the seller open to a 15% concession, seller financing, or rate buy-down credit?
- Is there a deadline driving the sale (1031 exchange, divorce, estate, relocation)? That informs how much negotiation room exists.
- Schools are D-rated, which usually means shorter tenancies and higher turnover. Who's the typical renter profile here, and what's been the actual vacancy rate?
- What's the average days-on-market for RENTAL listings here right now (not sales)? A rising rental-DOM trend means longer vacancies and softer asking-rent achievability than the comps imply.
- What's the recent tenant-quality profile in this submarket — average credit score on applications, eviction rate, late-payment / NSF rate, and stable-employment percentage? A property-management company in the area should have these aggregated.
- How much new for-sale + rental construction is in the pipeline within 1–3 miles? Heavy new supply typically softens prices + rents 12–24 months out; constrained supply supports both.
Investment metrics
- 1% rule
- 0.85% ✗
- Cap rate
- 6.67%
- Cash-on-cash
- 1.34%
- DSCR
- 1.06
- GRM
- 9.8
CMA / ARV
- ARV (median comp)
- $416,555
- List price
- $225,100
- Delta
- -45.96%
- Verdict
- UNDERPRICED
- Comps
- 20 within 1.0 mi
Show comp detail 11 sales within ~0.75 mi
| Address | Dist | Beds/Ba | Sqft | Sold | Price | $/sf | Match |
|---|---|---|---|---|---|---|---|
| 131 Richburg Ct | 0.33mi | 4/3.0 (+1) | 2,420 (+2%) | 7mo | $515,000 | $213 | 62 |
| 312 N Village Dr | 0.23mi | 3/2.5 | 2,200 (-7%) | 13mo | $362,000 | $165 | 61 |
| 204 Village Pl | 0.38mi | 4/3.0 (+1) | 2,251 (-5%) | 1mo | $379,000 | $168 | 60 |
| 577 Asbury Lane Dr | 0.14mi | 4/3.0 (+1) | 2,533 (+7%) | 10mo | $479,900 | $189 | 60 |
| 592 Asbury Ln Dr | 0.20mi | 4/3.0 (+1) | 2,517 (+6%) | 14mo | $475,500 | $189 | 56 |
| 707 Trailside Pl | 0.23mi | 4/3.0 (+1) | 2,321 (-2%) | 22mo | $410,000 | $177 | 55 |
| 137 Richburg Ct | 0.26mi | 4/3.0 (+1) | 2,408 (+2%) | 21mo | $474,900 | $197 | 54 |
| 144 Richburg Ct | 0.23mi | 4/3.0 (+1) | 2,446 (+3%) | 23mo | $469,900 | $192 | 52 |
| 129 Richburg Ct | 0.35mi | 4/3.0 (+1) | 2,405 (+2%) | 21mo | $480,900 | $200 | 50 |
| 128 Asbury Sq | 0.28mi | 4/2.5 (+1) | 2,190 (-7%) | 21mo | $339,000 | $155 | 46 |
| 404 Eldorado Rd | 0.70mi | 3/2.5 | 2,438 (+3%) | 23mo | $399,900 | $164 | 37 |
Match score weights: distance 35% · size 25% · config 20% · recency 20%. Top-matched comps best support the ARV.
Projected returns pro-forma
-3.0% appreciation · 6.34% rent growth · sell at horizon
- IRR
- -10.8%
- Equity multiple
- 0.60×
- Total profit
- $-25,404
- Equity at exit
- $33,563
- IRR
- 2.5%
- Equity multiple
- 1.20×
- Total profit
- $12,594
- Equity at exit
- $19,463
Cash invested: $63,028 (down + closing). Projections, not guarantees.
Landlord ↔ Tenant lean methodology
- Overall (STATE)
- 90 Strongly Landlord-Friendly
- State Mississippi
- 90 Strongly Landlord-Friendly · R+11
- County
- — inherits STATE
- City
- — inherits STATE
ZIP-level market 39208
- Home prices YoY
- -20.3%
- Rents YoY
- 6.3%
- Active inventory
- 265
- Price-to-rent
- 9.8×
Monthly cashflow live
- Estimated rent
- $1,907 medium interval (Pro) →
- Mortgage (P&I)
- −$1,180
- Tax from tax record
- −$162 /mo · $1,940/yr
- Insurance
- −$94
- HOA
- −$0
- Vacancy / Maint / Mgmt
- −$400
- Net cashflow
- $71
Break-even live
UW: 25.0% down · 7.5% · 30yr · 1.5% tax · 5.0% vac · 8.0% maint · 8.0% mgmt
Financing live
Cash to close
- Down payment
- $56,275
- Closing costs
- $6,753
- Reserves months
- —
- Total cash needed
- —
Loan-product check · same deal, 3 products live
Conventional
25% down · 7.5% · 30yr
- Down + closing
- —
- Monthly P&I
- —
- Monthly cashflow
- —
- DSCR
- —
- Eligible?
- —
Personal DTI + credit; lowest rate.
DSCR
20% down · 8.5% · 30yr
- Down + closing
- —
- Monthly P&I
- —
- Monthly cashflow
- —
- DSCR
- —
- Eligible?
- —
No personal income docs; deal must DSCR.
Hard money
10% down · 12.0% · 12mo
- Down + closing
- —
- Monthly P&I
- —
- Monthly cashflow
- —
- DSCR
- —
- Eligible?
- —
Short-term bridge; refi at stabilization.
Rent comps 1 comps
| Address | Beds | Baths | Sqft | Rent | $/sqft | DOM | Units | Dist |
|---|---|---|---|---|---|---|---|---|
| 453 Piney Dr Pearl, MS | 4.0 | 2.0 | 1835 | $2,500 | $1.36 | 13d | 1 | 1.19mi |
Listing history 2 events
-
2026-05-13price $225,100 825-char remark
Show marketing remark (825 chars)
Priced below most recent appraisal! This renovation-ready property is full of potential and ready for your personal touch! Nestled on a private 2.3-acre wooded lot, this spacious home offers room to grow, design, and make it your own. Inside, you'll find a versatile layout featuring: 3 bedrooms, 2 bathrooms, a formal dining room, formal living room den with tall, beamed ceilings, bright sunroom, breakfast area and a walk-in pantry. Outside, the property continues to impress with a three-car garage plus an additional one-car carport, offering ample space for vehicles or storage. Feel miles away while staying conveniently located near Pearl, Brandon, Flowood, I-20, shopping, dining, and more. Don't miss this chance to invest in a property with great bones and endless potential! Photos have been enhanced with AI.
-
2026-04-17$260,000 Active 825-char remark
Show marketing remark (825 chars)
Priced below most recent appraisal! This renovation-ready property is full of potential and ready for your personal touch! Nestled on a private 2.3-acre wooded lot, this spacious home offers room to grow, design, and make it your own. Inside, you'll find a versatile layout featuring: 3 bedrooms, 2 bathrooms, a formal dining room, formal living room den with tall, beamed ceilings, bright sunroom, breakfast area and a walk-in pantry. Outside, the property continues to impress with a three-car garage plus an additional one-car carport, offering ample space for vehicles or storage. Feel miles away while staying conveniently located near Pearl, Brandon, Flowood, I-20, shopping, dining, and more. Don't miss this chance to invest in a property with great bones and endless potential! Photos have been enhanced with AI.
ⓘ Source: listings_history table (triggers on properties + properties_extension) + one-shot
backfill from property_details.listing_events for pre-trigger history.
Tax reassessment forecast MS · Resets to sale price
- Current annual tax
- $1,940 · $162/mo
- Projected year-2 tax
- $1,940 · $162/mo
- Expected delta
- $0/yr ($0/mo · -0.0%)
ⓘ Screening estimate from a state-policy table — verify with the county assessor before closing.
Climate risk First Street
- Flood 1/10 Low FEMA zone X (unshaded) · 0% chance over 30 yrs
- Wildfire 4/10 Moderate
- Heat 7/10 Severe 7 d/yr ≥109°F today · 20 d/yr by 30 yrs out
- Wind 8/10 Severe 80% chance of damaging wind over 30 yrs
- Air quality 2/10 Low 1 unhealthy d/yr today · 1 by 30 yrs out
Nearby sold comps map
Loading sold comps map…
Walkable amenities ~0.75 mi
Loading nearby amenities…
Taxation est. · year 1
- Rental income
- $22,884
- − Mortgage interest
- −$12,609
- − Property taxes
- −$1,940
- − Insurance
- −$1,126
- − Repairs & maintenance
- −$1,831
- − Management
- −$1,831
- − Depreciation
- −$6,548
- Taxable loss
- −$3,001
- Est. tax savings @ 24.0%
- +$720
- After-tax cash flow
- $1,567/yr
For passive investors: Depreciation is non-cash, so a rental often shows a tax loss while cash-flowing — sheltering income. Rental losses are passive: they offset passive income freely, and up to $25,000/yr can offset ordinary (W-2) income if you actively participate and your MAGI is under $100k (phasing out to $0 by $150k); unused losses carry forward. On sale, claimed depreciation is recaptured at up to 25%, and gains may owe capital-gains tax (a 1031 exchange can defer both). Figures are a year-1 estimate at your 24.0% rate — not tax advice; consult a CPA.
Schools (NCES district)
- District
- Pearl Public School District
- NCES district ID
- 2803520
- Math proficiency
- 44% ▼ -9.00%
- Reading proficiency
- 42% ▼ -9.00%
- Median HH income
- $42,525
- Composite
- 36.29/100
- National rank
- #4699
- State rank
- #32 of 130 in MS
Livability — Pearl
- Score
- 73/100
- State rank
- #19
- US rank
- #5662
Category grades
Schools grade is shown separately in the Schools card above.
Census & demographics
- Census place
- Pearl, MS
- County
- Rankin County · 123,614 people
- City population
- 34,442
- Metro
- Jackson, MS
- Population (ZIP)
- 34,442
- Household income
- $65,480
- Rent vs Own
- Severe rent burden
- 1235.0
Population outlook (Rankin County) Hauer SSP2
- Today (2025)
- 164,317 people
- By 2030
- 171,013 · +4.1%
- By 2040
- 182,723 · +11.2%
- By 2050
- 192,376 · +17.1%
- By 2075
- 209,535 · +27.5%
- By 2100
- 209,534 · +27.5%
Race, ethnicity, and origin ACS 2023
- Neighborhood character
- Majority White (60%)
- Race & ethnicity
- White 60% Black 31% Hispanic / Latino 5% Two or more races 3% Asian 2%
- Common ancestry
- Italian 5% Slovak 1% Serbian 1%
- Foreign-born
- 3% · Canada, China
- Languages at home
- 93% English-only · Spanish 4% Other Indo-European 1% Other Asian/Pacific 1%
Political lean MEDSL · Rankin
- 2024 margin
- Solid R (+47.1) · D 25.9% · R 73.0% · Other 1.0%
- 2008→2024 swing
- +6.4pp toward D · 2008: -53.5pp · 2024: -47.1pp
- All cycles
- 2024: R+47.1 2020: R+45.4 2016: R+52.9 2012: R+51.9 2008: R+53.5
Not yet ingested
- Civics
- —
Market trends
- HPI YoY
- ▼ -49.11%
- Current HPI
- 193.0609
- Rent YoY
- ▲ 6.34%
- Metro
- Jackson, MS
- State GDP YoY
- —
- F500 in state
- 0
Price history
-13.4% since first listed2 events — show timeline
- 2026-05-13 Price Changed $225,100 MLSU
- 2026-04-17 Listed $260,000 MLSU
Property tax history
+2.5%/yrLatest (2025): $1,940 · +16.5% YoY. Source: county tax records.
Cash-flow waterfall
monthlySold comps — $/sqft
last 12 mo · ≤1 miLoading sold comps…