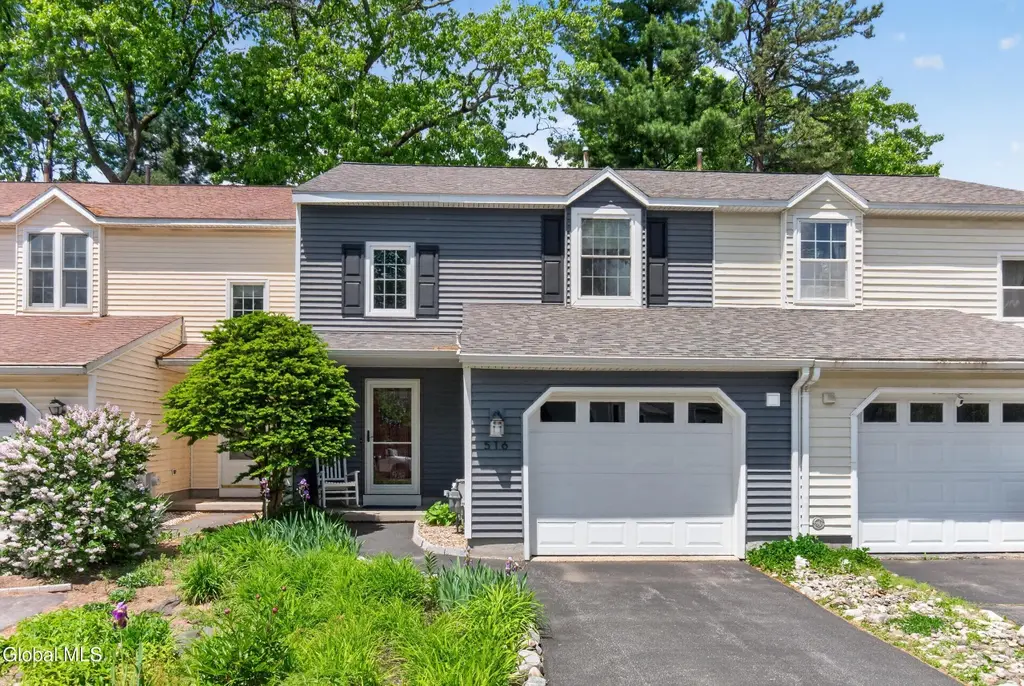
516 Elk Cir · Milton, NY
Flood risk 1/10 · Minimal
- FEMA flood zone
- X
- Chance of flooding over 30 yrs
- 0.0%
- Est. flood insurance / yr
- $507 – $1,088
Fire risk 3/10 · Minor
- Est. fire insurance / yr
- $691 – $1,283
Heat risk 3/10 · Minor
- Hot days now (above 97°F)
- 7 days/yr
- Hot days in 30 yrs
- 16 days/yr
Wind risk 2/10 · Minimal
- Chance of severe wind over 30 yrs
- 4.0%
Air-quality risk 2/10 · Minimal
- Unhealthy air days now
- 0 days/yr
- Unhealthy air days in 30 yrs
- 1 days/yr
Risk factors via First Street. Map © Google.
Why this score? — see what drove the D grade
The composite is a weighted blend of 9 inputs, each scored 0–100. Each bar is that input's sub-score; the figure is the points it added to the 100-point composite (weight × sub-score).
- Cash flow +12.4/30.0
- ARV discount +7.8/15.0
- Rent growth +5.0/5.0
- Schools +4.8/10.0
- DSCR +3.7/10.0
- Livability +3.3/5.0
- 1% rule +3.2/10.0
- Condition / age +2.5/5.0
- Appreciation +0.0/10.0
$299,900
🖨 Deal sheet (PDF) 📄 Offer letter ✓ Due diligence
Listing remarks MLS
IMMACULATE TOWNHOUSE W/ 2 BEDROOMS, 2 1/2 BATHS, PERGO FLOORS, FRESH PAINT, ALL APPLIANCES, STACKABLE WASHER DRYER, HOT TUB ON DECK ***PRUDENTIAL RESIDENTIAL SERVICES ADDENDUMS*** -- Excellent Condition
Key facts
- Quartz countertops
- Laundry closet
- Updated kitchen
Tags
Property features AI
Exterior
- Parking: Attached garage (1 car); Paved driveway parking; Total of 3 parking spaces
- Utilities: Public water; Public sewer
- Home design: Townhouse; Entry level on first floor
- Construction: Vinyl siding; Shingle (asphalt) roof
- Exterior features: Deck; Patio; Paved driveway; Back yard fencing; Landscaped, level and cleared lot
Interior
- Kitchen: Dishwasher; Microwave; Range; Refrigerator
- Bedrooms: Primary bedroom on second level; Additional bedroom(s) on second level
- Flooring: Tile; Vinyl; Carpet; Laminate
- Bathrooms: Two full bathrooms on second level; One half bathroom on first level
- Heating & cooling: Forced air heating; Natural gas
- Interior features: Walk-in closet(s); Ceramic tile bath; 7 total rooms
- Laundry & utility: Washer and dryer included; Laundry located in bathroom and in a laundry closet
Neighborhood map
What this means for you Summary
Snapshot
- This is a 2-bed/2.5-bath townhouse listed at $300k.
Deal economics
- At list price, monthly cash flow is $-47 ($-567/yr) — negative.
- To cash-flow at today's rent, offer at most $292k (2.8% below list).
- To meet the 1% rule (rent ≥ 1% of price), the offer needs to be $246k (17.9% below list).
- Recommended offer: $246k (17.9% below list) — sets the bar for 1% rule.
- Cap rate 6.1% vs local median 2.4% in Milton — top-decile yield for the area; either an underpriced asset or a hidden risk that comps aren't pricing in. Stress-test before assuming the spread holds.
Location & tenants
- Location reads 66/100 on livability (#652 in NY) — a middle-class / working-renter tenant base. Strengths: employment A+, housing A+, crime B+; Watch: amenities F, commute F, cost of living D-.
- Ballston Spa Central School District (suburban): math 54% / reading 55% proficiency, ranked #289 of 590 in NY (top 49%) — acceptable for families but not a draw, mixed tenant base, ~2y average lease.
- Zoned schools: Geyser Road Elementary School (math 67% / reading 67%, grade B+, #525 of 2,108 statewide, top 27%, 348 students, 34% FRL); Maple Avenue Middle School (math 46% / reading 69%, grade B, #187 of 729 statewide, top 26%, 1,392 students, 27% FRL); Ballston Spa Senior High School (math 92% / reading 64%, grade A-, #568 of 1,100 statewide, top 52%, 1,249 students, 32% FRL).
- Zoned-school proficiency averages 68% at this address vs 54% district-wide (+13 pts) — the actual schools serving this property are materially stronger than the Ballston Spa Central School District average implies; a family-tenant draw the district grade alone would hide.
- Market conditions: Rents rising fast (+11.3%/yr); 225 active listings in the ZIP; 2 comparable units currently listed for rent nearby; solid renter incomes; 1,132 units permitted in Saratoga County in 2024 (378 in 5+ unit buildings).
Forward outlook
- Local home prices are declining (-3.0%/yr); year-one equity from $2k of loan paydown is wiped out by about $9k of value loss. Plan a longer hold.
- Saratoga County population projected at +4% by 2050 — modest demand growth; plan on rents tracking national, not racing it.
Negotiation context
- Only 4 days on market — expect competitive offers; lowballing is unlikely to land.
- 3 sale attempts since 25y ago with the ask held roughly flat each time — persistent listings suggest the price (not the market) is what's stuck; bring a comps-based counter.
- Current owner paid $166k; list at $300k implies a 81% gain — meaningful room to come down on a strong offer.
Questions for the listing agent
- What do current leases actually rent for vs. the listed asking? Can we see a recent rent roll and the last 12 months of T-12 income?
- Is there a deadline driving the sale (1031 exchange, divorce, estate, relocation)? That informs how much negotiation room exists.
- The area grade is low — what's the realistic commute time and amenity access for the typical tenant pool here? Any planned neighborhood developments (good or bad) we should know about?
- What's the average days-on-market for RENTAL listings here right now (not sales)? A rising rental-DOM trend means longer vacancies and softer asking-rent achievability than the comps imply.
- What's the recent tenant-quality profile in this submarket — average credit score on applications, eviction rate, late-payment / NSF rate, and stable-employment percentage? A property-management company in the area should have these aggregated.
- How much new for-sale + rental construction is in the pipeline within 1–3 miles? Heavy new supply typically softens prices + rents 12–24 months out; constrained supply supports both.
Investment metrics
- 1% rule
- 0.82% ✗
- Cap rate
- 6.10%
- Cash-on-cash
- -0.67%
- DSCR
- 0.97
- GRM
- 10.1
CMA / ARV
- ARV (on-the-fly)
- $301,920
- Comps found
- 11
Show comp detail 11 sales within ~0.75 mi
| Address | Dist | Beds/Ba | Sqft | Sold | Price | $/sf | Match |
|---|---|---|---|---|---|---|---|
| 412 Antler Ct | 0.11mi | 2/2.5 | 1,480 (0%) | 2mo | $330,000 | $223 | 93 |
| 214 Whitetail Ct | 0.10mi | 3/1.5 (+1) | 1,480 (0%) | 1mo | $330,000 | $223 | 86 |
| 32 Deer Run Dr | 0.15mi | 2/2.5 | 1,480 (0%) | 10mo | $325,000 | $220 | 85 |
| 536 Elk Cir | 0.05mi | 2/2.5 | 1,480 (0%) | 18mo | $285,000 | $193 | 83 |
| 89 Deer Run Dr | 0.03mi | 3/1.5 (+1) | 1,480 (0%) | 9mo | $275,000 | $186 | 82 |
| 310 Caribou Ct | 0.08mi | 3/1.5 (+1) | 1,480 (0%) | 6mo | $302,000 | $204 | 82 |
| 515 Elk Cir | 0.10mi | 2/2.5 | 1,480 (0%) | 18mo | $240,000 | $162 | 80 |
| 44 Deer Run Dr | 0.18mi | 3/2.5 (+1) | 1,480 (0%) | 7mo | $308,000 | $208 | 80 |
| 110 Deer Run Dr | 0.15mi | 3/1.5 (+1) | 1,480 (0%) | 11mo | $305,000 | $206 | 75 |
| 408 Antler Ct | 0.14mi | 2/2.5 | 1,480 (0%) | 23mo | $270,000 | $182 | 75 |
| 102 Deer Run Dr | 0.16mi | 2/2.5 | 1,480 (0%) | 23mo | $276,000 | $186 | 73 |
Match score weights: distance 35% · size 25% · config 20% · recency 20%. Top-matched comps best support the ARV.
Projected returns pro-forma
-3.0% appreciation · 8.0% rent growth · sell at horizon
- IRR
- -12.2%
- Equity multiple
- 0.54×
- Total profit
- $-38,603
- Equity at exit
- $44,716
- IRR
- 3.0%
- Equity multiple
- 1.26×
- Total profit
- $21,692
- Equity at exit
- $25,930
Cash invested: $83,972 (down + closing). Projections, not guarantees.
Landlord ↔ Tenant lean methodology
- Overall (STATE)
- 15 Strongly Tenant-Friendly
- State New York
- 15 Strongly Tenant-Friendly · D+10
- County
- — inherits STATE
- City
- — inherits STATE
ZIP-level market 12020
- Home prices YoY
- -14.8%
- Rents YoY
- 11.3%
- Active inventory
- 225
- Price-to-rent
- 10.1×
Monthly cashflow live
- Estimated rent
- $2,462 medium interval (Pro) →
- Mortgage (P&I)
- −$1,573
- Tax from tax record
- −$295 /mo · $3,538/yr
- Insurance
- −$125
- HOA
- −$0
- Vacancy / Maint / Mgmt
- −$517
- Net cashflow
- $-47
Break-even live
Sensitivity live
| Price | -10% $123 | -5% $38 | +0% $-47 | +5% $-132 | +10% $-217 |
|---|---|---|---|---|---|
| Rent | -10% $-242 | -5% $-144 | +0% $-47 | +5% $50 | +10% $147 |
| Rate | -1.0pp $104 | -0.5pp $29 | base $-47 | +0.5pp $-125 | +1.0pp $-204 |
UW: 25.0% down · 7.5% · 30yr · 1.5% tax · 5.0% vac · 8.0% maint · 8.0% mgmt
Financing live
Cash to close
- Down payment
- $74,975
- Closing costs
- $8,997
- Reserves months
- —
- Total cash needed
- —
Loan-product check · same deal, 3 products live
Conventional
25% down · 7.5% · 30yr
- Down + closing
- —
- Monthly P&I
- —
- Monthly cashflow
- —
- DSCR
- —
- Eligible?
- —
Personal DTI + credit; lowest rate.
DSCR
20% down · 8.5% · 30yr
- Down + closing
- —
- Monthly P&I
- —
- Monthly cashflow
- —
- DSCR
- —
- Eligible?
- —
No personal income docs; deal must DSCR.
Hard money
10% down · 12.0% · 12mo
- Down + closing
- —
- Monthly P&I
- —
- Monthly cashflow
- —
- DSCR
- —
- Eligible?
- —
Short-term bridge; refi at stabilization.
Rent comps 2 comps
| Address | Beds | Baths | Sqft | Rent | $/sqft | DOM | Units | Dist |
|---|---|---|---|---|---|---|---|---|
| 91 Hutchins Rd Ballston Spa, NY | 2.0 | 2.0 | 1316 | $3,050 | $2.32 | 15d | 7 | 0.69mi |
| 100 Madison Dr Ballston Spa, NY | 1.0–3.0 | 1.0–2.5 | 1145 | $2,633 | $2.30 | 15d | 41 | 0.98mi |
Listing history 5 events
-
2026-06-09status $299,900 Pending 4 DOM
-
2026-06-08days on market $299,900 Active 4 DOM
-
2026-06-07days on market $299,900 Active 3 DOM
-
2026-06-05remarks 699-char remark
-
2026-06-05$299,900 Active 1 DOM
ⓘ Source: listings_history table (triggers on properties + properties_extension) + one-shot
backfill from property_details.listing_events for pre-trigger history.
Tax reassessment forecast NY · Partial reset (capped growth)
- Current annual tax
- $3,538 · $295/mo
- Projected year-2 tax
- $4,303 · $359/mo
- Expected delta
- +$765/yr (+$64/mo · 21.6%)
ⓘ Screening estimate from a state-policy table — verify with the county assessor before closing.
Climate risk First Street
- Flood 1/10 Low FEMA zone X · 0% chance over 30 yrs
- Wildfire 3/10 Moderate
- Heat 3/10 Moderate 7 d/yr ≥97°F today · 16 d/yr by 30 yrs out
- Wind 2/10 Low 4% chance of damaging wind over 30 yrs
- Air quality 2/10 Low 0 unhealthy d/yr today · 1 by 30 yrs out
Nearby sold comps map
Loading sold comps map…
Walkable amenities ~0.75 mi
Loading nearby amenities…
Taxation est. · year 1
- Rental income
- $29,549
- − Mortgage interest
- −$16,799
- − Property taxes
- −$3,538
- − Insurance
- −$1,500
- − Repairs & maintenance
- −$2,364
- − Management
- −$2,364
- − Depreciation
- −$8,724
- Taxable loss
- −$5,740
- Est. tax savings @ 24.0%
- +$1,378
- After-tax cash flow
- $811/yr
For passive investors: Depreciation is non-cash, so a rental often shows a tax loss while cash-flowing — sheltering income. Rental losses are passive: they offset passive income freely, and up to $25,000/yr can offset ordinary (W-2) income if you actively participate and your MAGI is under $100k (phasing out to $0 by $150k); unused losses carry forward. On sale, claimed depreciation is recaptured at up to 25%, and gains may owe capital-gains tax (a 1031 exchange can defer both). Figures are a year-1 estimate at your 24.0% rate — not tax advice; consult a CPA.
Schools (NCES district)
- District
- Ballston Spa Central School District
- NCES district ID
- 3603930
- Math proficiency
- 54% ▼ -13.00%
- Reading proficiency
- 55% ▼ -4.00%
- Median HH income
- $66,705
- Composite
- 48.12/100
- National rank
- #2184
- State rank
- #289 of 590 in NY
Livability — Milton
- Score
- 66/100
- State rank
- #652
- US rank
- #11825
Category grades
Schools grade is shown separately in the Schools card above.
Census & demographics
- County
- Saratoga County · 166,192 people
- Metro
- Albany-Schenectady-Troy, NY
- Population (ZIP)
- 34,937
- Household income
- $107,112
- Rent vs Own
- Severe rent burden
- 607.0
Population outlook (Saratoga County) Hauer SSP2
- Today (2025)
- 238,889 people
- By 2030
- 243,681 · +2.0%
- By 2040
- 249,118 · +4.3%
- By 2050
- 248,638 · +4.1%
- By 2075
- 241,675 · +1.2%
- By 2100
- 213,150 · -10.8%
Race, ethnicity, and origin ACS 2023
- Neighborhood character
- Predominantly White (89%)
- Race & ethnicity
- White 89% Two or more races 4% Hispanic / Latino 4% Asian 2% Black 2%
- Common ancestry
- Romanian 6% Lithuanian 6% Iranian 2%
- Foreign-born
- 4% · Canada, China
- Languages at home
- 95% English-only · Chinese 1% Spanish 1% Other Asian/Pacific 1%
Political lean MEDSL · Saratoga
- 2024 margin
- Toss-up / Even · D 50.9% · R 49.1%
- 2008→2024 swing
- -1.6pp toward R · 2008: 3.4pp · 2024: 1.8pp
- All cycles
- 2024: D+1.8 2020: D+5.4 2016: R+4.4 2012: D+2.1 2008: D+3.4
Not yet ingested
- Civics
- —
Market trends
- HPI YoY
- ▼ -60.23%
- Current HPI
- 346.5996
- Rent YoY
- ▲ 11.26%
- Metro
- Albany-Schenectady-Troy, NY
- State GDP YoY
- ▲ 2.60%
- F500 in state
- 92
Industry mix (Fortune 500 HQ in NY)
| Industry | F500 HQs | Revenue |
|---|---|---|
| Financial Services | 10 | $950B |
|
||
| Consumer Goods | 9 | $162B |
|
||
| Insurance | 4 | $225B |
|
||
| Telecommunications | 2 | $144B |
|
||
| Pharmaceuticals | 2 | $112B |
|
||
| Media / Entertainment | 2 | $69B |
|
||
Price history
+319.4% since first listed10 events — show timeline
- 2026-06-04 Listed $299,900 Global MLS
- 2007-08-08 Sold (Public Records) $165,500 Public Records
- 2002-12-13 Sold (MLS) $88,500 Global MLS
- 2002-11-14 Listing Removed — Global MLS
- 2002-11-01 Listed $85,500 Global MLS
- 2001-06-14 Sold (Public Records) $73,000 Public Records
- 2001-05-31 Sold (MLS) $73,000 Global MLS
- 2001-04-17 Listing Removed — Global MLS
- 2001-04-12 Listed $74,500 Global MLS
- 1994-02-04 Sold (Public Records) $71,500 Public Records
Property tax history
+2.0%/yrLatest (2025): $3,538 · +2.4% YoY. Source: county tax records.
Cash-flow waterfall
monthlySold comps — $/sqft
last 12 mo · ≤1 miLoading sold comps…