 Duplex
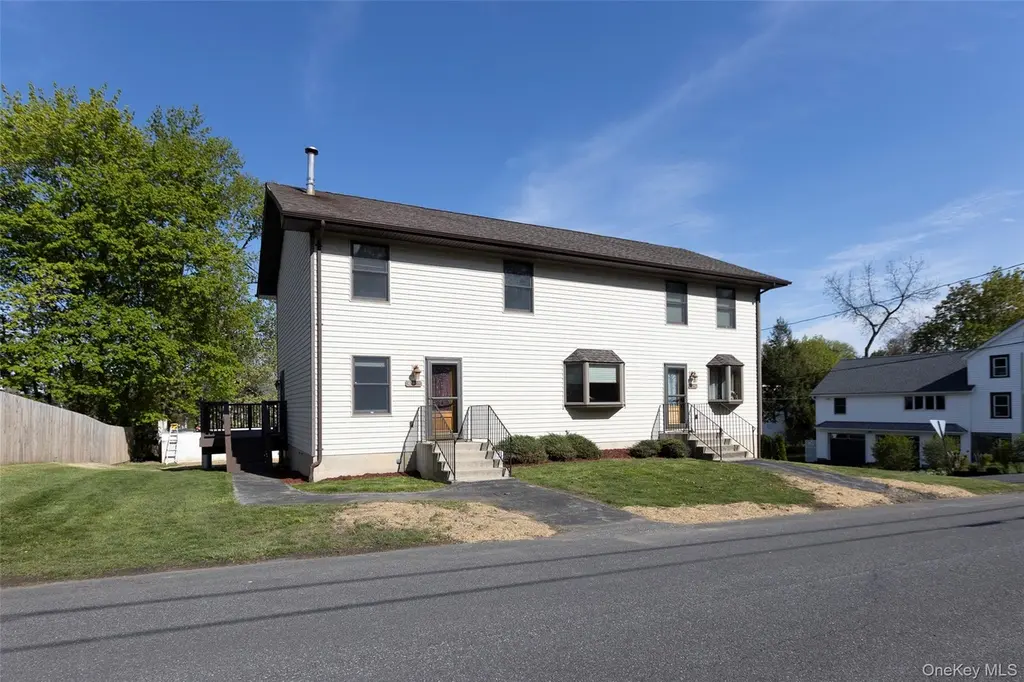
45 Orange · Marlboro, NY
Flood risk 1/10 · Minimal
- FEMA flood zone
- X (unshaded)
- Chance of flooding over 30 yrs
- 0.0%
- Est. flood insurance / yr
- $473 – $860
Fire risk 1/10 · Minimal
- Est. fire insurance / yr
- $691 – $1,283
Heat risk 5/10 · Moderate
- Hot days now (above 100°F)
- 7 days/yr
- Hot days in 30 yrs
- 15 days/yr
Wind risk 4/10 · Minor
- Chance of severe wind over 30 yrs
- 13.0%
Air-quality risk 2/10 · Minimal
- Unhealthy air days now
- 1 days/yr
- Unhealthy air days in 30 yrs
- 2 days/yr
Risk factors via First Street. Map © Google.
Why this score? — see what drove the A grade
The composite is a weighted blend of 9 inputs, each scored 0–100. Each bar is that input's sub-score; the figure is the points it added to the 100-point composite (weight × sub-score).
- Cash flow +28.6/30.0
- ARV discount +15.0/15.0
- DSCR +10.0/10.0
- Appreciation +9.5/10.0
- 1% rule +7.9/10.0
- Schools +4.4/10.0
- Condition / age +3.8/5.0
- Livability +3.6/5.0
- Rent growth +2.5/5.0
$475,000
🖨 Deal sheet 📄 Offer letter ✓ Due diligence
Multi-family units
County records classify this as Multi-Family (2-4 Unit). Listing-text estimate: 2 units. confirmed
Listing remarks
2 family in the heart of the Hudson Valley. Very well maintained property within walking distance to fabulous dining, art galleries, cafes and music venue. Award winning wineries, farm markets and rail trails abound. Move in condition! Property features a huge 560 square foot deck, a separate 750 square foot garage with heat, electricity and water. Could be rented out for extra income or used for many other purposes. Main unit features giant walk in closet and very oversized laundry room. Don't pass up this unique opportunity!
Key facts
- Music venue
- Farm markets
- Art galleries
Tags
Property features AI
Finance
- Financial info: Tax year 2026 (municipality) — tax information available
Exterior
- Parking: Heated garage; Garage (4 spaces)
- Utilities: Electricity connected (Central Hudson); Public sewer
- Home design: Duplex; Total building area approximately 2,700
- Construction: Frame construction
- Exterior features: Frame construction; Not waterfront; No additional parcels
Interior
- Bedrooms: One 1-bedroom unit; One 2-bedroom unit
- Bathrooms: Three full bathrooms
- Heating & cooling: Central air conditioning; Oil heating
- Interior features: Chandelier in primary bathroom; Partially finished basement with storage space and walk-out access
Neighborhood map
What this means for you Summary
Snapshot
- This is a 2 × 3-bed/3.0-bath units multifamily listed at $475k. Condition is rated good.
Deal economics
- At list price, monthly cash flow is $2k ($19k/yr) — positive. Per door: $786/mo.
- The deal already cash-flows at list — no discount required.
- Meets the 1% rule at list price ($6k rent vs $475k).
- Recommended offer: $468k (1.5% below list) — sets the bar for market timing.
- Cap rate 10.3% vs local median 3.0% in Marlboro — top-decile yield for the area; either an underpriced asset or a hidden risk that comps aren't pricing in. Stress-test before assuming the spread holds.
Location & tenants
- Location reads 72/100 on livability (#347 in NY) — a middle-class / working-renter tenant base. Strengths: employment A+, housing A+, crime A; Watch: cost of living D+, amenities F, commute D-.
- Marlboro Central School District (suburban): math 43% / reading 55% proficiency, ranked #366 of 590 in NY (top 62%) — families likely to look elsewhere, expect single-tenant / working-renter base with shorter leases.
- Zoned schools: Marlboro Elementary School (math 28% / reading 50%, grade F, #1,505 of 2,108 statewide, top 72%, 761 students, 0% FRL); Marlboro Middle School (math 36% / reading 43%, grade F, #418 of 729 statewide, top 59%, 433 students, 45% FRL); Marlboro Central High School (math 92% / reading 92%, grade A+, #171 of 1,100 statewide, top 18%, 628 students, 37% FRL) — zoned schools at 27% FRL track the district average.
- Market conditions: 56 active listings in the ZIP; 464 units permitted in Ulster County in 2024 (170 in 5+ unit buildings).
Forward outlook
- In year one you build about $46k of equity ($3k loan paydown + $43k appreciation (9.0% local appreciation)).
- Ulster County population projected at -14% by 2050 — secular population decline; favor cash flow + early exit over multi-decade hold.
- At projected returns (9.0% appreciation + 3.0% rent growth), your $133k cash investment doubles in ~2 years — after that, you're playing with house money.
- By year 2, paydown + projected appreciation supports a ~$74k cash-out refi (75% LTV) — recoverable capital for the next deal without selling this one.
Negotiation context
- It's been on market 26 days — a 2% lower offer ($468k) is reasonable based on typical stale-listing flexibility.
Risks & watch-outs
- Climate carrying-cost: extreme-heat days projected 7→15/yr by 2055 (HVAC capex compounding) — expect insurance premiums to compound above CPI over the hold.
Questions for the listing agent
- Can we see the unit-by-unit rent roll, current vacancy, and any below-market leases? What's the average tenancy length?
- What capital expenditures (roof, boiler, parking lot, exteriors) have been made in the last 5 years, and what's planned in the next 2?
- Is there a deadline driving the sale (1031 exchange, divorce, estate, relocation)? That informs how much negotiation room exists.
- Schools are B-rated — typically a magnet for longer-tenancy family renters. What's the average tenant stay here, and is there a school-zone premium baked into asking?
- What's the average days-on-market for RENTAL listings here right now (not sales)? A rising rental-DOM trend means longer vacancies and softer asking-rent achievability than the comps imply.
- What's the recent tenant-quality profile in this submarket — average credit score on applications, eviction rate, late-payment / NSF rate, and stable-employment percentage? A property-management company in the area should have these aggregated.
- How much new apartment / multifamily construction is in the pipeline within 1–3 miles? Heavy new supply (>2% of stock underway) typically softens rents 12–24 months out; light construction supports rent growth.
Investment metrics
- 1% rule
- 1.29% ✓
- Cap rate
- 10.26%
- Cash-on-cash
- 14.18%
- DSCR
- 1.63
- GRM
- 6.4
CMA / ARV
- ARV (median comp)
- $839,268
- List price
- $475,000
- Delta
- -43.40%
- Verdict
- UNDERPRICED
- Comps
- 6 within 1.0 mi
Projected returns pro-forma
8.97% appreciation · 3.0% rent growth · sell at horizon
- IRR
- 32.9%
- Equity multiple
- 3.45×
- Total profit
- $325,677
- Equity at exit
- $392,619
- IRR
- 28.8%
- Equity multiple
- 7.57×
- Total profit
- $873,858
- Equity at exit
- $811,747
Cash invested: $133,000 (down + closing). Projections, not guarantees.
Landlord ↔ Tenant lean methodology
- Overall (STATE)
- 15 Strongly Tenant-Friendly
- State New York
- 15 Strongly Tenant-Friendly · D+10
- County
- — inherits STATE
- City
- — inherits STATE
ZIP-level market 12542
- Home prices YoY
- 2.8%
- Active inventory
- 56
- Price-to-rent
- 12.9×
Monthly cashflow live
- Estimated rent
- $6,144 medium interval (Pro) →
- Mortgage (P&I)
- −$2,491
- Tax est. 1.5%
- −$594 /mo · $7,125/yr
- Insurance
- −$198
- HOA
- −$0
- Vacancy / Maint / Mgmt
- −$1,290
- Net cashflow
- $1,571
Break-even live
2-unit breakdown (identical units grouped — click to expand)
| Units | Beds | Baths | Est. rent |
|---|---|---|---|
| 2× units | 3 | 3 | $6,144 |
| #1 | 3 | 3 | $3,072 |
| #2 | 3 | 3 | $3,072 |
| Total (2 units) | $6,144 | ||
UW: 25.0% down · 7.5% · 30yr · 1.5% tax · 5.0% vac · 8.0% maint · 8.0% mgmt
Financing live
Cash to close
- Down payment
- $118,750
- Closing costs
- $14,250
- Reserves months
- —
- Total cash needed
- —
Loan-product check · same deal, 3 products live
Conventional
25% down · 7.5% · 30yr
- Down + closing
- —
- Monthly P&I
- —
- Monthly cashflow
- —
- DSCR
- —
- Eligible?
- —
Personal DTI + credit; lowest rate.
DSCR
20% down · 8.5% · 30yr
- Down + closing
- —
- Monthly P&I
- —
- Monthly cashflow
- —
- DSCR
- —
- Eligible?
- —
No personal income docs; deal must DSCR.
Hard money
10% down · 12.0% · 12mo
- Down + closing
- —
- Monthly P&I
- —
- Monthly cashflow
- —
- DSCR
- —
- Eligible?
- —
Short-term bridge; refi at stabilization.
Listing history 2 events
-
2026-04-24price $475,000 541-char remark
-
2026-04-24$475,000,000 Active 541-char remark
ⓘ Source: listings_history table (triggers on properties + properties_extension) + one-shot
backfill from property_details.listing_events for pre-trigger history.
Climate risk First Street
- Flood 1/10 Low FEMA zone X (unshaded) · 0% chance over 30 yrs
- Wildfire 1/10 Low
- Heat 5/10 Major 7 d/yr ≥100°F today · 15 d/yr by 30 yrs out
- Wind 4/10 Moderate 13% chance of damaging wind over 30 yrs
- Air quality 2/10 Low 1 unhealthy d/yr today · 2 by 30 yrs out
Nearby sold comps map
Loading sold comps map…
Walkable amenities ~0.75 mi
Loading nearby amenities…
Taxation est. · year 1
- Rental income
- $73,728
- − Mortgage interest
- −$26,607
- − Property taxes
- −$7,125
- − Insurance
- −$2,375
- − Repairs & maintenance
- −$5,898
- − Management
- −$5,898
- − Depreciation
- −$13,818
- Taxable income
- $12,006
- Est. tax owed @ 24.0%
- −$2,881
- After-tax cash flow
- $15,972/yr
For passive investors: Depreciation is non-cash, so a rental often shows a tax loss while cash-flowing — sheltering income. Rental losses are passive: they offset passive income freely, and up to $25,000/yr can offset ordinary (W-2) income if you actively participate and your MAGI is under $100k (phasing out to $0 by $150k); unused losses carry forward. On sale, claimed depreciation is recaptured at up to 25%, and gains may owe capital-gains tax (a 1031 exchange can defer both). Figures are a year-1 estimate at your 24.0% rate — not tax advice; consult a CPA.
Condition & rehab AI · 13 photos
This multi-family home is in good condition with a well-maintained exterior and interior. It is move-in ready and has potential for further value through minor cosmetic updates.
Value-add opportunities
- Resale Paint the exterior siding — Fresh paint can enhance the curb appeal and make the home look more inviting to potential buyers.
- Rental Clean and maintain the deck — A clean and well-maintained deck can attract tenants and add value to the rental property.
- Both Inspect and clean the gutters — Clean gutters can prevent water damage and improve the overall appearance of the home.
Renovation cost estimate screening
Value-add ROI direction
- Resale Paint the exterior siding — Fresh paint can enhance the curb appeal and make the home look more inviting to potential buyers. ↑
- Rental Clean and maintain the deck — A clean and well-maintained deck can attract tenants and add value to the rental property. ↑
- Both Inspect and clean the gutters — Clean gutters can prevent water damage and improve the overall appearance of the home. ↑
ⓘ Cost ranges are severity-bucket heuristics (US national rule-of-thumb). Get contractor quotes + a written scope before underwriting a rehab budget.
Schools (NCES district)
- District
- Marlboro Central School District
- NCES district ID
- 3618570
- Math proficiency
- 43% ▼ -10.00%
- Reading proficiency
- 55% ▲ 8.00%
- Median HH income
- $68,737
- Composite
- 43.7/100
- National rank
- #2953
- State rank
- #366 of 590 in NY
Livability — Marlboro
- Score
- 72/100
- State rank
- #347
- US rank
- #5847
Category grades
Schools grade is shown separately in the Schools card above.
Census & demographics
- Census place
- Marlboro, NY
- Population (ZIP)
- 5,859
Population outlook (Ulster County) Hauer SSP2
- Today (2025)
- 175,887 people
- By 2030
- 171,876 · -2.3%
- By 2040
- 161,771 · -8.0%
- By 2050
- 151,470 · -13.9%
- By 2075
- 133,023 · -24.4%
- By 2100
- 113,504 · -35.5%
Race, ethnicity, and origin ACS 2023
- Neighborhood character
- Predominantly White (74%)
- Race & ethnicity
- White 74% Hispanic / Latino 14% Two or more races 11% Black 5%
- Hispanic origin (detail)
- Mexican 4% Puerto Rican 3% Dominican 2%
- Common ancestry
- Lithuanian 3% Romanian 3% Slovak 2%
- Foreign-born
- 7% · Canada, Jamaica
- Languages at home
- 88% English-only · Spanish 8% Other Indo-European 2% Arabic 1%
Political lean MEDSL · Ulster
- 2024 margin
- D (+18.7) · D 59.3% · R 40.7%
- 2008→2024 swing
- -4.9pp toward R · 2008: 23.6pp · 2024: 18.7pp
- All cycles
- 2024: D+18.7 2020: D+20.9 2016: D+9.1 2012: D+21.9 2008: D+23.6
Not yet ingested
- Civics
- —
Market trends
- HPI YoY
- ▲ 8.97%
- Current HPI
- 325.4749
- Rent YoY
- —
- Metro
- —
- State GDP YoY
- ▲ 2.60%
- F500 in state
- 92
Industry mix (Fortune 500 HQ in NY)
| Industry | F500 HQs | Revenue |
|---|---|---|
| Financial Services | 10 | $950B |
|
||
| Consumer Goods | 9 | $162B |
|
||
| Insurance | 4 | $225B |
|
||
| Telecommunications | 2 | $144B |
|
||
| Pharmaceuticals | 2 | $112B |
|
||
| Media / Entertainment | 2 | $69B |
|
||
Price history
-99.9% since first listed3 events — show timeline
- 2026-05-20 Pending — OneKey® MLS as Distributed by MLS Grid
- 2026-04-24 Price Changed $475,000 OneKey® MLS as Distributed by MLS Grid
- 2026-04-24 Listed $475,000,000 OneKey® MLS as Distributed by MLS Grid
Cash-flow waterfall
monthlySold comps — $/sqft
last 12 mo · ≤1 miLoading sold comps…